STUDY AREA AND DATA
Greater Bangalore (figure 1) is the administrative cultural, commercial, industrial, and knowledge capital of the state of Karnataka with an area of 741 sq. km. and lies between the latitudes 12°39’00’’ to 13°13’00’’ N and longitude 77°22’00’’ to 77°52’00’’ E. Bangalore city administrative jurisdiction was widened in 2006 by merging the existing area of Bangalore city spatial limits with 8 neighbouring Urban Local Bodies (ULBs) and 111 Villages of Bangalore Urban District. Bangalore has grown spatially more than ten times since 1949 (69 square kilometers) and is the fifth largest metropolis in India currently with a population of about 7 million (Ramachandra and Kumar, 2008).
The data used were IKONOS PAN from 525.8 – 928.5 μm at 1 m spatial resolution acquired on February 23, 2004 and 4 m resolution MSS bands in Blue, Green, Red and NIR part of the electromagnetic spectrum, acquired on November 24, 2004. The size of high resolution (HR) PAN and low resolution (LR) MSS images, covering a portion of Bangalore city, India, is 1200 x 1600 and 300 x 400 respectively. The pairs of the images were geometrically registered and the LR PAN image was upsampled to 1200 x 1600 by nearest neighbour algorithm. The other data used in the study were Landsat MSS bands of 1973, IRS LISS-III of 2006, and Google Earth image (http://earth.google.com).
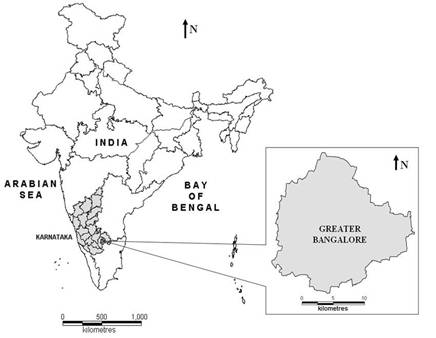
Figure 1: Study area – Greater Bangalore, India.
|