ANALYSIS AND RESULTS
The correlation coefficient (CCs) between PAN and the original Green band was 0.44, PAN and Red was 0.47 and PAN and NIR was 0.59. The SFIM result based on the fusion of IKONOS MSS and PAN data is given in Figure 2.
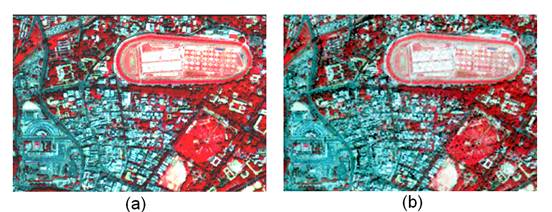
Figure 2: FCC of the IKONOS PAN and MSS (a) original bands at 4m, (b) fused bands at 1m.
The performance of the technique was analysed quantitatively by checking the CC that is often used as a similarity metric in image fusion as given in table 1. HIS (Hue-Intensity-Saturation) and BT (Brovey Transform) methods can handle only three bands so G (band 2) – R (band 3) – NIR (band 4) combination was chosen for false colour composite (FCC). CC between original band 2 and 3 and fused bands from Brovey and SFIM is almost equal. However, the CC of the original band 4 (NIR band) and SFIM fused band 4 is higher than Brovey and HIS. Since NIR band is very useful for vegetation and water discrimination and has the highest correlation (0.59) with PAN band, therefore, SFIM is better than the other two methods.
Table 1: CC between original bands and the fused bands from different techniques.
| Fusion techniques |
Band 2 |
Band 3 |
Band 4 |
| HIS |
0.22 |
0.32 |
0.17 |
| Brovey |
0.99 |
0.98 |
0.67 |
| SFIM |
0.96 |
0.98 |
0.97 |
In addition, a universal image quality index (UIQI) (Wang et al., 2005) was used to measure the similarity between two images. UIQI is designed by modeling any image distortion as a combination of three factors: loss of correlation, radiometric distortion, and contrast distortion given by:
 |
(9) |
The first component is the CC for A (original MSS band) and B (fused MSS band). The second component measures how close the mean gray levels of A and B is, while the third measures the similarity between the contrasts of A and B. The dynamic range is [-1, 1]. If two images are identical, the similarity is maximal and equals 1. This index showed that the SFIM preserves spectral properties even better than Brovey and HIS techniques (Kumar et al., 2009) as given in table 2.
Table 2: UIQI values for the fused bands from different techniques.
| Fusion techniques |
Original |
| Band 2 |
Band 3 |
Band 4 |
| HIS (Band 2) |
0.17 |
0.27 |
0.11 |
| Brovey (Band 3) |
1.00 |
0.97 |
0.63 |
| SFIM (Band 4) |
0.97 |
0.97 |
0.97 |
SFIM is more sensitive to image co-registration accuracy. Inaccurate co-registration may result in blurring edges in the fused images. This problem can be resolved using a smoothing filter with a kernel, larger than the resolution ratio between the higher and lower resolution images. The HIS and Brovey transform fusion techniques are not sensitive to the co-registration accuracy as the topographic/textural features are totally replaced by the intensity replacement image. This may not necessarily be an advantage. The SFIM technique is not applicable for fusing images that are fundamentally different in physical properties, such as the fusion between optical images and radar images. SFIM fusion technique aided in integrating a lower spatial resolution MSS image with a higher spatial resolution PAN image. Spatial details were modulated to a co-registered LR MSS image without altering its spectral properties and contrast by using a ratio between a higher resolution image and its low pass filtered image. The visual evaluation and statistical analysis confirms that SFIM is a superior fusion technique for improving spatial detail of MSS images with the preservation of spectral properties.
Figure 3 shows the classified image of 1973 (79 m) and 2006 (23.5 m) obtained with four land use categories (built-up, vegetation, water and open land) for Greater Bangalore. The fused image has retained both the spectral and spatial properties and gives finer details not visible in the two LR classified images. Table 3 gives the details of the classified images.
Table 3: Landuse statistics of Greater Bangalore.
Year  Class Class  |
Built up |
Vegetation |
Water |
Others |
| 1973 |
Ha |
5448 |
46639 |
2324 |
13903 |
| % |
7.97 |
68.27 |
3.40 |
20.35 |
| 2006 |
Ha |
29535 |
19696 |
1073 |
18017 |
| % |
43.23 |
28.83 |
1.57 |
26.37 |
Temporal analysis of Greater Bangalore data showed that there has been a 466% increase in built up area from 1973 to 2006 leading to decline of 54% area in water bodies, attributing to intense urbanisation process. The rapid development of urban sprawl has many potentially detrimental effects including the loss of valuable agricultural and eco-sensitive (e.g. wetlands, forests) lands, enhanced energy consumption and greenhouse gas emissions from increasing private vehicle use (Ramachandra and Kumar, 2008).
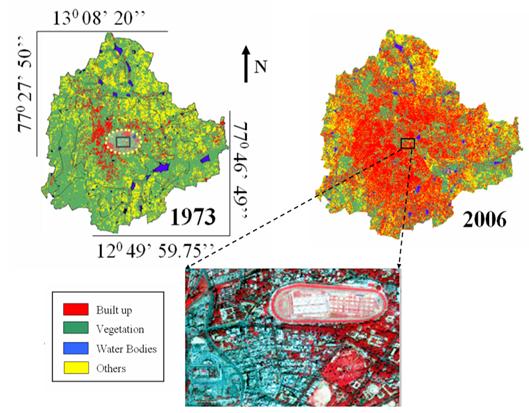
Figure 3: Classified images of 1973 and 2006. Fused image of area highlighted in rectangular box in the two classified images.
Vegetation has decreased by 58% from 1973 to 2006. Multi-storied buildings have come up on some lake beds that have totally intervene the natural catchment flow leading to artificial floods (Ramachandra and Kumar, 2008). Urbanisation has also enhanced land surface temperature in urban areas from the circumference ground creating heat island effects. |