Chapter 3: Materials and Methods
Chapter 3: Materials and Methods |
This section describes the methodology and analytical procedures followed for the study. First part describes the method used for anaerobic digestion of solid waste using solid-state stratified bed reactor (SSB) process. The decomposition pattern of various feedstocks has been studied. This decomposition pattern of the feedstocks studied was finally correlated with daily gas production rates. This correlation provided the basis to estimate efficiencies of conversion to biogas. In the second part decomposition of a liquid waste in a down-flow fixed bed reactor (DFBR) was studied. The overall intention is that solid wastes digested in a SSB reactor provide necessary support material for immobilization of methanogenic bacteria. In this, digested waste acting as bed material (immobilized methanogenic biofilm) is studied for their efficiency to treat the liquid waste; finally, a potential for simultaneous conversion of solid and liquid wastes. In addition, BMP assay was performed to determine the ultimate methane yield of feedstock studied.
Experiment was carried out in two runs. Preliminary run recorded the fermentation of 11 feedstock for 70days. Fermentation characteristics and anaerobic digestion properties of these feedstocks and extent of gas production were studied (Chanakya et al ., 1997) extensively in the past. Based on the first run experimental results, feedstocks were chosen for second run experiment. Wherever the samples have produced biogas with the volumetric efficiency close to 1L/L/d in the first run were chosen to determine the reproducibility of such high biogas yield. In a second run experiment, reactors were run in duplicates. In addition vegetable waste representing major part of USW was also included to determine biogas production of that feedstock.
3.1.1.1 SSB-reactor design
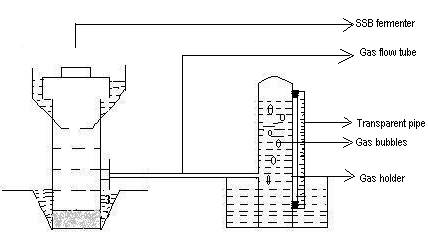
Fermentor used in this study was built using PVC irrigation quality pipes and comprised of the following features (Fig 3.1):
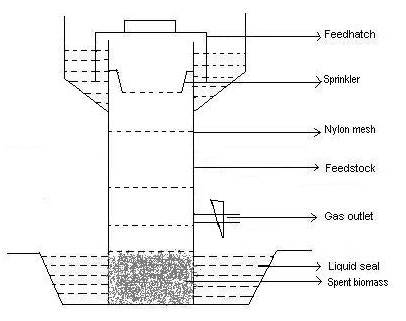
Fig 3.1. Sketch of SSB reactor.
Fig 3.2. Sketch showing gas measurement by downward displacement of water.
3.1.1.2. Feedstock & Collection
Two types of feedstocks were used for the study, fresh feedstock and dry feedstocks, shown in the Table 3.1.
S.No. |
Fresh feedstock |
Dry feedstock |
1. |
Vegetable wastes Mixed fruit wastes Watermelon rind (25%) Orange peel (25%) Banana peel (25%) Sweet Lime (Mosambi) peel (25%) |
Bagasse |
2. |
Water hyacinth leaves |
Photocopying paper |
3. |
Water hyacinth roots |
Sugarcane trash |
4. |
Water hyacinth whole plant |
Paddy straw |
5. |
Paper mulberry |
Dry water hyacinth |
Feedstock used for the study purpose was collected from the various places and are listed in Table 3.2.
S.No. |
Feedstock |
Place of collection |
1. |
Water hyacinth |
Hebbal lake. |
2. |
Paper mulberry |
CST, IISc campus. |
3. |
Fruit waste, Bagasse |
Fruit juice shop (IISc campus and in Yeshwantpur). |
4. |
Photocopying paper |
IISc Xerox center and in CES library. |
5. |
Sugarcane trash and Paddy straw |
From the small scale sugarcane juice expellers and shop. |
3.1.1.3 Rationale for the choice of feedstocks
The above said feedstocks were chosen, based on the following properties, makes it an attractive feed for energy recovery through biogas. Mixed fruit wastes represent a significant component of USW found on the campus as well as about 20% in the city of Bangalore (Rajabapaiah, 1990, 1995). Paper mulberry is one among the major tree species that contributes to leaf litter in IISc campus (Kumar et al., 2001). Paper mulberry has been chosen as a representative of rapidly decomposable species (Chanakya et al ., 1999) for their leaf litter. Water hyacinth represents a plant often used in nutrient harvest from tertiary treatment of wastewater. These can be harvested to provide energy and tested under SSB conditions for energy recovery. Photocopying paper represents a large paper component of USW on the campus (Kumar et al ., 2001). Paddy straw and bagasse represent natural material that can be used for packaging in urban areas as well as agro residues that have potential to survive long as biofilm support in DFFB reactors.
3.1.1.4 Feed rate
The feed rates adopted were 2 and 1gTS/L/d for fresh and dry feedstocks respectively. This feed rate was followed after the completion of the startup procedure. This feed rate has been arrived at from previous studies, which show that these are the maximum possible feed rates for these feedstocks for operating at 70d SRT.
3.1.1.5 Inoculum
Two kinds of inocula were used to ensure a rapid start-up of SSB digester a solid and a liquid inoculum. Digested biomass obtained from a 3m 3 pilot scale SSB reactor was used as a starting bed (source of pre-colonized methanogens) and this was the solid' inoculum. The digester liquid from the same pilot plant was used for initiating acidogenic digestion (liquid inoculum). This also served to hydrate dry feedstocks. The TS and VS of this inoculum are given in the Table 3.3.
S.NO. |
Inoculum |
%TS |
%VS |
COD mg/L |
1. |
Solid inoculum-spent biomass |
30 |
53 |
ND |
2. |
Liquid inoculum-digester liquid |
0.1 |
ND |
200 |
| ND not determined. | ||||
3.1.1.6. Start-up procedure
SSB Fermenters were placed in a plastic tub of 6L capacity as shown in Fig 3.1. To start the process, digested biomass from a pilot scale SSB fermentor was used as a starting bed, placed in the lower 5 cm of these lab scale fermentors. This bed contained digested biomass that had a large population of methanogenic bacteria. Such a bed is required to initiate the SSB process (Chanakya et al ., 1995). A perforated bowl (sprinkler) was placed at the top (Fig 3.1), and was followed by closing the feed hatch. The bottom trough in each of these fermenters was then filled with 5L of liquid inoculum. In order to ensure the right balance of methanogenic and acidogenic organisms, this inoculum was previously enriched with slow growing methanogens by adding 1mL/L acetic acid to the liquid inoculum for three consecutive days prior to startup. This ensured high activity of aceticlastic methanogens on the spent biomass bed also. Initially, 1L of the digester liquid was recycled everyday. This recycling through a sprinkler bowl facilitated the uniform distribution of digester liquid over the decomposing biomass bed. The daily recycling process resulted in the dissipation of VFA, generated in the acidogenic layer, which leached slowly to the lower parts of the biomass bed. This bed is intensely colonized by methanogens (Chanakya et al ., 1995) and leads to the rapid conversion of VFA leaching down to biogas. In addition to this, this liquid layer provided a liquid seal around the feed hatch. Consequently it maintained anaerobic conditions inside.
These fermenters were fed at weekly intervals as mentioned under feed rate. A nylon mesh was placed between the layer of each week's feed so as to facilitate the collection of week-wise samples of decomposed feedstocks for physico-chemical analyses to be carried out at the end of the study period. These fermenters were operated for 70 days in the above mode. Liquid recycling was carried out twice a day to provide a recycle rate of 0.5L/L/day. Recycle rate was increased up to 1L/L/day, when the pH levels fell or gas production levels decreased. This increased recycling rate ensured that the bed within did not have VFA rich pockets and caused inhibition to methanogenesis.
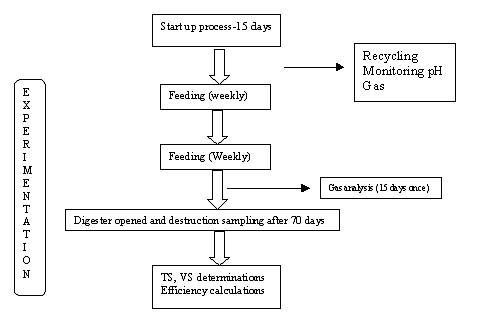
Fig 3.3. Overall experimental protocol
The sequence of operations and monitoring components are presented in Fig 3.3. The total run of the experiment lasted 70 days with a 15d-startup period, was followed by analysis of samples recovered from the destructive sampling of the fermentation feedstocks.
3.2 Biochemical methane potential assay (BMP)
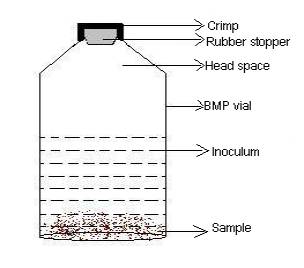
This assay was carried out to determine the ultimate methane yield of the feedstock. To prepare 1% and 2% TS suspension, 0.5 or 1g dried and powdered biomass samples were weighed and added to 133mL serum vials (Fig 3.4) in triplicates. 50mL of methanogen-enriched inoculum was added when all the vials were fed with feed stock samples. Following inoculum addition, these serum vials were rapidly flushed with biogas first and second with high purity nitrogen to remove all traces of oxygen. Flushing twice ensured that good anaerobic conditions prevailed in the headspace and methane levels in headspace were greatly diminished. These vials were closed with rubber stoppers immediately after flushing with biogas. After flushing with nitrogen using hypodermic/spinal needles, they were sealed with aluminum crimps. Then these vials were incubated at 35 ° C ( ± 2 ° C) in an incubator for determining the BMP.
Inoculum used for the study purpose was prepared using the digester liquid effluent from the pilot scale biogas reactor, which was filtered, through a mesh (2mm-pore size) to remove digested particles of leaf etc. It was supplemented with 1ml of acetic acid as a stimulant for aceticlastic methanogens for three consecutive days. After the third day, it was observed that the aceticlastic methanogenic population was high, this inoculum was used for the BMP assay. Control bottles received only the inoculum and not the substrate.
Fig 3.4. Sketch of BMP vial.
3.2.1. Measurement of produced gas in the BMP vials
The volume of gas produced in the BMP vials was measured by the downward displacement of water in an inverted burette (Fig 3.5). In the beginning gas volume was measured on alternate days. Then the sampling gap was increased to 7d, when the gas production rate decreased after 15 days. Subsequently between 35-90d the gas production was monitored at 15d intervals.
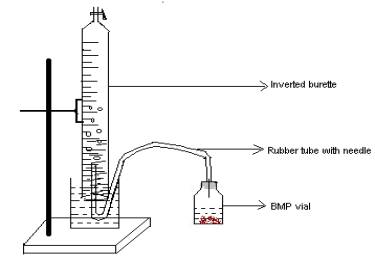
Fig 3.5. Sketch showing the set-up used for measurement of gas production from BMP vials
3.2.2. Composition of biogas
150 m L of headspace gas from the BMP vials were sampled using a microlitre syringe and its composition was determined using a gas chromatograph (Chemito 3800). The conditions of operation were as follows: - Detector- thermal conductivity detector (TCD), carrier gas hydrogen, flow rate- 20mL/min, temperature at various points in the GC was injector - 45 ° C, oven - 48 ° C, block - 90 ° C ± 0.5 ° C, mean constant temperature setting - 200 ° C. The TCD block was set to 90 ° C ± 0.5 ° C with a current level set to achieve a 200 ° C mean constant temperature (MCT) of the coils. This generally gave a current level of 180 m A. The signal was attenuated 64 times to suit a 1mv full-scale deflection (FSD) on a strip chart recorder to obtain hard copies of the chromatogram.
3.2.3. Estimation and interpretation of BMP results
The biogas potential was determined by carrying out biological methane potential assay (BMP) of the individual feedstock under laboratory conditions in micro-digesters with three replicates for each of the two concentrations tried. BMP assay has been developed to determine the ultimate biodegradability and associated methane yield estimates of organic substrates (Chynoweth et al., 1993; Gunaseelan, 2004). This basic procedure was modified to obtain, in addition to BMP, a greater extent of information on the fermentation properties and vulnerability to various forms of inhibition (Chanakya et al , 1997). This latter method is relatively simple and reliable method for comparison of extent and rate of conversion to methane. The results of modified BMP carried out under ideal conditions (temperature and known quantity of inoculum concentration) are presented in light of the following inferences that can be made:
Another indirect inference is the maximum solids residence time (SRT) under batch conditions of modified BMP assay. The period after which the gas production levels off is considered the maximum SRT required for batch fermentation. It is then acknowledged that the SRT required under continuous fermentation will be only a fraction of this period. The results of these modified BMP assays are arranged in the order of the dried feedstock presented first and the fresh feedstocks presented later.
3.3. Liquid waste treatment
Laboratory scale down-flow fixed bed reactor (DFFB), fabricated with transparent acrylic with a volume of 10L capacity was used for the study purpose (Fig 3.6). Digested biomass feedstocks was placed between two stainless steel meshes. In addition, it also contained two corrugated stainless steel meshes, one at the top and another one below, to prevent the biomass feedstock from floating as well as to assist easy release of gas. Between these meshes, the biomass feedstock to be studied for their efficiency as a microbial support for biomethanation process were packed to give a working wet density of 150-250 g/L depending upon the support. The sketch of DFFBR is shown in Fig 3.7. Each of these DFFBR was connected to 4L PVC gas storage vessel. Gas accumulation in these was measured by downward displacement of water shown in the figure. After measuring the water level, it was restored to a liquid level of 0 by extracting/sucking out the gas within using suction pump on a daily/twice daily basis.
Fig 3.6. Sketch of laboratory scale DFFBR
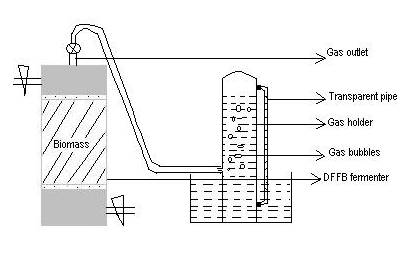
Fig 3.7. Sketch of DFFBR showing gas measured by downward displacement of water.
![]()
![]() 3.3.2. Materials used as biomass support
3.3.2. Materials used as biomass support
Two types of biomass and one synthetic support were studied for their ability in immobilizing the methanogens as biofilm on themselves namely, bagasse, bagasse + biomass (1:1) and reticulated PVC (Fujino spirals).
Support materials used for the study purpose were collected from the following locations, bagasse sugarcane juice expellers, reticulated PVC commercial brand Fujino spirals, and bagasse + biomass - sugarcane juice expellers + spent feedstock from the pilot scale PFBR.
In previous studies it was shown that green leaf biomass (Chanakya et al ., 1992,1998 ) and straw (Andersson and Bjornsson, 2002) provided good colonization of methanogens. However, these biomass supports had half-life of 120d. Bagasse and bagasse + biomass were used in this study with a view that these materials will have longer operational life compared to leafy biomass alone used as support.
The reactors packed with the above mentioned materials were initially filled with digester liquid extracted from a SSB digester. This setup was allowed to stand for 15 days period to facilitate the growth of bacterial film on the packing materials. This also ensured that the residual gas from these bed materials fell to low levels before they were fed synthetic wastewater.
This typical liquid waste (synthetic wastewater) bearing known quantities of suspended and dissolved solids was prepared by boiling rice flour with 100-200ml of water. This was cooled and diluted further with digester liquid, and fed into the reactor. In order to study the efficiency of performance of the bed material, COD conversion rates of that typical were monitored. These reactors were operated at room temperature with a residence time (HRT) of 24 hours for the liquid waste. Feed rates in increasing steps were adopted to study the maximum conversion sustainable in this reactor. When reactors showed low pH or odour of VFA was detected, these reactors were then operated at 50% recycle to ensure the bacterial and nutrient sufficiency. The influent and effluent COD was determined daily to measure the COD degradation in the feed. A peristaltic pump was used for the feeding.
3.4 Physico-chemical analyses
The pH of digester liquid, influent and effluent, temperature and COD of the influent and effluent, gas production volume was monitored daily. Composition of gas collected was carried out to determine the methane content of biogas once in 15 days. In addition to this, TS and VS of synthetic liquid waste were determined. The TS/VS lost in each layer of the SSB fermenter and efficiencies of VS conversion to gas was also monitored at the end of study. These parameters were determined in accordance with APHA (1975).
Total solids denote organic as well as inorganic matter in the feedstock. TS were measured according to APHA (1975). Between 15-20g of fresh feedstock was weighed (W2) in an empty crucible (W1) and dried in an oven maintained at 90 ° C for 24h (W3). Per cent TS was calculated as:
% TS = (W3-W1/W2-W1 ) 100
Volatile solids represent organic matter of the feedstock (excluding the inorganic salts, ash). This was measured in accordance with APHA (1975). 2-3g of oven dried sample was weighed (B) in an empty crucible (A) and heated to 550 ° C for 1hour in the muffle furnace to constant weight (C). Per cent VS was calculated as:
% VS =(B-C /B-A) 100
c. Chemical oxygen demand (COD)
COD was estimated by standard method outlined in APHA (1975). A known quantity of sample was taken in the conical flask. 10ml of potassium dichromate (0.25N) was pipetted out into the conical flask. 20ml of sulphuric acid was measured and added to the conical flask rapidly. This mixture was kept undisturbed for half an hour for digestion. After half an hour, 4-5 drops of ferroin indicator were added and it was titrated against ferrous ammonium sulfate solution (0.25N). The change in the colour from blue green to wine red was the end point. COD of the sample was calculated as,
COD (mg/L) = (B-A) X 1000 X 8 / C
Whereas,
B = Volume of the titrant used against blank.
A = Volume of the titrant used against sample.
C = Volume of the sample taken.
3.5 Indicators of efficiency
The performance efficiency of the reactor and conversion efficiency of feedstock is estimated from the following indicators:
Initial TS/VS of the feedstock was determined before feeding in to the reactor. After destructive sampling, the final TS/VS was determined. The difference between the initial (mass of TS/VS fed) and final TS/VS (residual TS/VS in the digested feedstock) gave the quantity of TS/VS lost. i.e. degradation is calculated as,
TS/VS lost = Initial TS/VS-final TS/VS.
The mass of TS/VS lost was determined after destructive sampling as mentioned above. It was presented as litres of biogas produced per gram TS/VS lost. This gave an index of process efficiency.
c. Expected gas production level from TS and VS lost
A mass balance approach was used to estimate the theoretical gas yield from the TS/VS lost. The mass of VS lost (cumulative) was assumed to be completely converted to biogas. The biogas equivalent of the VS lost was compensated to local conditions of temperature, pressure, and 4%water vapor to determine the theoretical gas production volume. The difference between the observed and the theoretical gave the TS/VS lost to microbial biomass, process inefficiency (such as, conversion proceed till the formation of VFA not further to gas) and physical leakage.