Chapter 4: Results and Discussion
Chapter 4: Results and Discussion |
The results obtained from the SSB fermentation of various feedstocks, the biogas potential (BMP assay) of the 11 feedstocks and the potential of two digested USW feedstocks for use as methanogen support are reported in this chapter. They are placed in three sections in the same order as above.
4.1. Fermentation pattern of feedstocks in SSB fermentors
Results in this section are grouped into dry and fresh feedstocks for convenience of comparison and discussion. The results and their interpretation for the 11 feedstocks are limited to a fed batch strategy of operation. These results of run 1 depict a pattern relevant to a start-up situation during the first 10 weeks of operation and digesters are at best expected to reach only a pseudo-steady state. The results of run 1 have two component operation parameters and conversion parameters. The results of run 2 however are expected to depict steady state operation with a chosen few feedstocks.
4.1.1. Feed rate
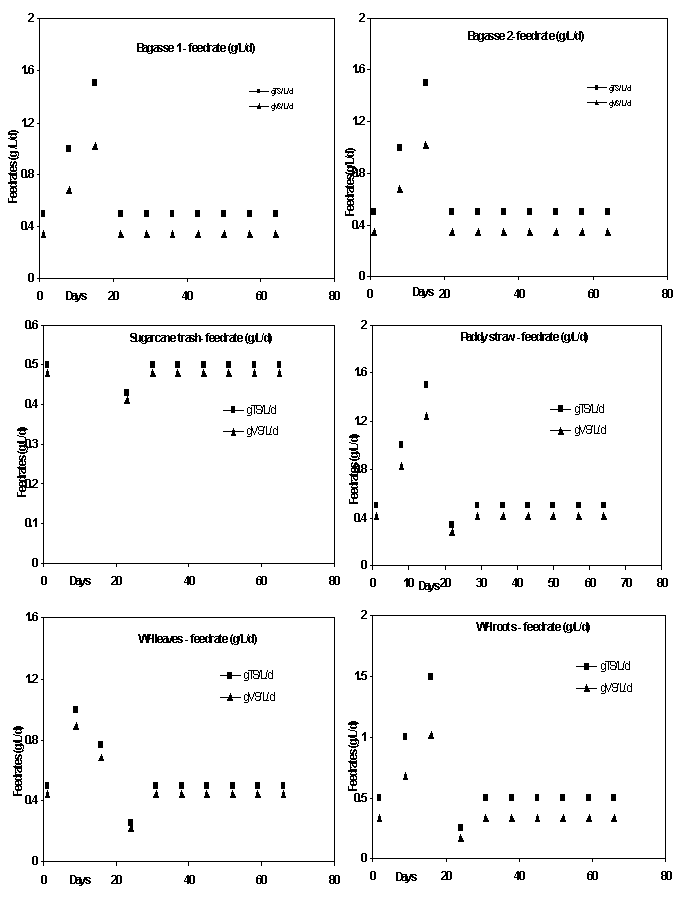
Feed rate for each feedstock was determined by considering the bulk density of the feedstock. Hence it differs for each feedstock. The ideal feed rates for dry and fresh feedstocks are between 1 and 2gTS/L/d. These feed rates were chosen based on past experience to give a daily biogas output between 0.25-0.55m 3 /m 3 /d (Chanakya et al ., 1999). A gradual increase in the feed rate was adopted in the initial period to reach 1g (Fig 4.1) and 2g TS/L/d (Fig 4.2) for dry and fresh feedstocks respectively.
Under pseudo steady state operation with dry feedstocks a maximum of 0.5kg TS/m 3 /d feed rate could only be possible. Higher feed rates, especially with feedstock like bagasse, did not result in adequate compaction. Feed rates in all the dry feedstocks could be maintained at 0.5kg TS/m 3 /d. This appears to be a limiting factor under laboratory conditions.
The natural compaction rates during initial decomposition of fruit wastes and paper mulberry leaf litter permitted achieving a steady state feed rates of 2.0kg TS/m 3 /d while fresh water hyacinth whole plant permitted only a 1kg TS/m 3 /d feed rate. Fresh water hyacinth roots as well as shoots permitted a feed rate of 0.5kg TS/m 3 /d under fermentation conditions adopted.
Photo copying paper among the dry feedstock and fruit wastes among the fresh feedstock showed adequate levels of compaction. The feed rate could be increased to 1.5gTS/L/d for photo copying paper. Chanakya et al., (1998, 1999,1993) reported good gas yield by employing this kind of feed rate.
Fig 4.1. Feed rates achieved for dry feedstocks
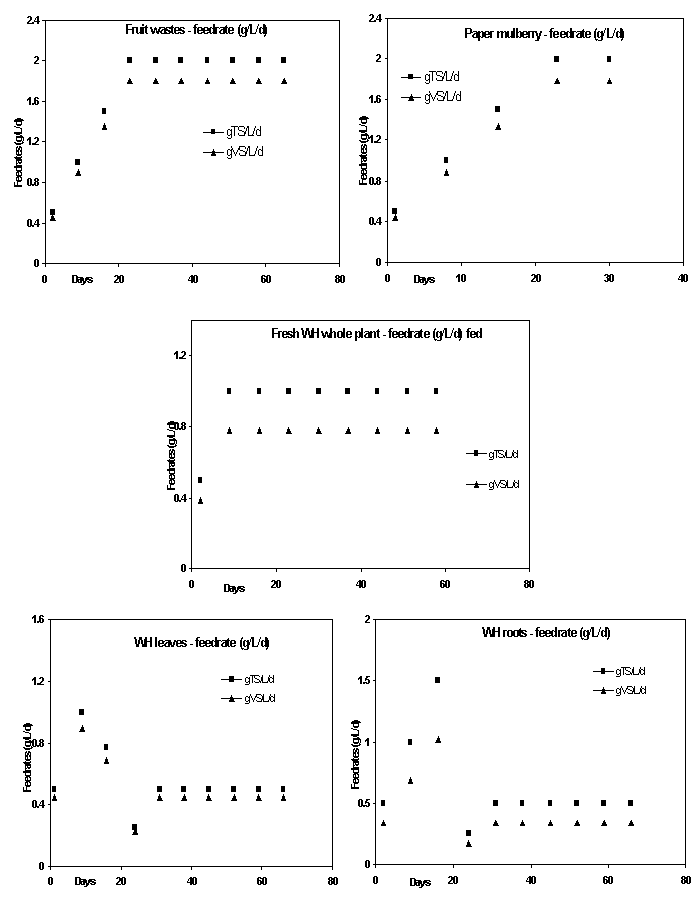
Fig 4.2. Feed rates achieved for fresh feedstocks in run 1.
4.1.2. Gas production
Among dry feedstocks, the daily biogas production ranged between 0.5 and 1.5L/d representing low conversion efficiencies. Table 4.1 shows conversion as a function of TS fed and corresponding gas production rates. Bagasse (2 replicates) and cane trash (1 replicate) showed moderate conversion at 0.31, 0.42 and 0.29 l/g TS fed respectively. Paddy straw, dry water hyacinth and photocopier paper showed very low gas production. Much higher gas production levels have been reported for these feedstocks under similar conditions (Chanakya et al , 1993,1992,1999; Zhang et al ., 1999; Gunaseelan, 1997; Andersson and Bjornsson, 2002).
Bagasse feedstock took 40d to reach steady state of 1L. Similarly other dry feedstock took 20, 13 and 32d to reach steady state gas production for paddy straw, cane trash and copier paper respectively.
Fresh feedstocks such as paper mulberry and fruit wastes decomposed rapidly resulting in an average gas production of >3L biogas /d at pseudo-steady state. Yet the TS to gas conversion efficiency (Table 4.1) are low for these feedstocks. Viturtia, (1995) reported 0.5L methane yield by using the two-phase digestion of fruit wastes mixtures (0.42L methane yield for 16dHRT- Viswanath et al ., (1992); 0.41L methane yield for 32d HRT with 75%VS lost-Lane, 1984). In relation to this, the gas yields achieved in this study is low. For other feedstocks reports in literature show 1L, 0.6L, 0.25L/d for fresh water hyacinth whole plant, water hyacinth leaves and water hyacinth roots respectively (Fig 4.4). Once again the TS to gas conversion efficiency was low.
Feedstock |
Total gas production (L) |
Total VS fed (g) |
Theoretical gas yield (L) |
Observed gas yield L/gVS fed |
Bagasse 1 |
59.5 |
186 |
163 |
0.31 |
Bagasse 2 |
79.9 |
186 |
163 |
0.42 |
Cane trash |
64.8 |
259 |
227 |
0.25 |
Paddy straw |
42.8 |
221 |
194 |
0.19 |
Dry water hyacinth |
16.1 |
221 |
194 |
0.07 |
Copier paper |
44.8 |
488 |
429 |
0.09 |
Fruit wastes |
159 |
643 |
565 |
0.24 |
Paper mulberry |
75.1 |
262 |
230 |
0.28 |
Fresh WH whole plant |
66.67 |
278 |
244 |
0.23 |
Fresh WH leaves |
45.1 |
234 |
205 |
0.19 |
Fresh WH roots |
16.8 |
179 |
157 |
0.09 |

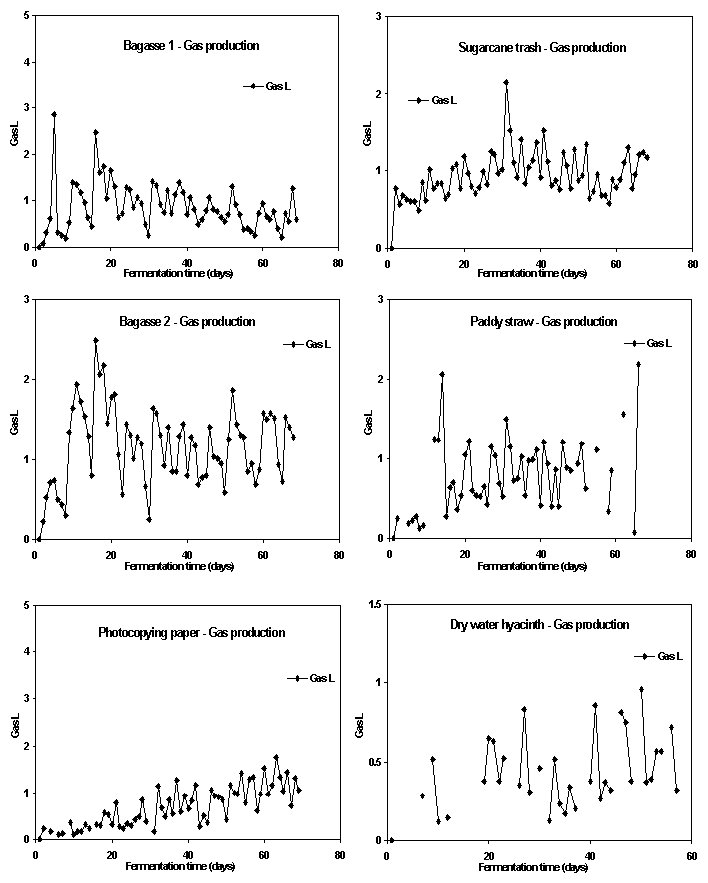
Fig 4.3. Daily biogas production rates from dry feedstocks.
Fig 4.4. Daily biogas production rates from fresh feedstocks.
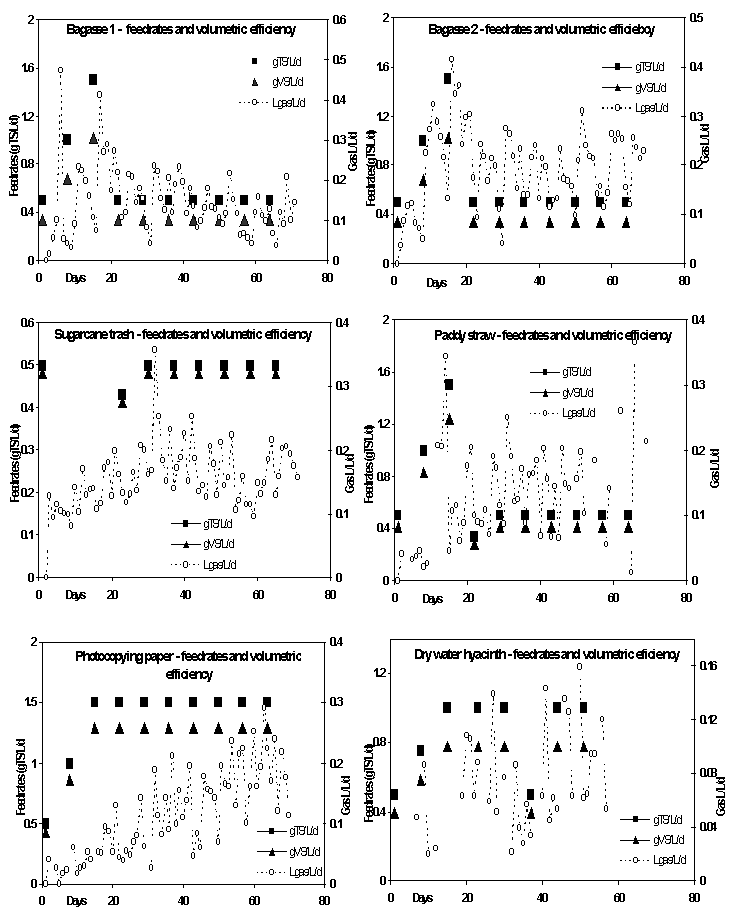
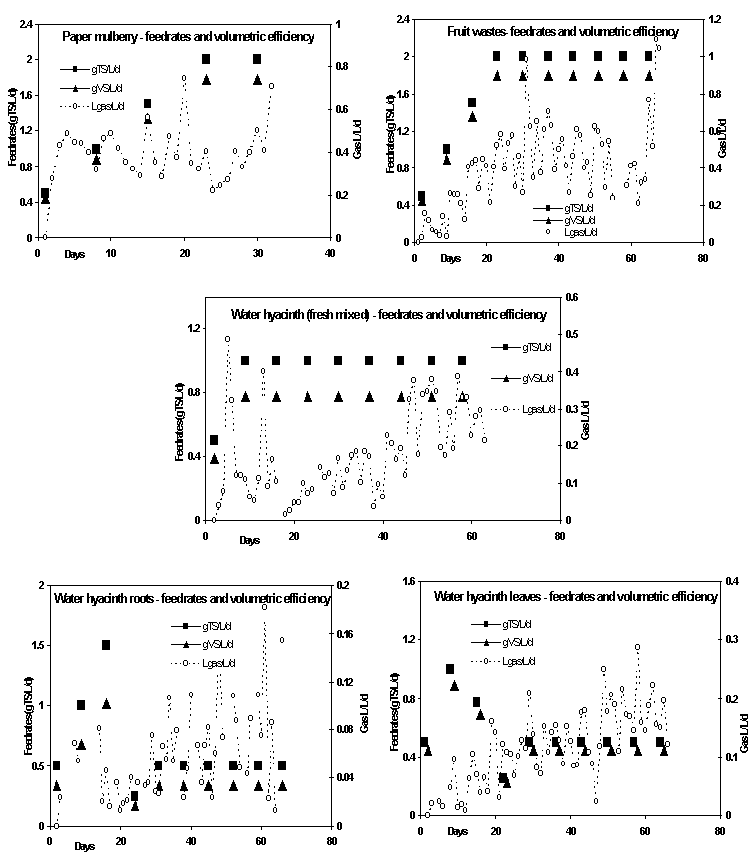
4.1.3. Feed rate versus volumetric efficiency
Among the dry substrates tried, bagasse, sugarcane trash and photocopier paper achieved volumetric efficiencies between 0.15 and 0.2 m 3 /m 3 /d at feed rates of 0.5, 0.5 and 1.5kg TS/m 3 /d (Fig 4.5). As stated earlier and shown in Table 4.1 bagasse and sugarcane trash have moderate TS to gas conversion values. Better performance with these two feedstocks, measured as higher volumetric gas production levels reaching 0.5 m 3 /m 3 /d will be possible only when steps to increase current feed rates >0.5 kg/m 3 /d can be achieved. Other dry feedstock showed an average volumetric efficiency of 0.1 and 0.05 m 3 /m 3 /d for, paddy straw and dry water hyacinth respectively (Fig 4.5).
In the case of fresh feedstock, fruit wastes and paper mulberry showed a desirable level of performance in terms of volumetric efficiency (0.5 m 3 /m 3 /d). This result is comparable with previous reports done on this feedstock. Chanakya et al. , (1999) showed the volumetric efficiency of 0.5 m 3 /m 3 /d at a much lower feed rate. In the case of fruit waste and paper mulberry from Fig 4.6 and Table 4.1 it may be deduced that the feed to gas conversion is low and there is potential to obtain higher gas production levels. Other substrates studied gave 0.15, 0.17 and 0.04 m 3 /m 3 /d for water hyacinth whole plant, water hyacinth only leaves and water hyacinth only roots respectively (Fig 4.6).
Fig 4.5. Feed rate Vs volumetric efficiency in dry feedstock

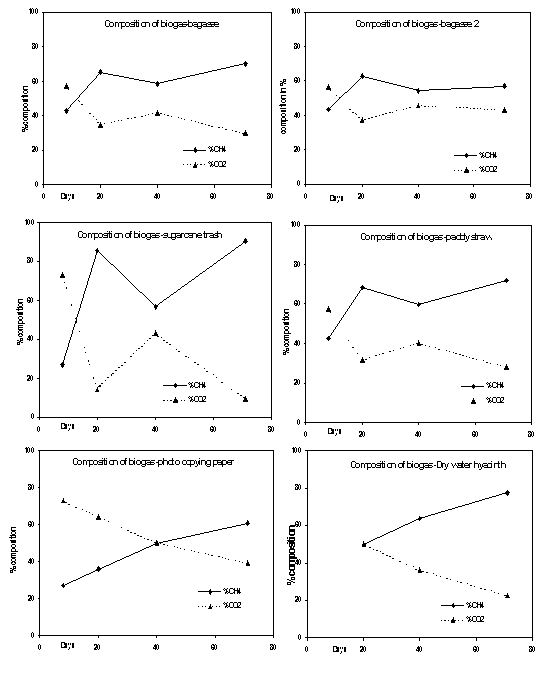
4.1.4. Gas composition
Simple technique was adopted for feeding the fermentor i.e. by opening the feed hatch and replacing the pre-weighed feedstock in to it. This opening results in the concomitant introduction of air in to the fermentor thus diluting the biogas, without seriously affecting overall gas production rates (Chanakya et al ., 1993). The composition of gas measured from the start up to end period showed a methane content >50% in most of the cases (Fig 4.7 and 4.8). This indicates that the rate of acidogenesis and methanogenesis are well balanced (Chanakya et al ., 1998). Right from the beginning cane trash, paddy straw, water hyacinth showed good methane content of above 60%. This data suggests that firstly in all the reactors the methanogenesis remained healthy. Second, the modification in the gas outlet position, from the top of the reactor to the methanogenic zone, has functioned well even in a small laboratory scale reactor. The gas composition was however measured at wide intervals and thus cannot adequately diagnose day-to-day changes in digester health. This frequency needs to be increased in future studies.
Fig 4.7. Composition of biogas in dry feedstock.
Fig 4.8. Composition of biogas in fresh feedstock.
4.1.5. Characteristics of the decomposing biomass bed in SSB reactors
4.1.5.1. Changes in total solids (TS) before and after fermentation
Difference in the initial TS fed and final TS (recovered) is presented in the Fig 4.9 and 4.10 for dry and fresh feedstock. Changes in the total solids fed were examined by comparing the TS of the feedstock before being fed in to the reactor and TS of residual mass removed after 70d fermentation. In all dry feedstocks it may be seen that there is some degree of an early loss in TS fed after which the rate of TS lost is slow. Only the older layers have exhibited large TS losses. This overall picture for dry feedstocks suggests that much of the gas recovered is from decomposition in (older and) lower layers that are expected to be in methanogenesis. The reasons for such a situation is not clear from available data and reasons for this need to be determined if the process has to be improved. Among the dry feedstock, bagasse, paddy straw, cane trash occupied first three places in reflecting the changes in terms of mass (TS) lost.
The case of fresh feedstock was entirely different, fruit waste, paper mulberry and water hyacinth whole showed large differences between mass fed and recovered may considered to be converted (to gas). Water hyacinth roots and leaves showed lower TS losses. This suggests that the process of TS primary conversion has not been adequate in a few cases and needs to be improved in future experiments. Yet, under similar conditions some of the earlier studies exhibited reasonably large conversions. The above results suggest that change in the mass of TS fed occur to a larger extent in case of fresh feedstock rather than dry feedstock. It is suggestive of fresh feedstocks being more prone to the action of hydrolysis and resultant change.
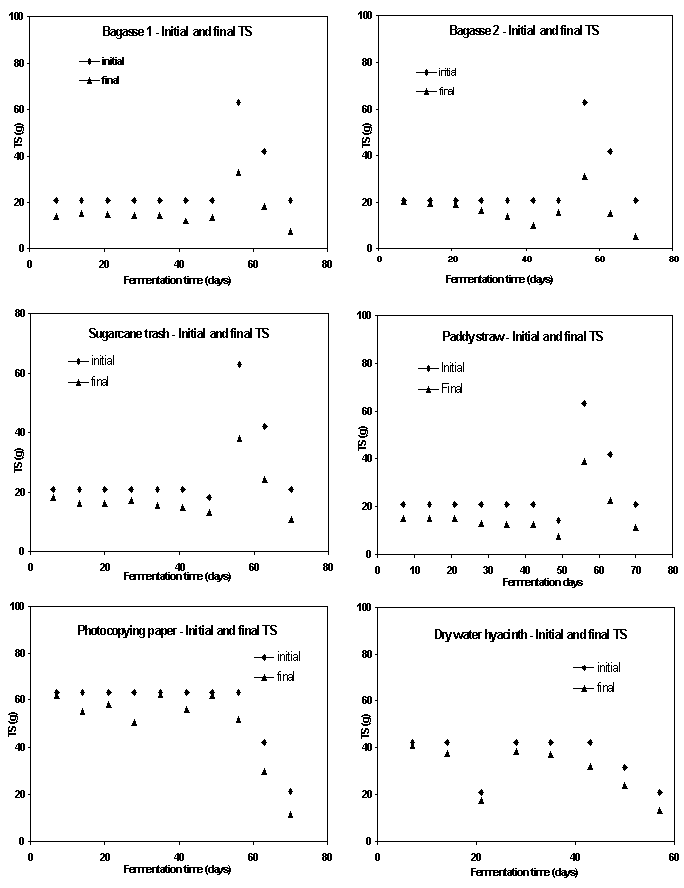
Fig 4.9. Changes in TS before and after fermentation in dry feedstocks.
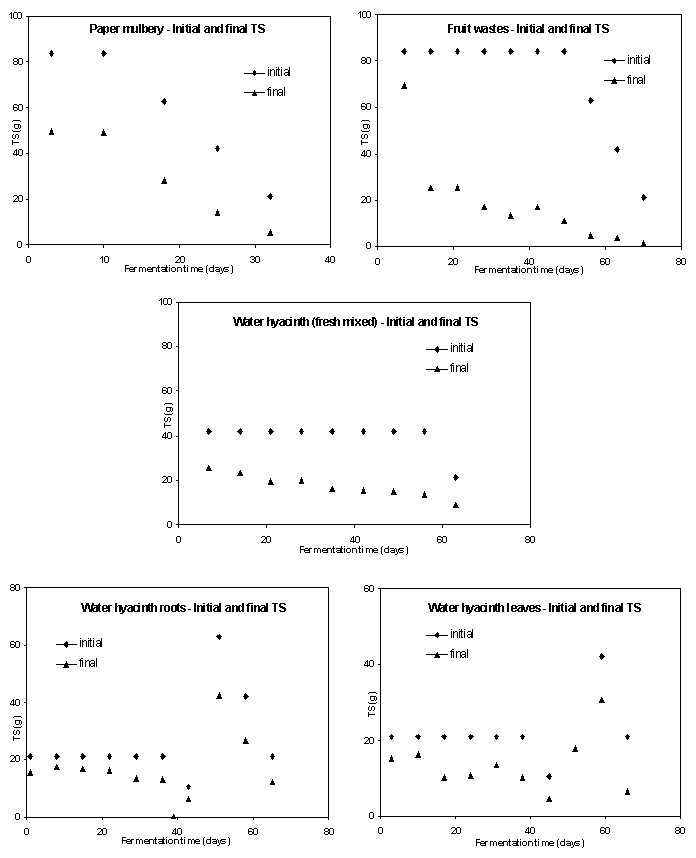
Fig 4.10. Changes in TS before and after fermentation in fresh feedstocks.
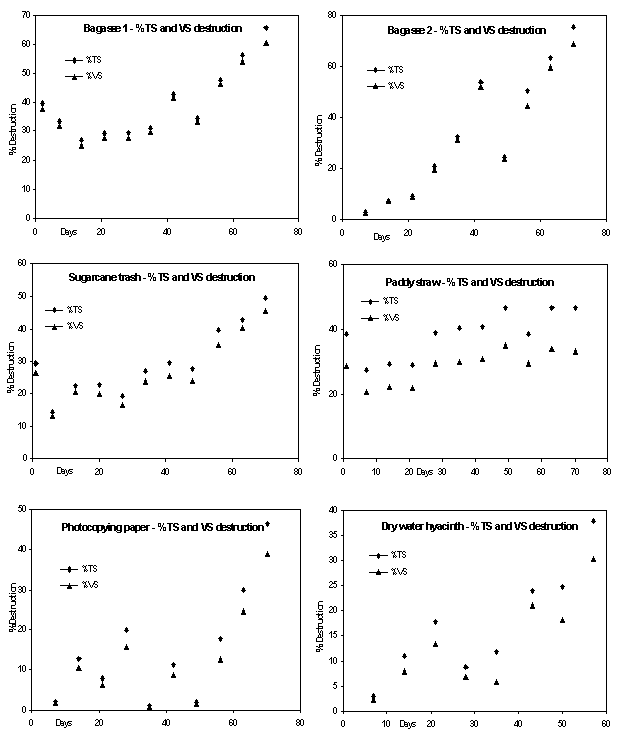
4.1.5.2. Efficiency of conversion
TS and VS destruction pattern of dry and fresh feedstock is presented in the Fig 4.11 and 4.12 respectively. It was seen that the dry feedstock decomposed slowly resulting in 25-40% destruction in VS in 40d, while fresh feedstock decomposed rapidly resulting in >50% destruction in most cases. Among the dry feedstock studied, bagasse and trash decomposed rapidly underwent a maximum VS destruction of 70% and 45% in 70d. On the other hand, fruit wastes among the fresh substrates tried, underwent an 80% VS loss. Others showed 60% (for water hyacinth whole plant and leaves) and 35% for roots alone in 60-70 days. Paper mulberry showed 50% loss in 32 days. Among the above changes in TS were supported by corresponding VS destruction for a period of 70d. From the data on the loss of mass from the biomass bed, it is clear that even though appreciable TS loss has been determined this has not been converted to gas production and related efficiencies. It is possible that the VFAs leaching down has occurred rapidly and failed to be converted to biogas in the methanogenic zone and has come to the reservoir under composed. Further investigation is needed to confirm this possibility.
Fig 4.11. TS and VS destruction of dry feedstock.
Fig 4.12. TS and VS destruction of fresh feedstock.
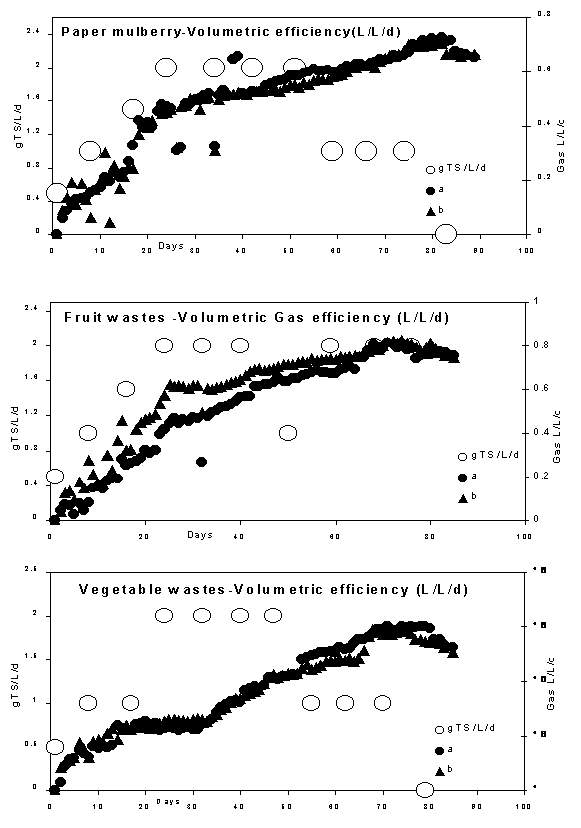
4.1.6. Fermentation of selected feedstocks (of USW) under SSB conditions
Feedstocks that gave the volumetric efficiency between 0.5 and 1.0L on an occasional basis during run 1 were studied once again in duplicates during run 2. This was meant to confirm an efficient gas potential found in run 1. Firstly the high feed rate of 2kg TS/m 3 /d could not be sustained for paper mulberry and vegetable wastes. The compaction rates were inadequate to support such high feed rates. Only fruit wastes permitted such high feed rates (Fig 4.13). Volumetric efficiencies >0.5L was achieved for all feedstocks. It was observed that maximum of 4.8L/d for fruit wastes, 4.5L for paper mulberry and 3.6L/d for vegetable wastes were observed. A gradual steady state was observed in all the feedstock studied for 80d fermentation period. Composition of biogas checked once in 15 days also showed the methane content of above50% is the suggestive of healthy digestion process.
4.2. Biogas production potential
The sequence and method of inferences obtained from this modified BMP assay is outlined under methods. The same sequence of inferences is made on each of these BMP results.
4.2.1. Bagasse
Sugarcane bagasse is now often found in urban waste, arising largely from sugarcane juice expellers on roadside as well as dry bagasse being used as a filler and packaging material, domestic mushroom cultivation, seasonal domestic consumption, etc. Sugarcane bagasse has been found in a few bins near the institute. Usually it is dry, found in 1.8m long pieces and has a low bulk density. It has a fraction of un-expelled sugar. All these create technology challenges for biogas production from these feedstocks.
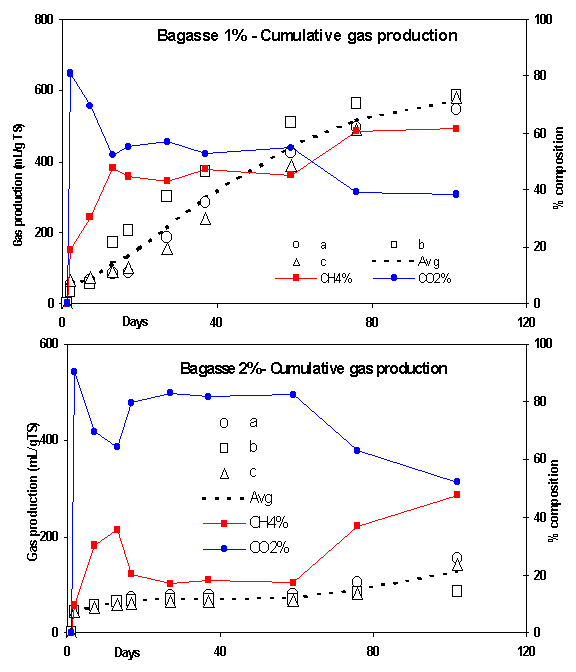
The BMP pattern of this feedstock has been presented in the Fig 4.14. In the 1% vials, there has been around 50mL of gas production most of which in the initial phase was CO 2. Although, it showed initial spurt of gas production suggesting a large buildup of VFA, methane production and methane composition in the gas did not seem to be inhibited from around 10 th day of start. Whereas in 2% feedstock, significant inhibition of methane has been detected. The gas production appears to be in the steady state range from the very beginning of fermentation reaching up to a period of 80 days. Only after 80 th day, some extent of leveling off seems to have occurred in 1or 2 replicates. Bagasse did not exhibit a clear cut-leveling phase even up to a study period of approximately 100 days. The difference in gas production levels between 1 and 2% is significant. While the 1% vials did not show a significant inhibition of methanogenesis, the 2% TS vials showed a very large inhibition of methane and methanogenesis. In this case methane content is generally been lower than 40%. Some degree of recovery was found towards the end of the BMP period. The ultimate BMP from this feedstock is quite high and reaching up to 571 m 3 /kg TS or methane 300 m 3 /kg TS fed. The extent of methane and biogas production found in the study closely resembles the levels reported in the literature (Chanakya et al ., 1999).
Fig 4.14. Cumulative gas production pattern of bagasse.
4.2.2. Paddy straw
Paddy straw is used as a packaging material and it is also found to occur in significant proportion in some parts of USW especially fruit packing. It has been increasingly found in and around fruit stalls. Paddy straw is a bulky material with a low packing density (Chanakya et al ., 1998) has large particle size and has a medium level of ligno-cellulosics (Zhang and Zhang, 1999). There is an initial rapid gas production of 100mL (1%). In spite of this high gas production, the methane concentration had remained high and always above 50%. This suggests that in spite of initial spurt in gas production and possibly a high VFA production, methane production is not inhibited. From a period of 5d, to fermentation period between 40 and 60d, the gas production is in steady state for 1% as well as for 2% TS. The methane content in the gas reflecting the health of methanogenesis has been high corresponding to balanced methanogenesis during steady state period of gas production. The gas production begins to level off after a 60d fermentation period in 1 and 2% ranges. There is very little difference in the pattern of 1 and 2% except in the magnitude of gas produced. No inhibition has detected even in 2%TS suggesting that this feedstock is unlikely to suffer from an initial VFA flux and resultant methanogenic inhibition under normal conditions. The ultimate BMP is 0.63m 3 /kg TS of biogas corresponding to methane of 0.3 m 3 /kg TS fed (Fig 4.15). High biogas production potential of paddy straw has been previously reported. Chanakya et al, 1999 have used paddy straw in solid-state fermentation and reported gas production levels of above 400mL/gTS fed. Similarly results from other efforts also shown gas production levels achieved above 400 mL gas (Zhang, 1999; Andersson and Bjornsson, 2002). In addition to this, paddy straw is known to contain silica up to 11% (13.1% Zhang and Zhang, 1999; Hills and Roberts, 1981) in its matrix, as a result of this, it poses a challenge to biogas production. While high biogas could be achieved under BMP conditions it could not be achieved under SSB conditions in this study.
4.2.3. Sugarcane trash
Sugarcane trash is almost always accompanied by the occurrence of bagasse. The leaves are long, fibrous and like bagasse has very low C/N ratio. The large size, low C/N ratio and dry state and accompanied with low bulk density pose a challenge to biogas production in conventional plants. At 1% TS cane trash showed a small spurt of gas production, indicative of rapid VFA flux (Fig 4.16). Yet the methane production and methane concentration seemed uninhibited both at 1% and 2% concentrations. Steady state gas production was noticed between 5d continuing up to 80d. During the period of steady state, methane concentration remained significantly high showing that no inhibition of methanogenesis occurred during this stage of decomposition. Leveling off may be seen after a period of 80 days. Thus under batch conditions, a retention time between 40 and 80d may be chosen depending on economics. There was no inhibition of methanogenesis found between 1 and 2% suggesting that with increased solids concentration in the reactor, methanogenesis is unlikely to be affected by VFA intermediates. The ultimate methane potential is high and reaching up to 0.59 m 3 /kg TS and approximately 0.4 m 3 /kg TS at 2% concentration.
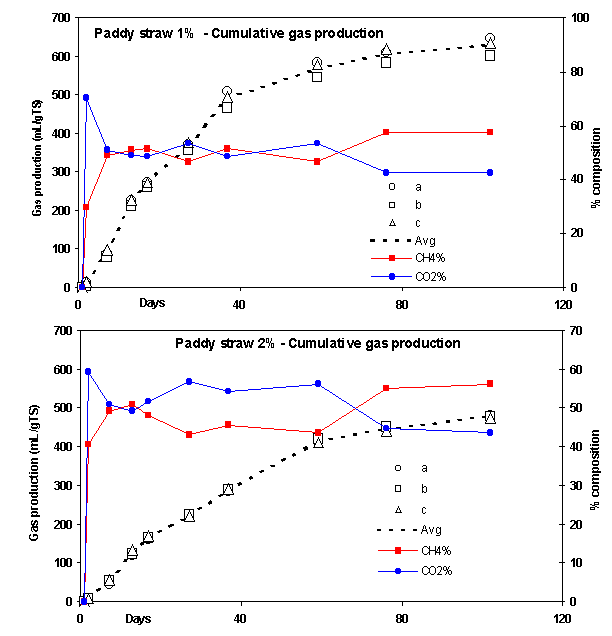
Fig 4.15. Cumulative gas production pattern of paddy straw.
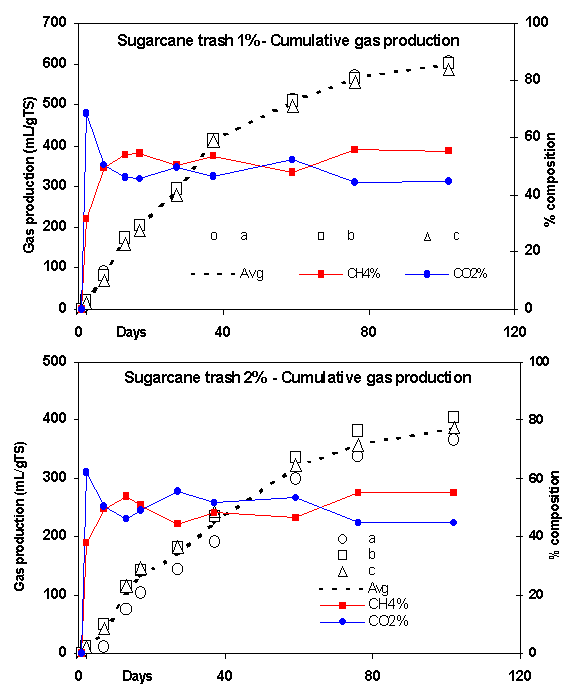
Fig 4.16. Cumulative gas production pattern of sugarcane trash.
4.2.4. Dry water hyacinth
Water hyacinth infests urban water bodies and is frequently harvested. Such harvested material end up in USW. Water hyacinth is also used as phyto-remediation (Singhal and Rai, 2003) and is therefore likely to find its way in to a USW from small-scale treatment plants. The BMP assay data for this feedstock was presented in the Fig 4.17. The 1% TS BMP vials showed the gas production levels up to 100mL in the first 5d suggesting the presence of a large component of easily decomposable material with potential for VFA induced methanogenic inhibition. Yet, as seen from Fig 4.17, methane content recorded was high reaching up to 60% from the early stages of decomposition. Steady state gas production phase extended up to a period of 40d in 1% and 2% TS. The leveling off phase was not very characteristic with this feedstock and gas production continued at lower rates up to the end of the study period. In the steady state period of gas production no methanogenic inhibition was noticed. Very little difference was found between 1 and 2% in terms of methane concentration and this suggests that the digesters operating at higher TS concentrations are unlikely to be inhibited by VFA induced inhibition. The ultimate BMP was found to be in the range of 0.49 m 3 /kg TS / fed and around 0.3 m 3 /kg TS CH 4 . Previous studies reported that the ultimate methane yield from water hyacinth, based on ABP assay was 0.34m 3 kg -1 VS added (Chynoweth et al ., 1982; Viswanath et al ., 1992; Gunaseelan., 1997; Gopalakrishna, 1989).
4.2.5. Water hyacinth leaves
Water hyacinth leaves and roots have separate applications and it is necessary to determine the BMP of leaves and roots separately. The BMP of water hyacinth leaves is presented in Fig 4.18. There is a rapid gas production initially totaling 15% of the overall gas production. Such a rapid gas production is the suggestive of VFA flux in the early stages of decomposition. From the high methane content of gas throughout the study period both in 1 and 2% TS, it suggests that VFA induced methanogenic inhibition has not occurred. A steady state gas production occurred between 5 and 59 days of fermentation during which there is no indication of VFA induced methanogenic inhibition. The gas production leveled off after 60d both in 1 and 2% TS. There is no secondary rise in gas production after leveling off. There is very little difference in gas composition between 1 and 2% TS although there is a significant reduction in gas yield. The BMP pattern does not exhibit any VFA induced methanogenic inhibition and suggests that the biogas plants can be operated at higher TS concentrations. The ultimate biogas yield is very high of about 0.632 m 3 /kg TS and about 0.350 m 3 CH 4 /kg TS CH 4 /gTS. Such high BMP has not been reported before. Although gas yields above 500mL/gTS has been reported by various studies previously (Chynoweth et al ., 1982 - 0.34m 3 methane/kg VS). It also has been reported that that methane yields were higher in shoots than roots (Shiralipour et al ., 1984). In this study water hyacinth leaves failed to produce high biogas production in SSB reactors. It is believed that the recycle of digester liquid was not uniform and was the cause of low gas production in most water hyacinth based reactors.
Fig 4.17. Cumulative gas production pattern of dry water hyacinth.
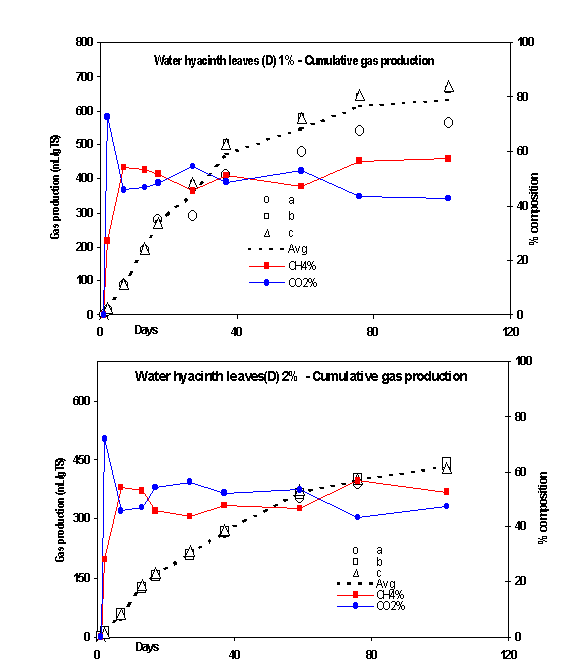
Fig 4.18. Cumulative gas production pattern of dry water hyacinth leaves
4.2.6. Dry water hyacinth roots
There is an initial rapid gas production phase is the suggestive of VFA flux in the early stages of decomposition. From the high methane content of gas throughout the study period both in 1 and 2% concentration, it suggests that VFA induced methanogenic inhibition is unlikely at concentrations studied here (Fig 4.19). A steady state gas production occurs between 5 and 37th days of fermentation during which there is no indication of VFA induced methanogenic inhibition. The gas production began to level off after 40d both in 1 and 2% concentrations. There is no delayed rise in gas production after gas production levels have leveled off. There is very little difference in gas composition 1 and 2% concentration of water hyacinth leaves yet there is significant reduction in gas yield. The pattern does not exhibit any VFA induced methanogenic inhibition and suggests that the biogas plants can be operated at higher TS concentrations without the adverse consequences. The ultimate biogas yield is very high of about 0.39 m 3 /kg TS and about 0.25 m 3 CH 4 /kg TS. Such high yields could not be obtained under SSB conditions (Table 4.1). Previous studies had shown better gas yields than the present study (Cooley et al ., 1978).
4.2.7. Photocopying paper
Photocopying paper has been found to be a significant part of solid waste generated on the campus. In IISc, the component of paper can reach as high 15% by weight (Kumar et al ., 2001). Such paper is often soiled and not suitable for recycling. Photocopying paper poses an interesting challenge primarily because of its low bulk density (<30kg/m 3 ; Kumar et al ., 2001) as well as in the use of several agents for glazing and its impact on biogas production. The result of BMP assay of photocopying paper is presented in the Fig 4.20. A significant level of gas production is found to occur around by about 6 days of fermentation reaching levels of 75mL. However in spite of this large flux the methane concentration has generally be around 50% from the very beginning of BMP assay. Such a pattern suggests that biogas plants can be operated at higher solids content without fear of VFA accumulation or VFA fluxes. A steady state gas production is found to occur only for a short duration lasting approximately 25 days after which biogas production appears to level off. During this period, there has been no significant fall in methane content and suggests that VFA induced inhibition is not a cause for leveling off gas production early. Paper by virtue of its wide C/N ratio is starved of nutrients and it is possible as the early leveling off gas production is due to nutrient deficiency. However, further research is required to confirm this phenomenon. Among a few replicates, a pick up in gas production occurred after 70d reaching a final BMP of 0.6 m 3 /kg TS. An increase in gas production rates at a very late stage is suggestive of an inhibition of a nature not explained by available data. Further research is required. There is a very little difference in gas composition between 1 and 2% TS. The gas pattern is different between 1 and 2% solids. These suggest that the reactors operating on PCP can tolerate high solids concentration without fear of VFA fluxes. The ultimate BMP recorded was not clear and there was the wide variation between replicates reaching between 0.1-0.6 m 3 /kg TS. BMP assay needs to be repeated with appropriate precautions.
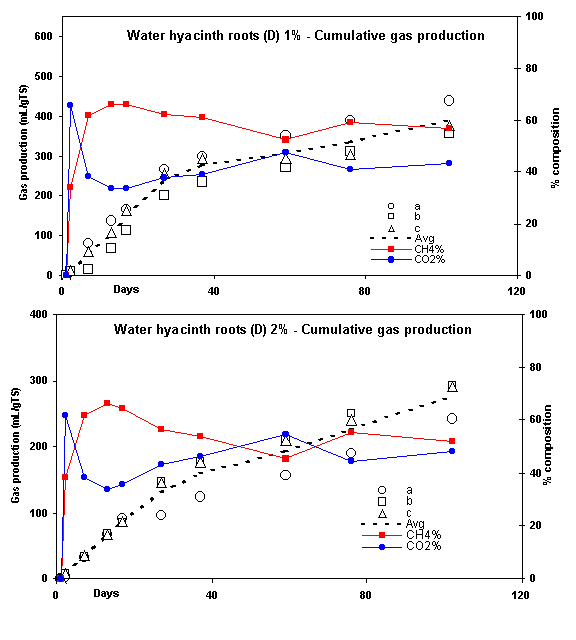
Fig 4.19. Cumulative gas production pattern of dry water hyacinth roots.
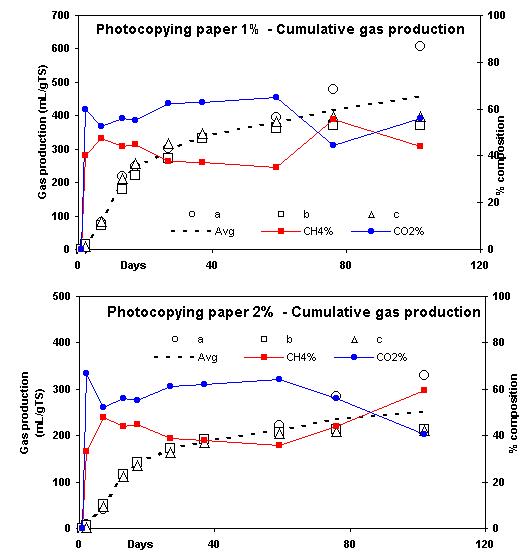
Fig 4.20. Cumulative gas production pattern of photo copying paper.
4.2.8. Banana peel
Banana peel and banana stalks are known to be among the top few components of fruit waste found in USW collected in Bangalore. Banana peel is largely made up of pectic materials, is soft and is expected to be easy to decompose. Yet, because of the presence of simple decomposable material, fruit peels especially banana peel is likely to suffer rapid fluxes of VFA, VFA accumulation and the resultant methanogenic inhibition. The BMP assay is presented in the Fig 4.21. A very rapid rise in gas production and a low methane concentration in 1 and 2% vials are characteristic of VFA induced methanogenic inhibition and confirm above-mentioned expectations. The BMP pattern observed suggests the absence of steady state gas production phase with this feedstock. Low methane concentration is the suggestive of methanogenic inhibition up to a period lasting approximately 60 days. In the absence of the occurrence of gas production, leveling off has been observed between 15 and 60d of BMP assay. However after 60 th day, once again gas production recovered along with rise in methane. A BMP of 0.36 m 3 /kg TS has been recorded. However, as the gas composition is less than 50% methane, it is unlikely that the results of this BMP assay are useful. Further experiments are required to be done at lower TS to ensure that BMP levels are recorded without VFA induced methanogenic inhibition. The 1and 2% samples have shown low methane concentration suggesting that even in 1% TS methanogenic inhibition occurs. The ultimate methane potential cannot be obtained from the available data in the study. In previous work on banana peel (Gunaseelan, 2004; Nand et al ., 1997) has produced very high levels of biogas, which suggests that this banana peel is good feedstock.
4.2.9. Watermelon rinds
Watermelon is a seasonal fruit and is found in USW composition recorded earlier from near fruit shops. Watermelon rinds is a large sized object characterized by high moisture largely of primary cell wall of pectic origin. The large size and high moisture content pose a challenge to biogas production in conventional biogas plants. A large initial spurt in gas production is suggestive of gas production largely in the form of CO 2 both in 1 and 2% is the suggestive of large flux of VFA (Fig 4.22). In addition, a low concentration of methane is suggestive of VFA induced methanogenic inhibition. This is also seen in 2% where methane concentration rarely exceeds 10%. As a result of VFA induced inhibition or a pattern similar to that there is steady state gas production seen after 5 days of BMP. During this period, methane concentration is less than 20% in both the concentrations of TS and is the indicative of VFA induced suppression of methanogenesis. An early occurrence of leveling off gas production is found and permits till a 70d period in 1% and 80d period in 2%TS in micro digesters. After 40d period, as a gradual increase in methane concentration and also a recovery of gas production is seen 0.4 m 3 /kg TS. This late recovery of gas production is characteristic of an inhibited biogas production during the early stages. Both 1 and 2% TS BMP assay have very low methane concentrations where 2% concentration has rarely had methane concentration exceeding 5%. This pattern is the indicative of very large VFA flux and its methanogenic inhibition. From the current BMP assay ultimate biogas and methane potential cannot be determined. Further studies at lower concentration of TS have to be carried out to determine the BMP.
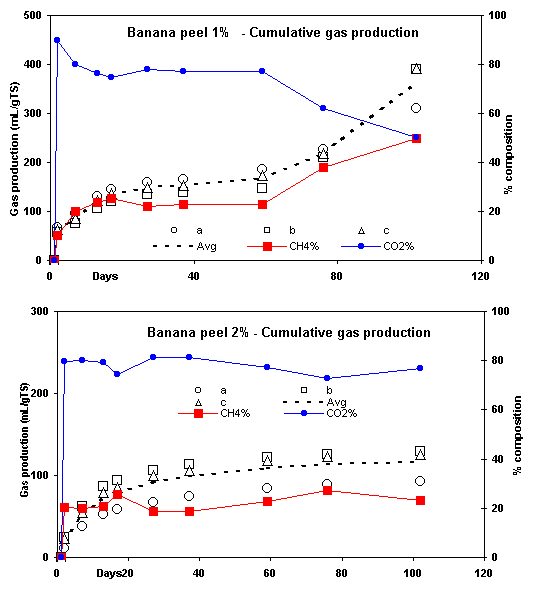
Fig 4.21. Cumulative gas production pattern of banana peel.
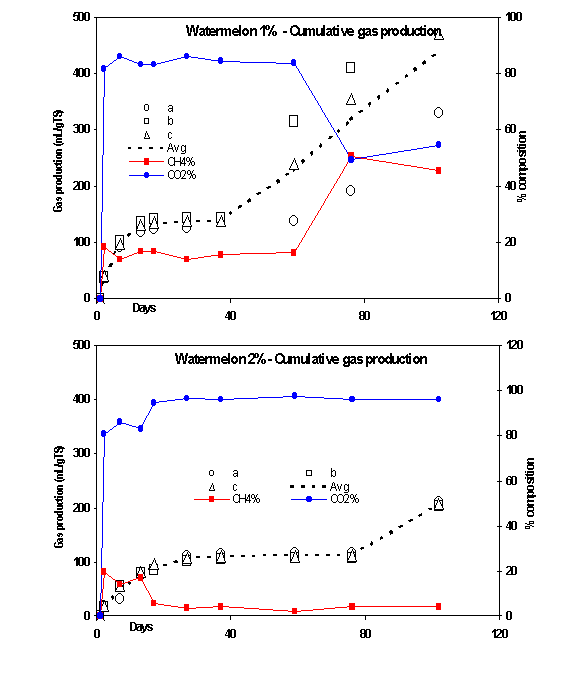
Fig 4.22. Cumulative gas production pattern of watermelon rinds.
4.2.10. Citrus fruits
Citrus fruits peel form a significant proportion of fruit waste component of USW and is dominant in wastes collected from nursing homes and hospitals. Citrus peels either as orange or sweet lime is largely pectic material with significant components of essential oils which have anti-microbial properties. There are reports that citrus peels inhibit biogas production and this form a major challenge to biogas production The BMP assay results for orange peel are presented in Fig 4.23. A rapid gas production pattern is seen and accompanied by a very high evolution of CO2 at concentration in the range of 80%. While methane concentration remains around 20%. Such a pattern is characteristic of methanogenic inhibition. As a consequence of low methane production and high CO2 it is suggestive of VFA accumulation. The BMP assay did not exhibit any steady state gas production phase either in 1 or 2% vials. Slowing down of gas production occurred rapidly and gas production did not recover during the BMP assay period of 100 days. The BMP values recorded are very low at 0.1 m 3 /kg TS and are the indicative of suppressed biogas production process. The level of inhibition is higher at 2%TS. From this data, ultimate BMP cannot be determined. Further studies are required to understand the suppression process. In previous studies, it ahs been found (Chanakya et al., 1997) that up to a small fraction in the form of citrus peel has not affected biogas production in plug flow digesters. Similarly other research findings on citrus peels have shown biogas production is possible below a certain overall concentration of citrus peels in the feedstock.
The case of sweet lime (local name Mosambi) is similar to that of orange peels. The gas production is suppressed and the methane concentration remains around 20% and even lower at 2%TS concentration (Fig 4.24). This pattern is the suggestive of very high level of methanogenic suppression. At lower concentration of sweet lime peel is required to deduce the BMP and is inhibitory in nature at higher concentrations.
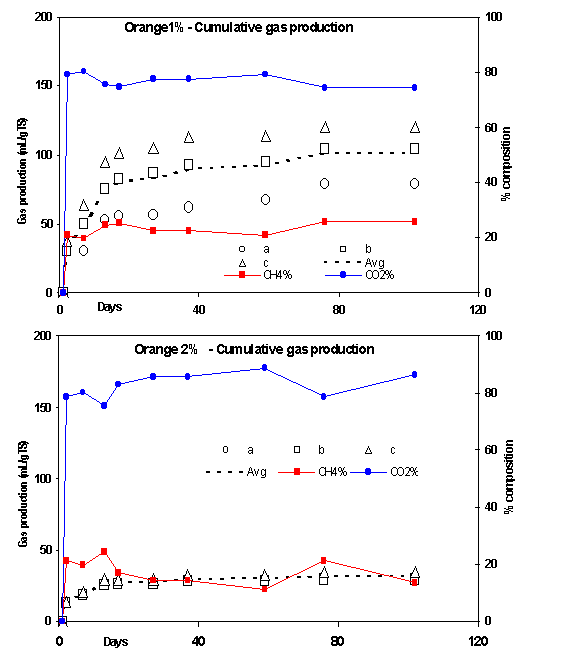
Fig 4.23. Cumulative gas production pattern of orange peel.
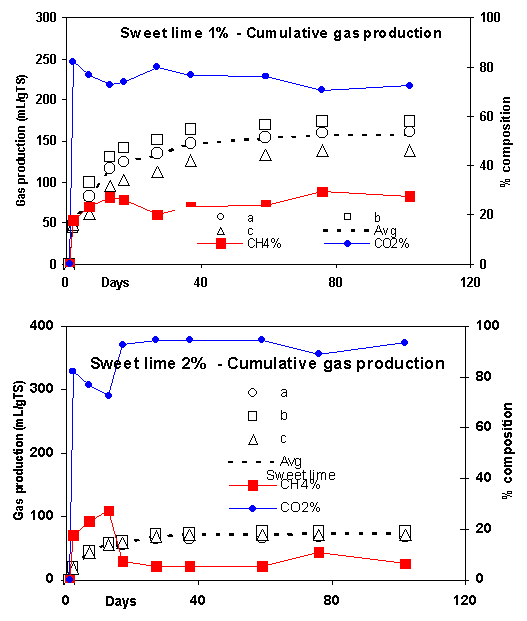
Fig 4.24. Cumulative gas production pattern of mosambi peel.
4.2.11. Mixed fruit wastes with sweet lime (mosambi)
The BMP assay results for mixed fruits with mosambi are presented in Fig 4.25. A rapid gas production pattern is seen and accompanied by a very high evolution of CO2 at concentration in the range of 80%. While methane concentration remains around 20%, this is the characteristic of methanogenic inhibition. A low methane production and high CO2 is the suggestive of VFA accumulation. The BMP assay did not exhibit any steady state gas production phase either in 1 or 2% vials. This was followed up by the leveling off phase lasted till 79th day. A sudden spurt after leveling off phase was detected clearly showed the presence of non-VFA induced inhibitory factors. Recovery of methane production was detected on 59 th day. The BMP values recorded are very low at 204mL/gTS and are the indicative of suppressed biogas production process. The level of inhibition is higher at 2%TS. For this data, ultimate BMP cannot be determined. Further studies are required to understand the suppression process.
4.2.12. Mixed fruit wastes with orange
The BMP assay results for mixed fruits with 25% orange peel in mixture are presented in Fig 4.26. A rapid gas production pattern is seen and accompanied by a very high evolution of CO2 at concentration in the range of 80%. Methane concentration remains around 20% and is characteristic of methanogenic inhibition. A low methane production and high CO2 is the suggestive of possible VFA accumulation. The BMP assay did not exhibit any steady state gas production phase either in 1 or 2% vials. This was followed up by the leveling off phase lasted till 37th day. A sudden spurt after leveling off phase was detected clearly showed the presence of non-VFA induced inhibitory factors. Recovery of gas production in 1-2 replicates confirmed the same. Recovery of methane production was detected on 59 th day. Yet, the BMP values recorded are very low at 336mL/gTS and are the indicative of suppressed biogas production process. The level of inhibition is higher at 2%TS. For this data, ultimate BMP cannot be determined. Further studies are required to understand the suppression process.
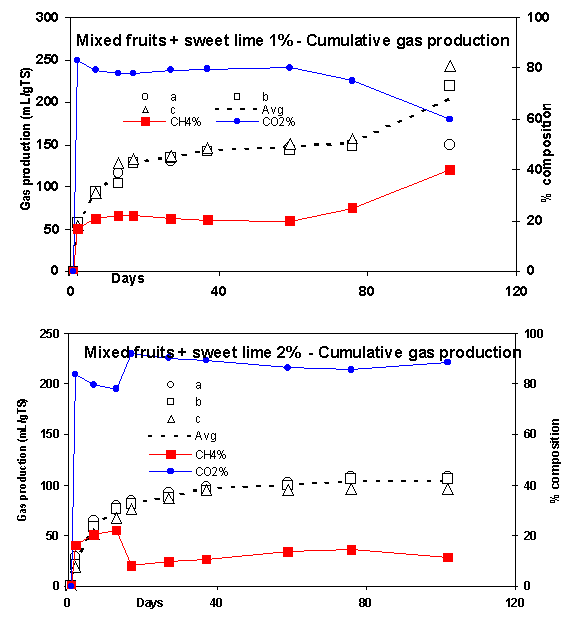
Fig 4.25. Cumulative gas production pattern of mixed fruits and mosambi mixture.
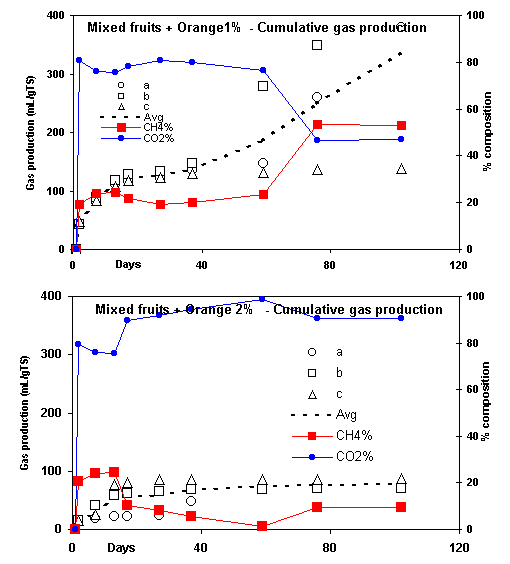
Fig 4.26. Cumulative gas production pattern of mixed fruits and orange mixture.
4.2.13. Water hyacinth whole plants
Water hyacinth fresh has been studied for its BMP. In spite of an early increase in gas production similar to the one found in dry water hyacinth. There is a high gas production accompanied by greater than 50% methane concentration in both 1 and 2% assay (Fig 4.27). A steady state gas production is found up to a period of 40d after with signs of leveling off of gas production. Methane concentration has remained higher than CO2 suggesting a normal methanogenic process. After leveling off occurring, after period of 40d no rapid spurts in gas production has been found. In terms of composition, there is no significant difference between 1 and 2% BMP assay. Although rate of gas production is low in 2%, data suggests that no significant inhibition is likely at higher concentrations of this feedstock. The ultimate BMP is around 0.6 m 3 CH 4 /kg TS and around 0.35 m 3 CH4 /kg TS. Fresh and dry water hyacinths have been a subject of study for energy recovery from aquatic weeds (Chynoweth,1982; Klass and Ghosh,1981; Mallik, 1990).
4.2.14. Fresh water hyacinth leaves
Fresh water hyacinth leaves has posed a challenge for biogas production in terms of its low bulk density, reaching levels as low as 30kgTS/m 3 . This poses a challenge for biogas production in conventional reactors. In the BMP assay, these leaves did not exhibit a large initial gas production and accompanying indicators for high VFA flux (Fig 4.28). The methane concentration has remained in the range of 50% throughout the study period. 1 and 2% concentration suggesting that at higher concentrations of this feedstock, methanogenesis is unlikely to be inhibited by VFA fluxes. A steady state gas production continues throughout the study period and the absence of a leveling off suggests, a low gas production due to factors other than VFA induced inhibition. The ultimate BMP is in the range of 0.6 m 3 /kg TS or around 0.350 m 3 CH4 /kg TS . There is a significant reduction in gas production levels between 1 and 2% assay. There is no indication of methanogenic inhibition. Water hyacinth leaves has been used previously as a feedstock to biogas production and the gas production levels achieved are similar to those found in literature (Gopalakrishna, 1989).
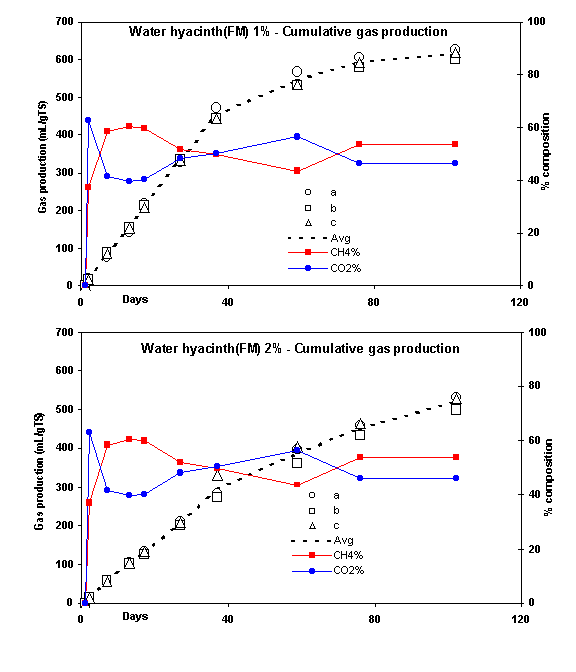
Fig 4.27. Cumulative gas production pattern of fresh water hyacinth whole plants
Fig 4.28. Cumulative gas production pattern of fresh water hyacinth leaves
4.2.15. Water hyacinth roots
Water hyacinth roots are recovered and removed for use in various other materials such as compost, microbial inoculants etc. They can be expected to form separate wastes around urban tanks taking water hyacinth tops away as cattle feed while roots are left behind and form a part of USW. There has been a significantly high methane concentration through out the study period and there is a total absence of rapid initial VFA production has been consistently low (Fig 4.29). A steady state gas production is found to occur until 30d period of which gas production seems to level off. There is no secondary recovery in gas production. The methane concentrations are roughly similar for 1 and 2% concentration feedstock of the assay and suggest that higher concentration of feedstock are unlikely to inhibit the biogas production process. The ultimate BMP was low at 0.27m 3 CH4 /kg TS and suggests this is a poor feedstock for biogas production. Previous studies have shown a low gas production from water hyacinth roots and the current study showed the same with that reported in literature.
4.2.16. Paper mulberry
It is a large tree-weed occurring on IISc campus. Its litter production is high and constitutes the significant component of litter component of USW collected on the campus. Paper mulberry has been previously studied for biogas production and has been found large quantities of biogas. It is of interest to determine the BMP of this feedstock in the form of litter. There is an initial gas production level accompanied by low methane and high CO2 concentration. This is characteristic of initial VFA flux and short duration methanogenic suppression (Fig 4.30). A gradual steady state accompanied with rise in methane concentration occurred and lasted up to 59d. This recovery of methane is the suggestive of possible acclimatization by bacteria. This is also seen in 2% TS with recovery after 60 th day. A leveling off gas production was found. An early leveling off was seen in 2% lasts at 60d followed up by a recovery of gas production later and is the indicative of non-VFA induced inhibition. Further research is required to determine nature of this inhibition. No such increase was encountered in1% TS. The ultimate BMP for this feedstock was 679mL/gTS, suggests that this is a good feedstock for biogas plants with lower TS concentration. From the above results, it is clear that care is needed when using this feedstock at higher concentrations
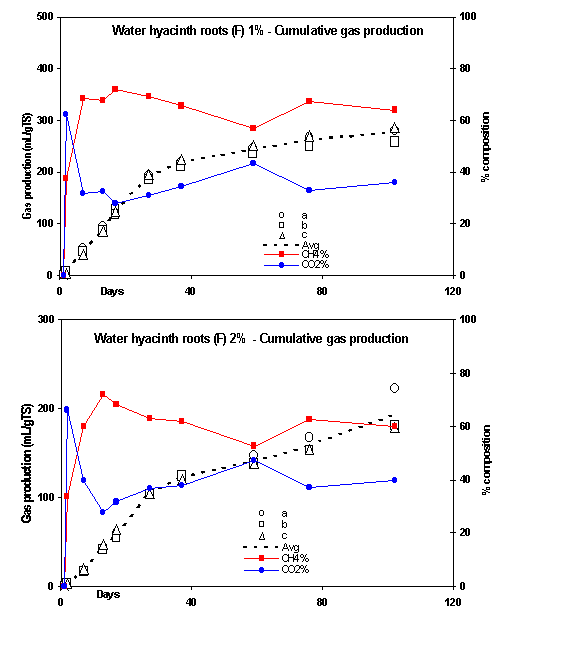
Fig 4.29. Cumulative gas production pattern of fresh water hyacinth roots.
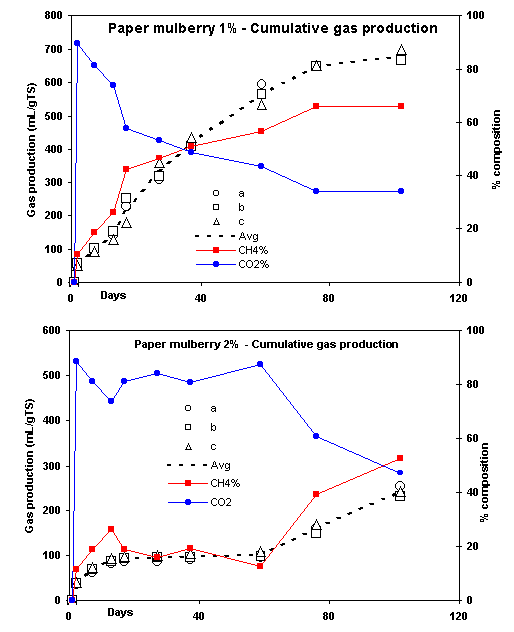
Fig 4.30. Cumulative gas production pattern of paper mulberry.
Thus from the BMP results of different feedstocks, water hyacinth and agro residues gave good biogas production potential, has not shown the same in the SSB digestion. This infers that under controlled condition VFA flux was avoided by the recovery of methanogenic bacteria in the initial lag period. Other feedstocks did not show any significant difference except fruit wastes and it was affected by rapid VFA flux, in turn needs careful start up procedure to avoid souring. Hence the proper start up and pretreatment procedure is needed to improve the gas yield in such lab study.
4.3. Reuse of digested biomass as methanogenic support in DFFBR
Methanogenic bacteria were found strongly adhered to several green biomass feedstocks digested in a solid phase biogas fermentor. Methanogenic activities measured on such biomass support material exhibited a potential to achieve much higher gas production rates (Chanakya et al., 1998). Hence these digested feedstocks were examined for their potential in acting as a biofilm to convert the liquid waste in to biogas. In addition, reticulated spirals (synthetic support tested against naturally occurring material for their efficiency of supporting the methanogenic bacteria) and mixture of biomass with bagasse was also tested.
4.3.1. Daily gas production
The gas production pattern (Fig 4.31) in relation to stepwise changes in feed rates as well as a gradual replacement of the recycled effluent by anoxic water was studied. It was observed that up to a daily feed rate of 0.16-1g/L/d with 100% effluent recycling gave the gas production of 3L in the case of bagasse and PVC used as support. With a mixture of bagasse and spent biomass as a support material, gas production rose to maximum of 5.5L/d. These results suggest that a mixture of bagasse and biomass (digested in an anaerobic reactor) provides for a good support material for methanogenic biofilms to form and function. A combination of bagasse and biomass provided a long duration support compared to leafy biomass alone that has a half life in the range of 120d (Chanakya et al, 1998).
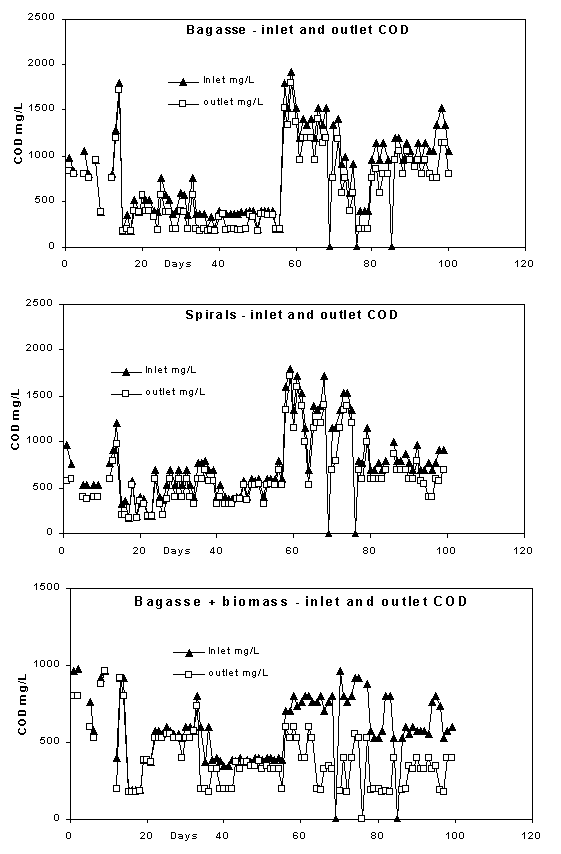
4.3.2. COD conversion Vs gas production rates
The COD conversion pattern was very well coincides with gas production pattern. Maximum of COD conversion in all the fermenters harboring bed materials was observed when it was recycled with 100% effluent. An attempt was made once in 15 days to reduce the dependence of on the extent of effluent recycled. When the extent of effluent reduced to 25%v/v, the fermentor became unstable and the effluent gradually became acidic (pH 5.6). At this stage, recycling with 50v/v of effluent was started. Then the gas production gradually picked up to the maximum levels. These results suggest that the practice of effluent recycling will be required under operating conditions followed. The reason for this dependence on recycling is not clear from data available. Hence at the startup of these fermentors, recycling plays an important role and will need to be understood better. Inlet and outlet COD of the synthetic effluent was given in the Fig 4.34.
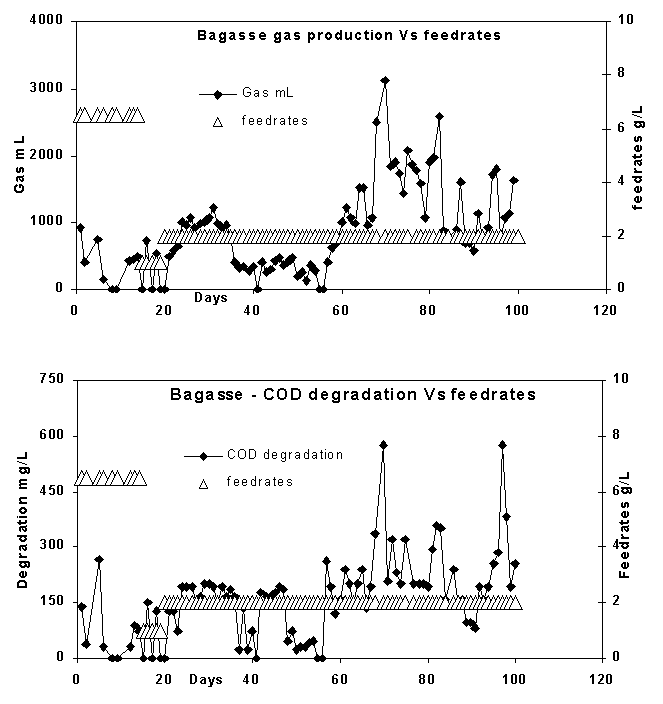
Fig 4.31. Feed rate Vs Gas production and COD degradation for bagasse
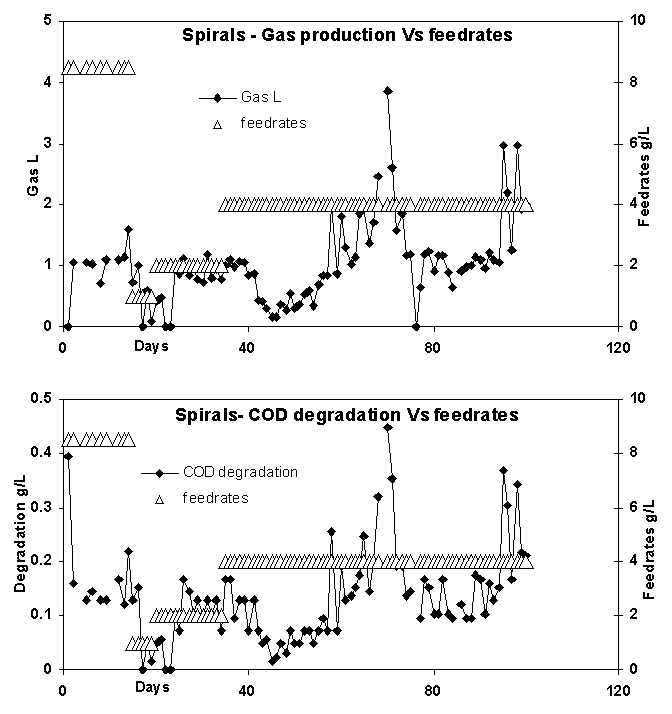
Fig 4.32. Feed rates Vs Gas production and COD degradation for spirals
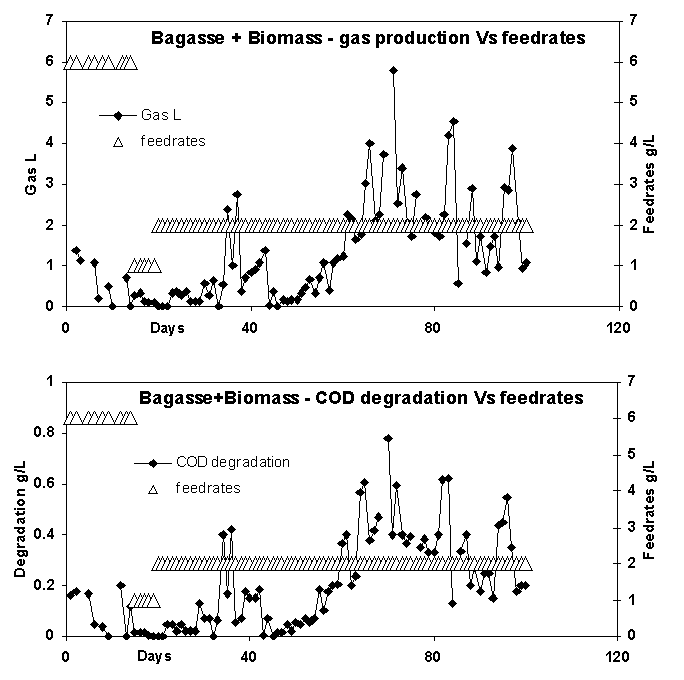
Fig 4.33. Feed rates Vs Gas production and COD degradation for bagasse + biomass
Fig 4.34: COD reduction in DFFBR reactor.
4.3.3. Gas composition
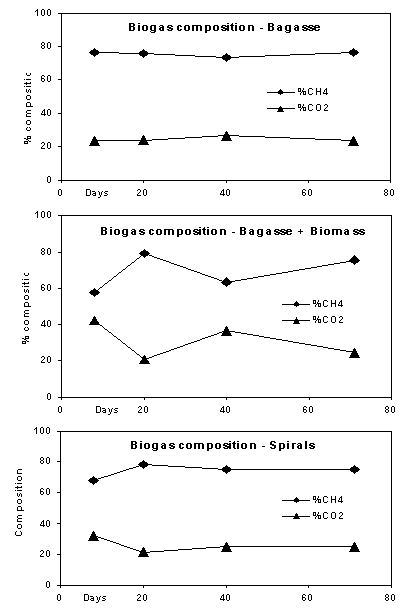
The biogas composition of fermentor with biomass support of bagasse, bagasse + biomass mixture and PVC spirals showed a good methane content of above 60-70%. This in turn suggests good methanogenesis. Yet, in spite of high methane content, various indicators of digester failure occurred. Such is situation is possible when digesters have regions of malfunction and regions of good conversion. Further studies are required to develop techniques that can overcome this problem before biomass is employed as methanogenic support in high rate digesters.