 |
Landslide Susceptible Locations in Western Ghats: Prediction through OpenModeller |
 |
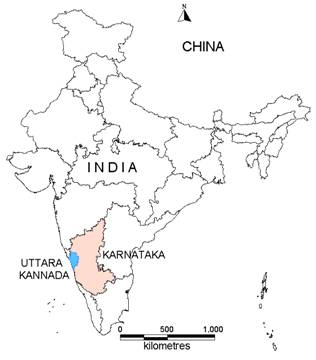
Study area and Data The Uttara Kannada district lies 74°9' to 75°10' east longitude and 13°55' to 15°31' north latitude, extending over an area of 10, 291 km2 in the mid-western part of Karnataka state (Fig. 5). It accounts for 5.37 % of the total area of the state with a population above 1.2 million [45]. This region has gentle undulating hills, rising steeply from a narrow coastal strip bordering the Arabian sea to a plateau at an altitude of 500 m with occasional hills rising above 600–860 m. This district with 11 taluks, can be broadly categorised into three distinct regions –– coastal lands (Karwar, Ankola, Kumta, Honnavar and Bhatkal taluks), mostly forested Sahyadrian interior (Supa, Yellapur, Sirsi and Siddapur taluks) and the eastern margin where the table land begins (Haliyal, Yellapur and Mundgod taluks). Climatic conditions range from arid to humid due to physiographic conditions ranging from plains, mountains to coast.
Survey of India (SOI) toposheets of 1:50000 and 1:250000 scales were used to generate base layers – district and taluk boundaries, water bodies, drainage network, etc. Field data were collected with a handheld GPS. Environmental data such as precipitation of wettest month and precipitation in the wettest quarter were downloaded from WorldClim – Global Climate Data [http://www.worldclim.org/bioclim].
Other environmental layers used in the model were obtained from USGS Earth Resources Observation and Science (EROS) Center based Hydro1Kdatabase [http://eros.usgs.gov/#/Find_Data/Products_and_Data_Available/gtopo30/hydro/asia] which are as follows:
In areas of no slope, a CTI value is obtained by substituting a slope of 0.001. This value is smaller than the smallest slope obtainable from a 1000 m data set with a 1 m vertical resolution.
The spatial resolution of all the data were 1 km. Google Earth data (http://earth.google.com) served in pre and post classification process and validation of the results. 125 landslide occurrence points of low, medium and high intensity were recorded using GPS from the field and published reports. |
 (9)
(9) 
| E-mail | Sahyadri | ENVIS | GRASS | Energy | CES | CST | CiSTUP | IISc | E-mail |