¦ ¦ ¦ ¦ ¦
ENVIS Technical Report 143,   May 2018
WASTE MANAGEMENT
Energy & Wetlands Research Group, Centre for Ecological Sciences, Indian Institute of Science, Bangalore, Karnataka, 560 012, India.
E Mail: tvr@iisc.ac.in; bharathh@iisc.ac.in; setturb@iisc.ac.in; svinay@iisc.ac.in Tel: 91-080-22933099, 2293 3503 extn 101, 107, 113
Maps

Map is a picture of a place as our eyes see it or best-known models of real world. Maps have been used for thousands of years to represent information about the real world. Their conception and design has developed into a science with a high degree of sophistication. Maps have proven to be extremely useful for many applications in various domains.

A disadvantage of maps is that they are restricted to two-dimensional static representation, and that they always are displayed in a given scale. The map scale determines the spatial resolution of the graphic feature representation. The   smaller the scales, the less detail a map can show. The accuracy of the base data, on the other hand, puts limits to the scale in which a map can sensibly drawn. The selection of proper map is one of the first and most important steps in map design.

A map is always a graphic representation at certain level of detail, which is determined by the scale. Map sheets have physical boundaries, and features spanning two map sheets have to cut into pieces.

Cartography as the science and art of map making functions as an interpreter translating real world phenomena into correct, clear and understandable representation for our use. Maps also become a data source for other maps.

Maps are made for many reasons and, therefore they vary in content and context. Different maps show different information. Different symbols are used to represent the features of the environment on a map. They are explained in the legend for each map. 

Some examples

A photograph: A photograph shows a place as our eyes see it. However, the area that is viewed on the ground is limited. It is often difficult to see a substantial landscape in a single photography. 

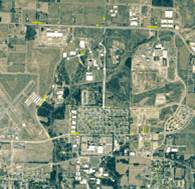
Aerial photography: A photography taken from an aircraft is known as an aerial photo (fig 2.1). These photograph are normally. Taken to prepare maps of an area. Aerial photographs give a ‘birds-eye’ view of the earth’s surface. Features on earth look different from above; consequently, field experience is needed to make correct interpretation of these photographs.

Shade relief map

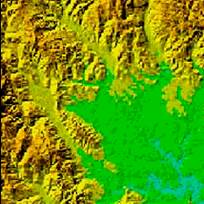
A shaded relief map (fig 2.2) shows how an area looks when sunlight is shining on it from a particular direction. It gives an impression of the nature of the terrain. We can visualize whether an area is plain or rugged by theses maps.

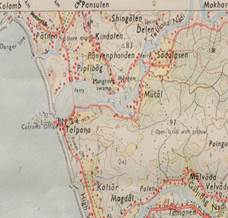
Topographical map: A topographical map (fig 2.3) shows the shape of the earth’s surface by contour lines. Contours are the imaginary lines that join points of equal elevation on the surface of land above or below a reference surface such as mean sea level. These maps include symbols that represent features such as street, buildings, rivers, and forests. Topographic maps are used by most applications as the base map on which other feature or phenomena are referenced.

Road/ tourist map

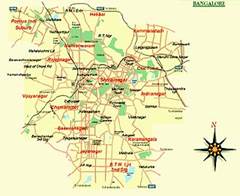
Road maps (fig 2.4) show people the route for traveling from one place to another. They show some physical features such as cities and towns. Normally, tourist maps emphasize the location of monuments and tourist spots.

3-D map
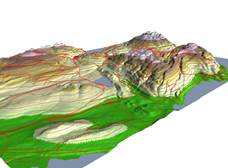
3-D maps (fig 2.5) show a phenomenon in three dimensions. They help us visualize an area as continuous surface that rise and fall showing the high and low values of the phenomenon.

The image “http://www.ac.wwu.edu/~talbot/ex10/3dbham.jpg” cannot be displayed, because it contains errors.

Use of maps: Maps give us a better understanding of a place. The information they contain depends on the type of maps are used to obtain answers to the following fundamental questions.

  • Where: Locations and Navigation: We try to locate ourselves with respect to rivers, mountains, buildings, trees and other landmarks to make references to where we stand. Similarly, we also think of places in terms of other places and try to find the shortest rout to reach the destination. For example, you know where you live relative to your friend’s houses, your school and the supermarket you visit and even the shortest as well as least congested route. Since these features are depicted on a map with their positions relative to each other, we can locate ourselves by relating these features   on the map and these features in our surroundings. To know where we stand maps even provide us with the information on latitude and longitude, the coordinate system to measure all places on the earth.
  • Information: Apart from road maps and topographic maps that help us locate ourselves and navigate, there are many other types of maps, which are made for conveying information on a specific topic. These are known as thematic maps. They are made for a purpose. Maps of rainfall, temperature, population density, etc are thematic maps that give us information on a theme in the area concerned.   

 Map reading
Reading a map means interpreting the colors, lines and other symbols. Features are shown as points, lines or areas depending upon their size and extent. Besides recognizing the features, knowing their location and distances accurately is also important. Map symbols and map scales provide this information.
Point features: Point features or geographically defined occurrences are features whose location can be represented by a single x, y or x, y, z location. Points have no linear or areas dimensions but simply define the location of a physical feature (control point: monument, sign, utility pole) or an occurrence (e.g. accident).
Line featureLines represent feature that have a linear extent but no area dimensions. Centerlines of roads, water mains and sewer mains are examples of line features.

Area features: Area features, also called polygons, have a defined two-dimensional extent and are delimited by a boundary lines that encompass an area. For example: district, soil type, agro climatic zones etc.

Three-dimensional surfaces:Some geographic phenomena are best suited to represent in three-dimensional form covering an area. The most frequent example is surface terrain often represented by contour lines that have an elevation value. This concept can be applied to other spatially continuous data as well. For instance, population density or income levels could be mapped as a third dimension to support demographic analysis or water consumption statistics.

Scale: Map scale describes the relation between mapped size and actual size. It is expressed as a relationship between linear distances on the map and corresponding ground analysis.

 Representative Fraction (RF). This is pure fraction that represents the ration of map distance to ground distance without specifying any measurement unit. RF value of 1: 25000 implies that 1 cm in the map is equivalent to 25000 cm (250 mts) in the real world.
Large-scale maps cover small areas and usually include a greater level of detail than small-scale maps that depict larger areas in lesser details. The following general scale categories apply.

Map numbering: The map numbering system used in India are:

  • The international system (CIM)

  • India and Adjacent countries (IAC) system.

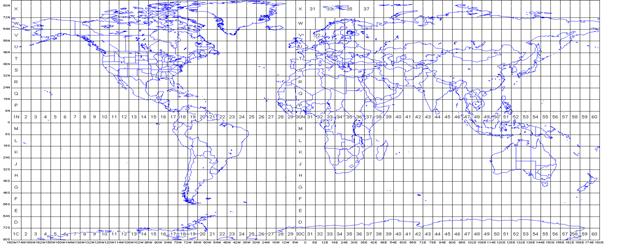
The International System: This system is used for international map on 1:1 million scale. Each sheet covers an area of 40 latitude by 60 longitude. The geographical position of the sheet is defined by two letters and a number. The first letter is N or S depending on whether the sheet is north or south of the equator. Next letter after the N or S indicates latitude of sheet alphabetically with the capital letters in succession of each 40 band. Numbering starts from 1800 longitude and goes from west to east, the number changing after 60 longitude. Each 1:1milionsheet is sub divided into 24 sheets each covering an area of 10 by 10. The numbering of the sheets starts alphabetically from northwest corner and proceeds from west to east. Number of north west corner sheet is A and that of south east corner sheet is x. the sheet covering latitude each 200 to 210 N and 80 0  to 810 will be numbered as NF 44 C.  


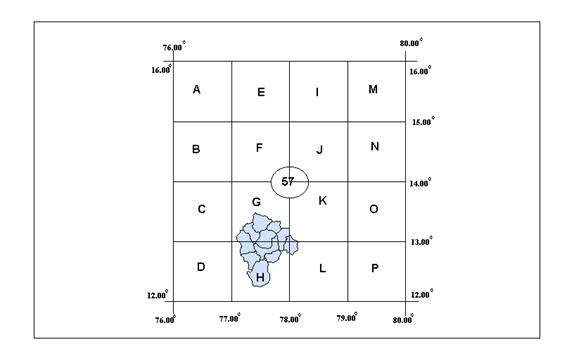
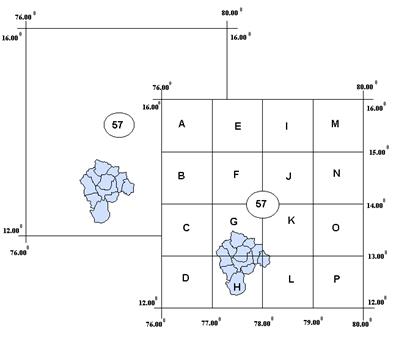
India and Adjacent countries system: IAC system is the system followed by the Survey of India maps. Each sheet is bound by 40  latitude and 40 longitude, which is 1:1 million scale. The sheets numbered from North to South and starts with 400 N latitude and 420 E longitude. Sheets falling in the sea are not numbered. Sheets covering India are numbered from 39 to 58.  The 1/M sheets are further sub-divided into 16 equal parts of 10 x10. The sheets are in 1:25000 scale. These sheets are numbered from A to P and each grid is called by the sheet number followed by the alphabet i.e. for the 1/M sheet 48, sixteen components are 48A to 48P.


Shaded cell shows 48 J of scale 1: 250000.
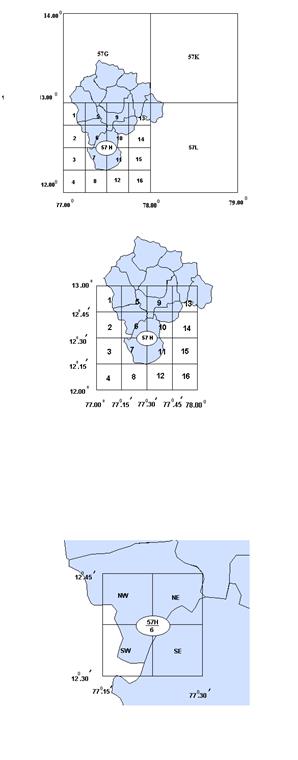
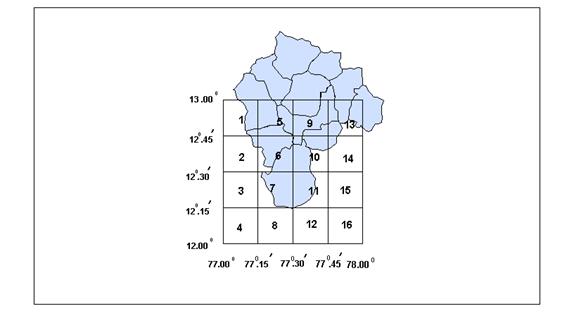
The 10 x 10 map (degree sheet) is again subdivided into sixteen equal parts - each of fifteen minutes of latitude and longitude in extent. These sheets are numbered from 1 to 16 (e.g.: 48J/1, 48J/2 to 48J/16) and on the scale 1: 50000 scale maps.

Shaded cell shows 48 J/12 of scale 1:50000 scale
The 1:50000 sheet is further divided into four equal parts of 7.5' latitude x 7.5' longitude. The sheets are numbered A/1/NW, A/1/NE, A/1/SW, A/2/SE and scale is 1:25000.

48 - 15'  x 15' on 1: 50000 scale

Shaded cell shows 48 J/12/NE of scale 1:25000 scale

Symbols: The meaning of each symbol used in a map is described in the map’s legend. However, many symbols in topographic maps have become conventional and can be interpreted without looking at the legend. For example, an area feature shown in green is vegetation, blue water, gray or red built-up etc.

Map projection: As we know earth is not a perfect sphere, but more like an ellipsoid with flattering at the poles. The shape of the Earth is there fore expressed by the shape of the ellipsoid. For geodetic calculation an ellipsoid called datum is used. The common datum for a country or area requires that there are specific coordinates for the datum origin, while this has to have height in relation to a given sea level (e.g. WGS84).

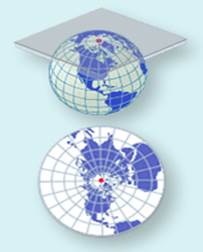
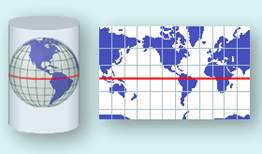
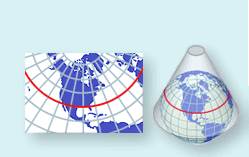
Geo-referenced data may be drawn on a map only when referenced to a plane surface, not to the curved surface of the Earth. Various projections are used to represent the curved surface of the earth on the plane surface of the map. They are classified into three groups according to the underlying geometrical transformation involved: azimuthal, cylindrical, and conical. It should be remembered that all projections method, will affect distance, area, direction or shape and that these errors multiply with the increasing size of the area represented.  

Azimutal: This projection the points from the earths surface are projected to a plane, which is to it. This projection does not take into account the curvature of earth and hence can be used for the mapping of small areas only.

Cylindrical projection: The earth is projected on a cylindrical developing surface which can be flattened to form a map. Depending on the orientation of the axis of cylinder with the axis of the earth, a number of projections are possible. Transverse Mercator projection based on cylindrical projection, which is one of the widely used projection.

Conical projections: In this projection the globe is projected on a conical surface. Polyconic and Lambert conformal projection are extensively used in   map preparation. 

Coordinate system: The geographic coordinates on the surface of the Earth are latitude, measured in degrees north or south of the equator, and longitude, measured in degrees east or west of Greenwich. Positions in latitude and longitude are only relative; distances and areas must be calculated using spherical geometry and the Earth’s radii to the points in question. In applications, latitude and longitude are usually used in describing major land areas.
The GISs have facilities for transforming data from one coordinate system to another, based on common points in the two systems.  When the common point is unknown, the parameters for the datum, project method, and coordinate system should be ascertained.
The best-known coordinate system is the UTM Gird (Universal Transverse Mercator Grid). UTM covers the entire surface of the Earth surface with the help of 60 zones or axes, each with a width of 6 0. 


Relevance to GIS

 Maps are a common source of input data for a GIS. In GIS often-input maps will be in different projections, requiring transformation of one or all maps to make coordinates compatible. Thus, mathematical functions of projections are needed in a GIS. GIS are used for projects of global or regional scales so consideration of the effect of the earth's curvature is necessary. Monitor screens are analogous to a flat sheet of paper thus; need to provide transformations from the curved surface to the plane for displaying data.


E-mail     |     Sahyadri     |     ENVIS     |     GRASS     |     Energy     |     CES     |     CST     |     CiSTUP     |     IISc     |     E-mail