Accounting of ecosystem services from microalgae in wetlands of Shivamogga district, KarnatakaCite
Asulabha K. S.1,4, Jaishanker R.4, Sincy V.1,4 and Ramachandra T.
V.1,2,3
1Energy & Wetlands Research Group [CES TE15], Centre for Ecological Sciences,
2Centre for Sustainable Technologies (ASTRA)
3Centre for infrastructure, Sustainable Transportation and Urban Planning (CiSTUP)
Indian Institute of Science, Bangalore - 560 012, India.
4Indian Institute of Information Technology and Management-Kerala (IIITM-K), Thiruvananthapuram,
Kerala
envis.ces@iisc.ac.in
tvr@iisc.ac.in Phone:
080 22933099/22933503 (extn 107, 114)
Materials and Methods
Study Area
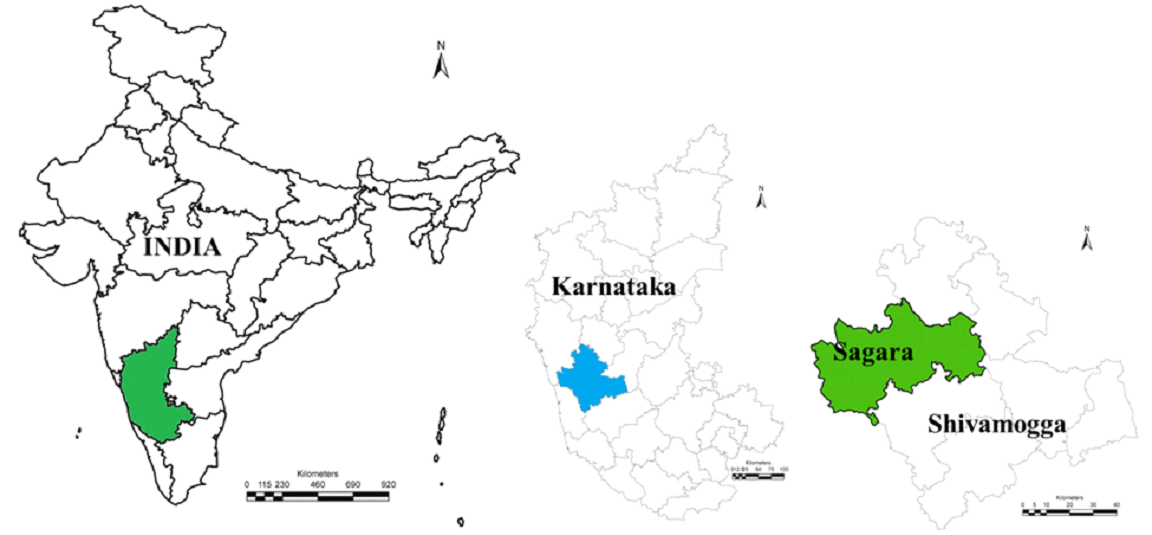 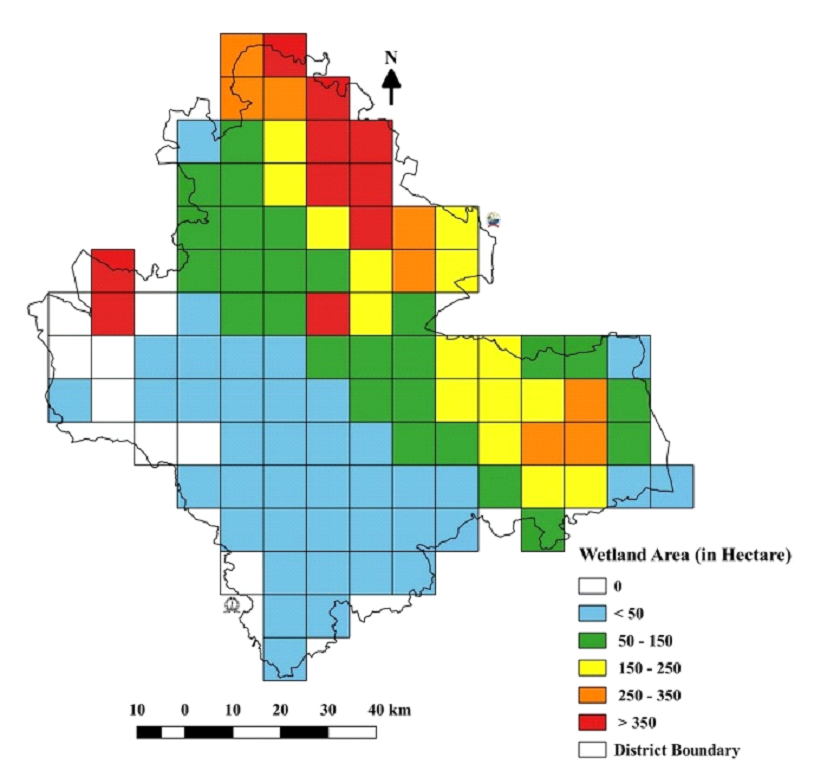 |
Figure 1: Wetland area of Shivamogga district, Karnataka, India
Shivamogga district is a part of the Malnad region of Karnataka with a geographical area of 8477 sq.km that lies between the latitudes 13o27' and 14o39' N and between the longitudes 74o38' and 76o04' E. The district is bounded by the districts of Haveri, Davanagere, Chikkamagaluru, Udupi, and Uttara Kannada. The district headquarters is Shivamogga city. The study region (Karnataka State) is divided into 5'x5' equal area grids (2597) covering approximately 9 km x 9 km of 1:50,000 topographic maps of the Survey of India, from which we extracted grids of Shivamogga district for ecosystem service valuation. The wetland area (grid-wise) of Shivamogga district in Karnataka is shown in figure 1.
The Shivamogga district is divided into 2 sub-divisions and 7 taluks. Shivamogga sub-division comprises the taluks of Shivamogga, Bhadravathi, and Thirthahalli. Sagar sub-division comprises Sagar, Shikaripura, Sorab, and Hosanagara. The total population of the district is 17,52,753 (as per the 2011 census). Shivamogga district is rich in flora and fauna, the dense forest and green shrub jungles are the main producers of sandalwood, rosewood, teak, and other exotic timber. The major crops grown are paddy, coconut, ragi, pepper, areca, and sugarcane. Shivamogga district is home to numerous rivers, including the Kali, Gangavathi, Sharavathi, and Tadadi, all of which originate in the district. The other major rivers that flow through the district are the Tunga, Bhadra and Varada. The two rivers, Tunga and Bhadra, meet at Koodli near Shivamogga city, hence, the name Tungabhadra, which later joins Krishna. Agumbe has the highest rainfall (8000 mm/annum) in southern India and is situated in this district.
The assessment was based mainly on the benefit transfer method, as well as the residual value and resource rent methods. The benefit transfer method allows the transfer of monetary values for various ecosystem services from previous literature that focuses on different regions or time periods (Ramachandra et al., 2019). Total ecosystem supply value (TESV) is the summation of all three ecosystem services, such as total provisioning, regulating, and cultural services. The residual value and resource rent methods estimate the value of an ecosystem service by taking the gross value of the final marketed good to which the ecosystem service provides an input and then deducting the cost of all other inputs, including labour, produced assets, and intermediate inputs (SEEA, 2021). In the international System of Environmental-Economic Accounting (SEEA, 2014), ecosystem assets are generally valued on the basis of the net present value (NPV) of the expected flow of ecosystem services. NPV (for 50 years at a discount rate of 3%) was calculated considering ecosystem services of microalgae for wetland ecosystems in the Shivamogga district of Karnataka.
The equation for Residual value method used for provisioning services is as follows:
Σni=1 Qi x (Pi-Ci) --------- (1)
where Qi represents quantity, Pi is the price, Ci is the cost involved in the harvest of ith product
The equation for Benefit transfer method:
Σni=1 Vix Ai ---------- (2)
where Vi represents the monetary values per hectare and Ai represents the area
Total ecosystem supply value (TESV) is calculated as follows:
i = 1,2,3 (1: provisioning, 2: regulating and 3: Cultural)
Σ E Vi ---------(3)
where, NPV = net present value of wetland assets; R = net cash flow in year t; T = discount period (50 year); and r = discount rate (3%).
The values adopted for the valuation of ecosystem service from microalgae of wetlands in Shivamogga district are shown in table 1. QGIS open-source GIS software was used to generate maps of various ecosystem services provided by microalgae. This study that quantifies and maps the ecosystem services provided by microalgae in wetlands helps in understanding the worth of microalgae and allows for the protection and conservation of wetlands.
Table 1: Values adopted for valuation of ecosystem service from microalgae
ES |
Services |
Value in Rs/ha/yr |
Provisioning Services |
Biodiesel |
51744 |
Glycerol |
3763 |
|
Feed for fish |
4200 |
|
Food (Protein) |
50760 |
|
Genetic material |
476 |
|
Regulating Services |
Water purification |
16225 |
Nursery service |
10221 |
|
Carbon sequestration |
234404 |
|
Nutrient recycling |
13604 |
|
Cultural Services |
Spiritual experience |
8 |
Opportunities for recreation and tourism |
12111 |
|
Education |
29144 |
|
Inspiration for culture, art and design |
905 |
|
Species appreciation |
1954 |
|
Source: Ramachandra et al., 2022; ESVD, 2020; Clarkson et al., 2013 |
||