Study Area
The study area covered Karnataka and districts to analyse the energy trajectory of
Karnataka.
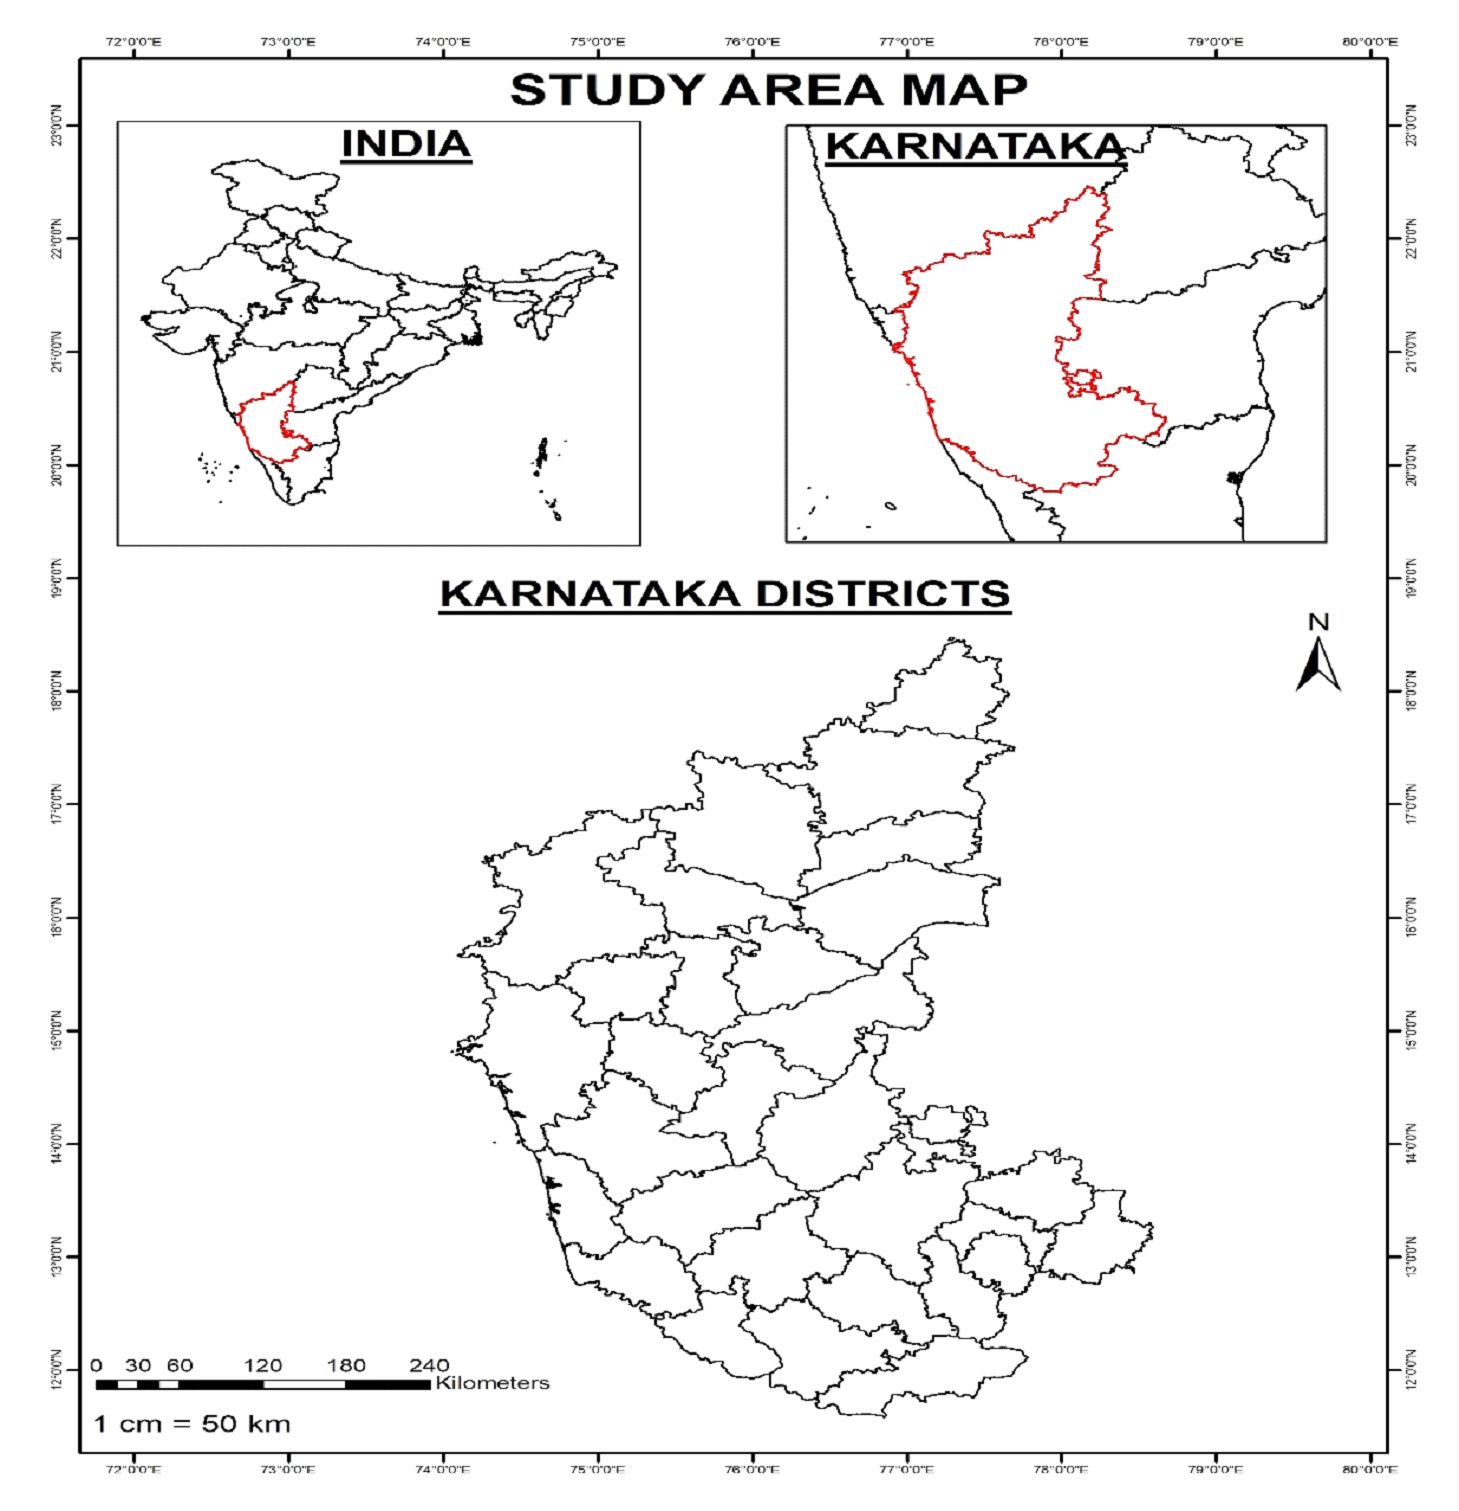
Karnataka is the eighth largest state in India with a geographic area 191791 sq.km, and
it accounts for nearly 5.83 percent of India’s total area (Figure 3). Karnataka state
consists of 31 districts divided into 4 administrative divisions: Bengaluru, Belagavi,
Kalburgi, and Mysuru. The state has a tropical monsoon-type climate and receives rainfall in
the range of 50 cm to 350 cm annually. Karnataka is located in south-western region of India
and falls between the latitudes 11.5º N to 18.5º N and 74̊ºE and 78.5̊ºE longitude. The
population of Karnataka state is 71957278 as per the projected population of 2021. Over the
past years, the Karnataka state has shown improvements in the education, agriculture,
industries, and tourism sectors. The state is also called the Silicon Valley of Asia due to
the embellishment in the information technology sector.
Fig. 3 Study Area
The energy trajectory of the Karnataka assessment involved (ⅰ) analysis of energy
resource status in Karnataka (ⅱ) assessment of energy generation by the power plants. (ⅲ)
supply-demand strategy in Karnataka state by calculating the per capita consumption in
various sectors. (ⅳ) the bioresource availability in Karnataka by calculating the per capita
biogas yield of each district as well as (ⅴ) analysing the future prospects of renewable
energy by assessing the solar energy potential and wind energy potential of the districts in
Karnataka. The energy resource status was analysed from annual reports of different energy
corporations in the state. The per capita energy consumptions were calculated by referring
previous studies on energy as well as based on the last census report (2011). Per capita
transport fuel consumption was calculated based on the yearly data of vehicle registration
in the state. The coal consumption in Karnataka was assessed by calculating the coal
requirement in major thermal power plants on the basis of their specific coal consumption.
The study also covers the analysis of the energy potential from bioresources in Karnataka by
evaluating the biogas yield in each district for all livestock according to their breed and
the analysis of the renewable energy potential in Karnataka by calculating the annual solar
and wind potential of each district and mapping was done using Quantum-GIS software.
The Resource Status: Energy Supply in Karnataka
Karnataka uses both conventional as well as non-conventional energy sources. Since there
is no coal or oil deposit in the state, hydroelectricity is used as the main commercial
energy. Karnataka state relies on seaborne coal or on the coal supplied from other states
like Telangana, Odisha and Jharkhand. The main coal fired thermal power plants in Karnataka
are the Raichur Thermal Power Station (RTPS), consisting of 8 units, Bellary Thermal Power
Station (BTPS) having 3 units, and Yermarus Thermal Power Station (YTPS) having 2 units.
Nearly 52% of energy consumption in Karnataka is from non-commercial energy sources like
that of fuelwood, animal residues like dung-cakes, agricultural and horticultural residues.
Karnataka promotes the use of renewable energy to reduce emissions caused by the excessive
use of non-renewable energy and wipe out the state's energy poverty. Pavagada Solar Park was
commissioned in 2018 as a part of The Jawaharlal Nehru National Solar Mission (JNNSM) also
known as The National Solar Mission. The solar park was constructed in 13000 acres of land
in Tumkur district, and it has a total energy generation capacity of 2000MW. The National
Solar Mission was started in 2010. This project aimed to produce 175 GW of renewable energy
by 2022 of which 100 GW of energy was generated from Solar power plants. Energy supply in
Karnataka was assessed by collecting secondary from the Karnataka government websites. The
annual reports from Karnataka Power Corporation Limited (KPCL), Karnataka Electricity
Regulatory Commission, Karnataka Power Transmission Corporation Limited (KPTCL), Karnataka
at a glance etc were collected, and the resource status was analysed to determine the
sector-wise energy resource share in the state.
The energy generated in Karnataka state
The main types of power plants in Karnataka state include thermal, hydroelectric, wind,
solar and diesel generation power plants. Karnataka has a surplus of renewable energy
potential. The 2018 energy mix data showed that the state had nearly 46% installed
generation capacity from thermal sources, 13% from hydroelectric, and 3% from nuclear power
plants. The analysis of the progress in the installed capacity as well as the power
generation was done for all the major power plants in Karnataka. Installed capacity is the
maximum capability of a power plant to generate electricity over a period. It is important
to calculate the installed capacity of power plants to determine the total cost required to
construct the power plant and the power that can be generated from a plant. The economic
survey of Karnataka gave the details on the installed capacity of the Karnataka Power
Plants, and the annual reports of the economic survey of Karnataka from the year 2013 to
2019 were analysed to get the progress in the installed capacity of the power plants in the
state. The energy generation from different power plants were analysed based on the annual
reports collected from the respective departments. The Karnataka government established
KPCL- Karnataka Power Corporation Limited in 1970 with an installed capacity of 746 MW which
now progressed to 8738.38MW. KPCL power generation consisted of all the energy resources
such as thermal, hydroelectric, wind, solar, diesel, and gas. Shivanasamudram power plant in
Karnataka was the first hydroelectric power plant in Asia which was constructed over the
Cauvery river bank in 1902.
The energy supply-demand in Karnataka
Energy demand is the amount of energy required in order to perform certain activities
over a particular time period. It can be measured in terms of the total energy consumption
and depends on the system's fuel types and end-use efficiencies. Management of energy demand
is equally important since it regulates the consumer loads through different ways like that
of incentive-based, energy saver plan, promoting use of renewables and providing public
awareness. Forecasting the future energy demands aid to meet energy requirements and also
monitors energy growth. This study analyses the sector-wise energy demand in Karnataka based
on the per capita energy consumption in each district.
Per capita electricity consumption in Karnataka
Per capita, electricity consumption can be defined as the average amount of electricity
consumed by a person over a particular period. In Karnataka, there are five Electricity
Supply Companies (ESCOMS), namely (i) Bangalore Electricity Supply Company Limited (BESCOM)
covering eight districts, (ii) Mangalore Electricity Supply Company Limited (MESCOM)
covering four districts, (iii) Hubli Electricity Supply Company Limited (HESCOM) covering
seven districts, (iv) Gulbarga Electricity Supply Company Limited with six districts
(GESCOM) and (v) Chamundeshwari Electricity Supply Company Limited (CESC) supplies
electricity in five districts.
Annual per capita electricity consumption of an ESCOM = metered consumption/population
Annual fuelwood consumption
More than fifty percent of the fuel consumption in Karnataka is derived mainly from
non-commercial sources, and fuelwood plays a major role in fulfilling the energy
requirements of the state. The annual fuelwood consumption is calculated using the per
capita fuelwood consumed for cooking and water heating. The per capita fuelwood consumption
of a district can be defined as the amount of fuel used by a person in that particular
district. The per capita fuelwood consumption was analyzed based on the agroclimatic
classification in the state. Karnataka is divided into ten agroclimatic zones based on the
factors like temperature, rainfall, soil type, vegetation, etc.
Table 1. Agroclimatic zones in Karnataka
| Sno |
Agroclimatic zone |
Districts |
| 1 |
North-East Transition Zone (Bidar) |
Bidar |
| 2 |
North-eastern Dry Zone (Raichur) |
Kalburgi |
| Raichur |
| Bellary |
| Yadgir |
| Koppal |
| 3 |
Northern Dry Zone (Vijaya Pura) |
Vijaya Pura |
| Gadag |
| Bagalkot |
| 4 |
Central Dry Zone (Tumkur) |
Tumkur |
| Chitra Durga |
| Davanagere |
| 5 |
Eastern Dry Zone (Bengaluru) |
Bangalore Rural, |
| Bangalore Urban |
| Kolar |
| Ramanagaram |
| Chickballapur |
| 6 |
Southern Dry Zone (Mysuru) |
Mysore |
| Kodagu |
| Chamarajanagar |
| Mandya |
| 7 |
Southern Transition Zone (Shivamogga) |
Hassan |
| Shivamogga |
| Chickmagalur |
| 8 |
North Transition Zone (Dharwad) |
Dharwad |
| Belgaum |
| Haveri |
| 9 |
Hill Zone (Uttara Kannada) |
Uttara Kannada
|
| 10 |
Coastal Zone (Dakshin Kannada) |
Dakshin Kannada |
| Udupi |
Table 1 shows the agroclimatic zone-wise approximate per capita fuelwood requirement for
cooking and water heating purposes in each district of Karnataka state. This data was used in
the study to calculate the district-wise annual fuelwood consumption of Karnataka as per the
census data of the year 2011 and the projected census data of the year 2021.
The adult equivalent for the total population is calculated from the standard adult
equivalent values. The standard adult equivalent is the standardized value that shows humans'
food intake(energy) and its variability across age groups and sexes. The standard adult
equivalent is taken as 1 for males, 0.85 for females, and 0.35 for children
(Ramachandra et al.,
2000).
Total fuel consumption in a year = Adult equivalent of total population x Total fuelwood per
capita x Number of days in a year
Annual biogas yield = Annual dung yield x Per capita biogas yield
Transport fuel consumption in Karnataka state
The main type of fuels used in the present transportation sector in India is diesel and
gasoline, even though the sector is far behind the adoption of new innovative technologies. The
per capita fuel consumption is the amount of fuel consumed by a vehicle at a given period. The
fuel consumption is calculated based on the approximate value of the annual distance traveled by
a category of vehicle (
Ramachandra & Shwetmala, 2012).
Transport fuel consumption for each vehicle type was calculated as follows:
Distance traveled annually by total number of vehicles in each category = Annual distance
traveled by a vehicle in the respective category x Total number of registered vehicles
Total fuel consumption by total registered vehicles in each category = Distance traveled
annually by total number of vehicles in each category ÷ mileage of that vehicle type
Table 2. The average mileage of vehicles
| 4. |
Mileage |
| Buses - diesel |
4.11 |
| Omni buses - petrol |
14.96 |
| Two wheelers – petrol |
60 |
| Light Motor Vehicles(passengers) – petrol |
18.4 |
| Cars - diesel |
32.5 |
| cars - petrol |
19.3 |
| Taxi – diesel |
19.7 |
| Trucks & Lorries – diesel |
8.45 |
| Light Motor Vehicles(goods) – diesel |
19.6 |
| Trailers - diesel |
3.54 |
4. Mileage
Buses - diesel 4.11
Omni buses - petrol 14.96
Two wheelers – petrol 60
Light Motor Vehicles(passengers) – petrol 18.4
Cars - diesel 32.5
cars - petrol 19.3
Taxi – diesel 19.7
Trucks & Lorries – diesel 8.45
Light Motor Vehicles(goods) – diesel 19.6
Trailers - diesel 3.54
Table 2 gives the mileage of vehicles assigned based on the average mileage taken from
different brands of a vehicle type for calculating the transport fuel consumption in Karnataka
using the number of registered vehicles.
Coal consumption in Karnataka state
The Karnataka state has three major thermal power plants fuelled by coal: Raichur thermal
power plant, Bellary thermal power plant, and Yermarus thermal power plant. This study
calculated the total amount of coal consumed by these power plants in the year 2020. The
Karnataka state experienced a coal shortage in recent years, and hence the Raichur thermal power
plant, which has eight stations, has shown decreased energy generation in recent years. The coal
shortage also forces the state to shift the energy generation to renewable sources such as
solar.
Availability of bioresource - biogas potential
Biogas is a combustible gas used as a fuel produced by the anaerobic decomposition of
organic matter, especially dungs and household organic wastes. Karnataka state has a good biogas
potential due to its relatively high livestock population, which provides organic-rich residues
throughout the year for biogas production. The solid content and moisture content of dung are
estimated to be nearly 18% and 82%, respectively. The approximate dung yield of each livestock
breed and its energy values were taken into account to calculate the state's biogas potential
(Ramachandra et al., 2004) , as listed in table 3.
Table 3 Biogas yield and energy equivalents data
|
Dung yield, biogas yield and energy equivalents for livestock
|
| Livestock type |
Case |
Dung yield (Kg/animal/day) |
Per capita biogas yield (m3) per day |
Energy Equivalent(kcal/kg) |
| Buffalo |
High |
15 |
0.042 |
5340 |
| Buffalo |
High |
15 |
0.042 |
|
Low |
12 |
0.036 |
| Cattle |
High |
7.5 |
0.042 |
|
Low |
3 |
0.036 |
| Goat |
High |
0.1 |
0.042 |
|
Low |
0.1 |
0.036 |
| Sheep |
High |
0.1 |
0.042 |
|
Low |
0.1 |
0.036 |
The study analyses division-wise district biogas potential of Karnataka state by calculating
the yearly per capita biogas yield from livestock using the census data of livestock. There are
four administrative divisions in Karnataka: Bengaluru division, Belagavi division, Kalburgi
division, and Mysuru division. The calculation of breed-wise dung yield for each type of
livestock in the state was done, thus giving the overall potential of biogas availability in
Karnataka.
Annual dung yield for total population = Total number of cattle x Dung yield/day/animal x
Number of days in a year
Annual biogas yield = Annual dung yield for total population x Per capita biogas yield per
day
Renewable energy potential of Karnataka – Solar and Wind
The Karnataka state has a good renewable energy potential consisting of solar, wind, hydro,
tidal, and co-generation projects. This section focuses on the prospects of solar and wind
energy in Karnataka by calculating the annual wind energy potential of Karnataka district-wise
using the data from previous research papers and the wind energy potential map of the state
(Ramachandra et al, 2015) . The solar potential of Karnataka is calculated for each district
using the average solar irradiation data, and the calculated annual solar potential of Karnataka
was analysed in Q-GIS software to generate an annual solar potential map of Karnataka. The study
also provides district-wise renewable energy generation and its achievements over the years.
Table 4. The data used for this study
Resource Status |
| Type |
Data Source |
Reference |
Year |
| Resource share |
Karnataka Electricity Regulatory Commission Annual Report 2019-2020 |
reference link |
2019-2020 |
Energy generation & Installed
capacity |
| Type |
Data Source |
Reference |
Year |
| Hydro |
Karnataka Power Corporation Limited Annual Reports |
reference link |
2015-2021 |
| Thermal |
Karnataka Electricity Regulatory Commission Annual Report 2019-2020 |
reference link |
2019-2020 |
| Resource share |
Karnataka Power Corporation Limited Annual Reports |
reference link |
2015-2020 |
| Wind |
Karnataka Power Corporation Limited Annual Reports |
reference link |
2017-2020 |
| Solar |
Karnataka Renewable Energy Development Ltd Annual Reports |
reference link
|
2020-2021 |
Energy Consumption |
| Type |
Data Source |
Reference |
Year |
| Electricity |
Annual reports of BESCOM, MESCOM, HESCOM, GESCOM, CESC |
Collected from respective websites |
2011 |
| Census data of Karnataka |
reference link |
2011 |
| Fuelwood |
Energy alternatives renewable energy and energy conservation technologies |
T.V. Ramachandra, G. Kamakshi and B.V. Shruthi (2000) |
2000 |
| Census data of Karnataka |
reference link |
2011 |
| Transportation fuel |
Decentralised carbon footprint analysis for opting climate change mitigation
strategies in India
|
T.V. Ramachandra and Shwetmala (2012) |
2012 |
| Vehicle registration report from Karnataka at a glance report |
reference link |
2018-2020 |
| Coal |
Annual reports of RTPS, BTPS, YTPS |
reference link |
2020 |
Bioresource - biogas potential |
| Type |
Data Source |
Reference |
Year |
| Biogas |
Bioresource status in Karnataka |
T.V. Ramachandra, G. Kamakshi and B.V. Shruthi (2004) |
2004 |
| Livestock Census data (Provisional) |
reference link |
2017 |
Renewable energy potential |
| Type |
Data Source |
Reference |
Year |
| Wind |
Wind Energy Potential Map |
Generated using Q-GIS |
|
| Solar |
Solar Energy Potential Map |
Generated using Q-GIS |
|