Results & Discussion
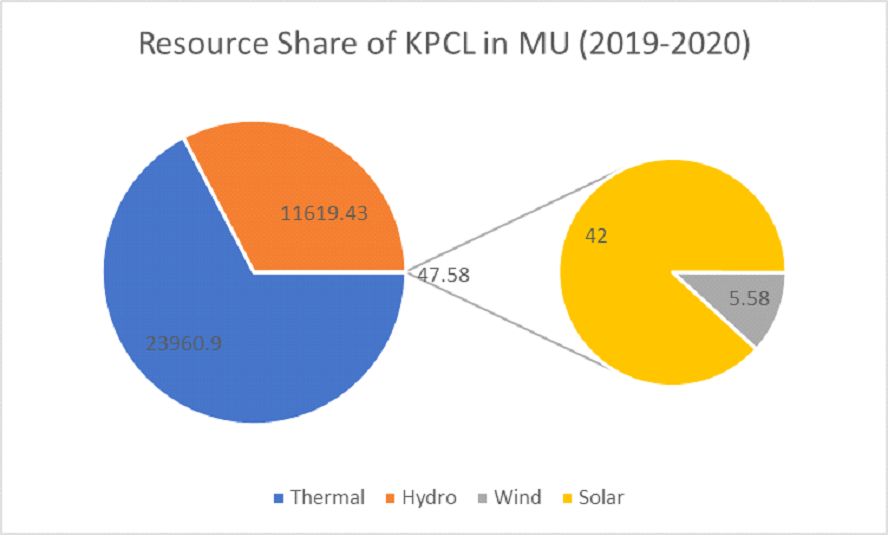
Fig. 4 Resource share of energy generated - Karnataka Power Corporation Ltd (Source:
Karnataka Electricity Regulatory Commission Annual Report 2019-2020)
Figure 4 shows the resource share during 2019-2020 in Karnatak. The highest resource share
is for thermal power plants, and it constitutes 67% of total energy generated in the Karnataka
state. 23960.9 MU
Assessment of progress in the installed capacity of Karnataka power plants
The assessment of the progress in the installed capacity of power plants in Karnataka was
done based on data collected from the Economic Survey Report of Karnataka, and this assessment
helps to assess the annual generation potential of the power plants.
Fig. 5 Progress in Installed Capacity in MW of Karnataka Power Plants (source: Economic
Survey Report of Karnataka)
Fig 5 shows the installed capacity progress of the major power plants in Karnataka state
over the past years as the annual report of economic survey of Karnataka. The installed capacity
of the thermal power plants in Karnataka remained the same over the years, but there is progress
in the installed capacities of some hydroelectric plants such as Nagjhari Power House, Kalmala,
Sirwar, Ganekal, Munirabad Power House, and Solar Photovoltaic plants mainly between the years
2015 to 2019.
Assessment of power generation in Karnataka state
There are many power generation sources in Karnataka, including thermal, hydro, and other
renewables. This study analysis year-wise energy generation from the hydro, thermal solar, and
wind power plants. The graphical analysis shows the yearly progress of power generation from
these power plants.
Table 5 Source-wise energy generation
| Source |
Energy in MU |
| KPCL Thermal |
33303.5 |
| Central Generating Stations |
27268.62 |
| Renewable Energy Sources |
17782.66 |
| KPCL Hydel |
11567.04 |
| Major IPPs |
7522.99 |
| Bundled |
3698.57 |
| Medium Term |
1285.06 |
| Others (TBHES, Jurala) |
183.6 |
| Total |
102612.04 |
Table 5 gives the source-wise energy generation for the financial year 2020. The KPCL
thermal power plants produced 33303.5 MU of energy, which accounted for the significant share of
the state's generated energy.
Energy generation from Hydro Projects
The study analyses the progress in power generation from 21 major hydroelectric power plants
in Karnataka state as per the data from the annual reports of the Karnataka Power Corporation
Limited.
Fig. 6 The energy generation progress (2015-2020) from Hydroelectric Projects (MU) (Source:
KPCL Annual Reports)
Figure 6 shows the variation in the energy generation from different hydroelectric power
plants in Karnataka from 2015-2016 to 2020-2021. There are 21 major hydroelectric projects in
Karnataka, and the most share of hydroelectric power generation was from the SGS project of
Sharavathi river. The SGS project generated its energy during 2019-2020 accounting to 4957MU and
during 2020-2021 energy generated is 4196 MU.
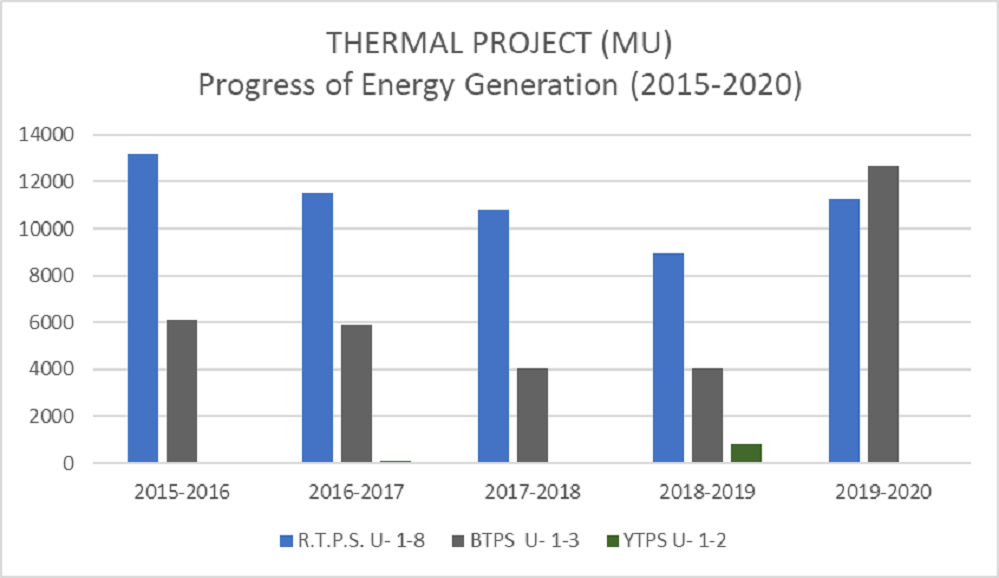
Energy generation from Thermal Projects
The progress in power generation from the three major thermal power plants - Raichur Thermal
Power Plant has 8 units, Bellary Thermal Power Plant has 3 units, and Yermarus Thermal Power
Plant has 2 units.
Fig. 7 The energy generation progress (2015-2020) from Thermal Power Plants (MU)(Source:
KPCL Annual Reports)
Figure 7 shows the progress of power generated from the major coal based thermal power
plants in Karnataka - Raichur Thermal Power Station (RTPS) having 8 units, Bellary Thermal Power
Station (BTPS) having 3 units and Yermarus Thermal Power Station (YTPS) having 2 units.
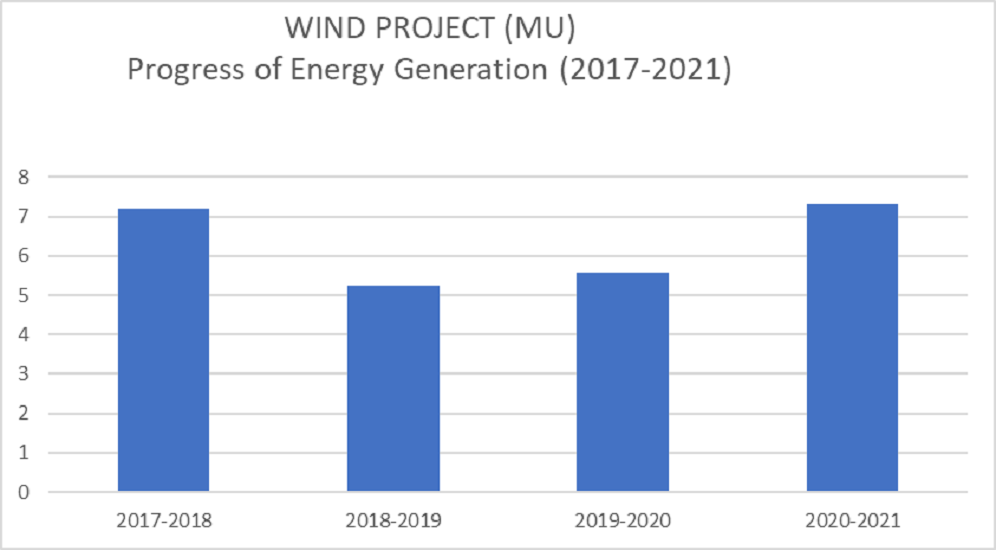
Energy generation from Wind Energy Projects
The study analyses the total power generation from the Karnataka wind farms from the year
2017 to 2021. Figure 8 shows the energy generation progress from wind energy projects in
Karnataka from 2017-2018 to 2020-2021. There 14 wind farms in Karnataka and there was an energy
production of 7.31MU in 2020-2021.
Fig 8. The energy generation progress (2017-2021) from Wind Power Plants (MU) (Source: KPCL
Annual Reports)
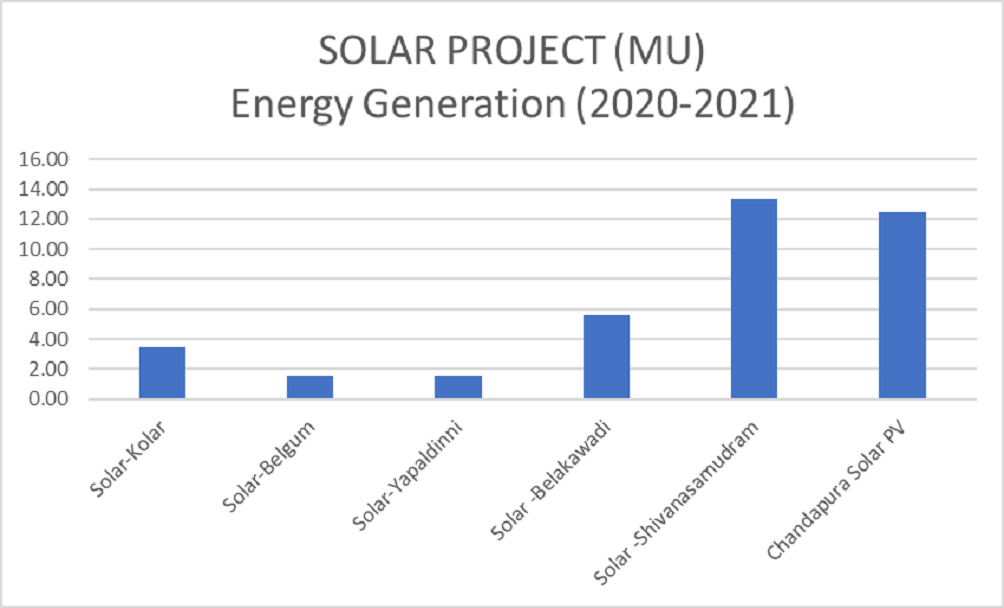
Energy generation from Solar Energy Projects
Karnataka is the second-largest solar potential state after Rajasthan and the first among
India's highest solar energy generating states. This study analyses the overall solar energy
generated in the year 2020 from the major solar projects in Karnataka. Fig 9 shows the
electricity generated from the major solar photovoltaic projects in Karnataka during the
FY2020-2021.
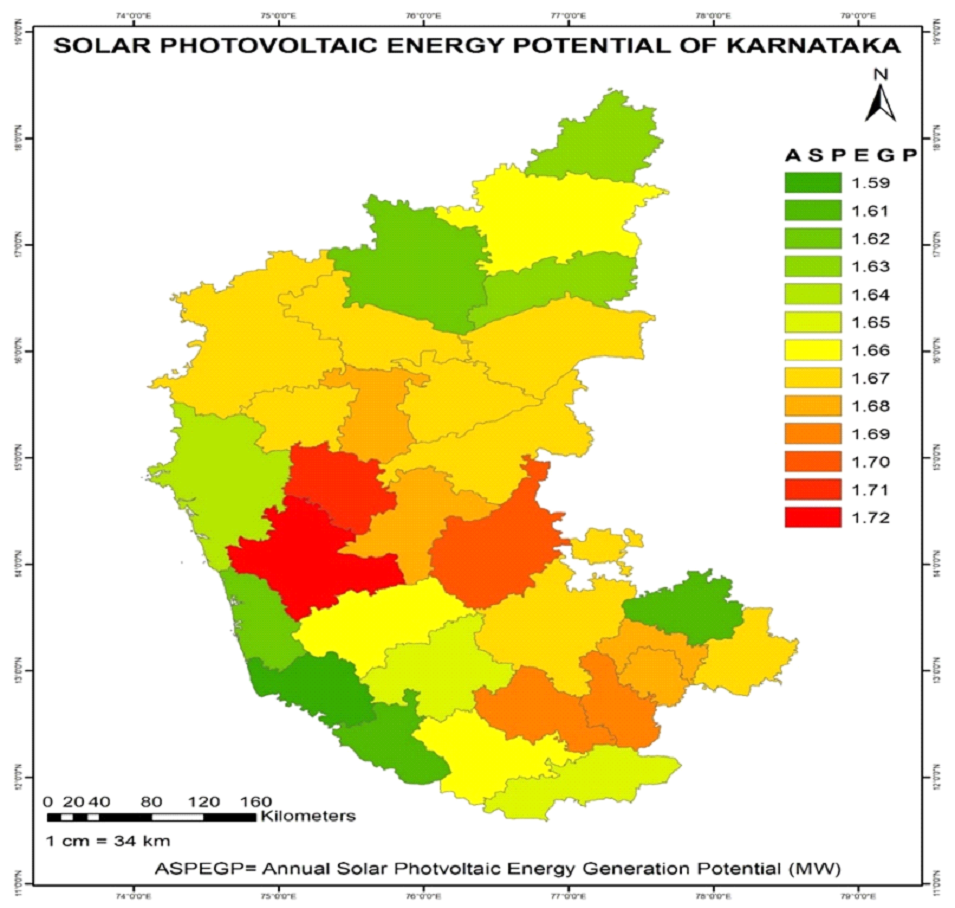
Fig. 9 The energy generation progress (2020-2021) from Solar PV Projects (MU)(Source:
Annual Report of Karnataka Renewable Energy Development Ltd)
The energy demand of Karnataka was studied on the basis of source-wise energy consumption.
The study involved the calculation of the district-wise per capita electricity consumption,
district-wise annual fuelwood consumption, transportation fuel consumption, and coal consumption
in major thermal power plants of Karnataka.
The district-wise per capita electricity consumption from each electricity supply company of
Karnataka is calculated as per the data from the annual reports of each electricity supply
company. The highest annual per capita electricity consumption was calculated in the BESCOM
region with a value of 765.9 kWh per person.
The annual per capita electricity consumption was calculated based on the last census report
of 2011, and so the metered consumption of 2011 was taken into account.
Table 6 lists the annual per capita electricity consumption in Karnataka and BESCOM has the
highest annual per capita electricity consumption among all other electricity supply companies.
Table 6 Per capita electricity consumption in Karnataka
| Electricity Supply Company |
District |
2011 Metered Consumption (MU) |
Population
(2011 Census Data)
|
District-wise Annual Per Capita Electricity Consumption (kWh/person/year) |
ESCOM-wise Annual Per Capita Electricity Consumption (kWh/person) |
| Bangalore Electricity Supply Company Limited (BESCOM) |
Bengaluru Rural |
15675.92 |
990923 |
758.9 |
765.9 |
| Bengaluru Urban |
9621551 |
7368.7 |
| Tumakuru |
2678980 |
2051.7 |
| Kolar |
1536401 |
1176.7 |
| Ramanagara |
1082636 |
829.1 |
| Chikkaballapura |
1255104 |
961.2 |
| Chitra Durga |
1659456 |
1270.9 |
| Davanagere |
1643494 |
1258.7 |
| Total population in BESCOM |
20468545 |
| Mangalore Electricity Supply Company Limited (MESCOM) |
Dakshin Kannada |
3570.21 |
2089649 |
1211.6 |
579.8 |
| Shivamogga |
1752753 |
1016.2 |
| Udupi |
1177361 |
682.6 |
| Chikkamagaluru |
1137961 |
659.8 |
| Total population in MESCOM |
6157724 |
| Hubli Electricity Supply Company Limited (HESCOM) |
Dharwad |
7675.19 |
1847023 |
958.3 |
518.8 |
| Gadag |
1064570 |
552.3 |
| Vijayapura |
2177331 |
1129.7 |
| Bagalkot |
1889752 |
980.5 |
| Uttara Kannada |
1437169 |
745.7 |
| Haveri |
1597668 |
828.9 |
| Belagavi |
4779661 |
2479.8 |
| Total population in HESCOM |
14793174 |
| Gulbarga Electricity Supply Company Ltd. (GESCOM) |
Bellary |
5453.36 |
2754598 |
1304.3 |
473.5 |
| Bidar |
1703300 |
806.5 |
| Kalburgi |
2566326 |
1215.1 |
| Raichur |
1928812 |
913.3 |
| Koppal |
1389920 |
658.1 |
| Yadgir |
1174271 |
556.0 |
| Total population in GESCOM |
11517227 |
| Chamundeshwari Electricity Supply Corporation Limited (CESC) |
Mysuru |
4652.1 |
3001127 |
1711.3 |
570.2 |
| Chamarajanagar |
1020791 |
582.1 |
| Mandya |
1805769 |
1029.7 |
| Hassan |
1776421 |
1012.9 |
| Kodagu |
554519 |
316.2 |
| Total population in CESC |
8158627 |
The annual fuelwood consumption
In this study the district-wise annual fuelwood consumption of Karnataka is calculated based
on the agroclimatic zones listed in Table 8. It shows the agroclimatic zone-wise approximate per
capita fuelwood requirement for cooking and water heating purposes in each district of Karnataka
state. This data was used in the study to calculate the district-wise annual fuelwood
consumption of Karnataka as per the census data of the year 2011 and the projected census data
of the year 2021as given in the table 9 and table 10.The adult equivalent for total population
is calculated from the standard adult equivalent values. The standard adult equivalent is taken
as 1 for male, 0.85 for female and 0.35 for children. Daily fuelwood requirement for cooking
1.88±0.09, water heating 1.07±0.14 and total 2.93±0.22 kgs per person per day
Table 8 Per capita fuelwood consumption in Karnataka
| District |
Agroclimatic Zone |
Per capita fuelwood for
cooking (kg/person/day)
|
Per capita fuelwood for water
heating (kg/person/day)
|
Total fuel per capita (kg/person/day) |
| Belagavi |
North Transition Zone (Dharwad) |
1.85 |
1.02 |
2.87 |
| Bagalkot |
Northern Dry Zone (Vijapur) |
1.85 |
1.02 |
2.87 |
| Vijaya Pura |
Northern Dry Zone (Vijapur) |
1.85 |
1.02 |
2.87 |
| Kalburgi |
North-eastern Dry Zone (Raichur) |
1.85 |
1.02 |
2.87 |
| Raichur |
North-eastern Dry Zone (Raichur) |
1.85 |
1.02 |
2.87 |
| Koppal |
North-eastern Dry Zone (Raichur) |
1.85 |
1.02 |
2.87 |
| Gadag |
Northern Dry Zone (Vijapur) |
1.85 |
1.02 |
2.87 |
| Dharwad |
North Transition Zone (Dharwad) |
1.85 |
1.02 |
2.87 |
| Uttara Kannada |
Hill Zone (Uttara Kannada) |
2.32 |
1.72 |
4.04 |
| Haveri |
North Transition Zone (Dharwad) |
1.85 |
1.02 |
2.87 |
| Bellary |
North-eastern Dry Zone (Raichur) |
1.85 |
1.02 |
2.87 |
| Chitra Durga |
Central Dry Zone (Tumkur) |
1.85 |
1.02 |
2.87 |
| Davanagere |
Central Dry Zone (Tumkur) |
1.85 |
<1.02/td>
| 2.87 |
| Shivamogga |
Southern Transition Zone (Shivamogga) |
1.85 |
1.85 |
2.87 |
| Udupi |
Coastal Zone (Dakshin Kannada) |
2.01 |
1.17 |
3.18 |
| Chikkamagaluru |
Southern Transition Zone (Shivamogga) |
1.85 |
1.02 |
2.87 |
| Tumkur |
Central Dry Zone (Tumkur) |
1.85 |
1.02 |
2.87 |
| Kolar |
Eastern Dry Zone (Bengaluru |
1.85 |
1.02 |
2.87 |
| Bengaluru Urban |
Eastern Dry Zone (Bengaluru) |
1.85 |
1.02 |
2.87 |
| Bengaluru Rural |
Eastern Dry Zone (Bengaluru) |
1.85 |
1.20 |
2.87 |
| Mandya |
Southern Dry Zone (Mysuru) |
1.85 |
1.20 |
2.87 |
| Hassan |
Southern Transition Zone (Shivamogga) |
1.85 |
1.02 |
2.87 |
| Dakshin Kannada |
Coastal Zone (Dakshin Kannada) |
2.01 |
1.17 |
3.18 |
| Kodagu |
Southern Dry Zone (Mysuru) |
1.85 |
1.02 |
2.87 |
| Mysuru |
Southern Dry Zone (Mysuru) |
1.85 |
1.02 |
2.87 |
| Chamarajanagar |
Southern Dry Zone (Mysuru) |
1.85 |
1.02 |
2.87 |
| Chikkaballapura |
Eastern Dry Zone (Bengaluru) |
1.85 |
1.02 |
2.87 |
| Ramanagara |
Eastern Dry Zone (Bengaluru) |
1.85 |
1.02 |
2.87 |
| Yadgir |
North-eastern Dry Zone (Raichur) |
1.85 |
1.02 |
2.87 |
Table 9 Annual fuelwood consumption as per 2011 census data
| District |
Agroclimatic Zone |
Total Male |
Total Female |
Total Children |
Adult equivalent of total population |
Total Fuelwood for a year (kg/year for total population) |
Total fuel in kilo tonne |
| Belagavi |
North Transition Zone (Dharwad) |
2423063 |
2356598 |
626269 |
4645365.5 |
4866252577 |
4866 |
| Bagalkot |
Northern Dry Zone (Vijapur) |
950111 |
939641 |
271908 |
1843973.7 |
1931654597 |
1932 |
| Vijayapura |
Northern Dry Zone (Vijapur) |
1111022 |
1066309 |
318406 |
2128826.8 |
2230052462 |
2230 |
| Kalburgi |
North-eastern Dry Zone (Raichur) |
1301755 |
1264571 |
365372 |
2504520.6 |
2623610502 |
2624 |
| Bidar |
North East Transition Zone (Bidar) |
870665 |
832635 |
224442 |
1656959.5 |
1735747872 |
1736 |
| Raichur |
North-eastern Dry Zone (Raichur) |
964511 |
964301 |
283733 |
1883473.4 |
1973032560 |
1973 |
| Koppal |
North-eastern Dry Zone (Raichur) |
699926 |
689994 |
201654 |
1356999.8 |
1421525140 |
1422 |
| Gadag |
Northern Dry Zone (Vijapur) |
537147 |
527423 |
132442 |
1031811.3 |
1080873875 |
1081 |
| Dharwad |
North Transition Zone (Dharwad) |
937206 |
909817 |
219942 |
1787530.2 |
1872527209 |
1873 |
| Uttara Kannada |
Hill Zone (Uttara Kannada) |
726256 |
710913 |
150115 |
1383072.3 |
2039478414 |
2039 |
| Haveri |
North Transition Zone (Dharwad) |
819128 |
778540 |
195317 |
1549248 |
1622914690 |
1623 |
| Bellary |
North-eastern Dry Zone (Raichur) |
1391243 |
1363355 |
383706 |
2684391.9 |
2812034682 |
2812 |
| Chitra Durga |
Central Dry Zone (Tumkur) |
840843 |
818613 |
184280 |
1601162.1 |
1677297305 |
1677 |
| Davanagere |
Central Dry Zone (Tumkur) |
832111 |
811383 |
178177 |
1584148.5 |
1659474761 |
1659 |
| Shivamogga |
Southern Transition Zone (Shivamogga) |
877415 |
875338 |
182751 |
1685415.2 |
0 |
0 |
| Udupi |
Coastal Zone (Dakshin Kannada) |
562131 |
615230 |
103160 |
1121182.5 |
1301356528 |
1301 |
| Chikkamagaluru |
Southern Transition Zone (Shivamogga) |
566622 |
571339 |
105328 |
1089125 |
1140912841 |
1141 |
| Tumakuru |
Central Dry Zone (Tumkur) |
1350594 |
1328386 |
265742 |
2572731.8 |
2695065197 |
2695 |
| Kolar |
Eastern Dry Zone (Bengaluru) |
776396 |
760005 |
170423 |
1482048.3 |
1552519697 |
1553 |
| Bengaluru Urban |
Eastern Dry Zone (Bengaluru) |
5022661 |
4598890 |
1052837 |
9300210.5 |
9742435457 |
9742 |
| Bengaluru Rural |
Eastern Dry Zone (Bengaluru) |
509172 |
481751 |
107062 |
956132.05 |
1001596129 |
1002 |
| Mandya |
Southern Dry Zone (Mysuru) |
905085 |
900684 |
172685 |
1731106.2 |
1813420247 |
1813 |
| Hassan |
Southern Transition Zone (Shivamogga) |
883667 |
892754 |
165637 |
1700480.9 |
1781338714 |
1781 |
| Dakshin Kannada |
Coastal Zone (Dakshin Kannada) |
1034714 |
1054935 |
208297 |
2004312.7 |
2326405751 |
2326 |
| Kodagu |
Southern Dry Zone (Mysuru) |
274608 |
279911 |
54733 |
531688.9 |
556970707 |
557 |
| Mysuru |
Southern Dry Zone (Mysuru) |
1511600 |
1489527 |
305561/td>
| 2884644.3 |
3021809136 |
3022 |
| Chamarajanagar |
Southern Dry Zone (Mysuru) |
512231 |
508560 |
100648 |
979733.8 |
1026320142 |
1026 |
| Chikkaballapura |
Eastern Dry Zone (Bengaluru) |
636437 |
618667 |
132286 |
1208604.1 |
1266073173 |
1266 |
| Ramanagara |
Eastern Dry Zone (Bengaluru) |
548008 |
534628 |
107841 |
1040186.2 |
1089647001 |
1090 |
| Yadgir |
North-eastern Dry Zone (Raichur) |
590329 |
583942 |
190279 |
1153277.4 |
1208115688 |
1208 |
Table 10 Annual fuelwood consumption as per 2021 projected census data
| District |
Agroclimatic Zone |
Total Male |
Total Female |
Total Children |
Adult equivalent of total population |
Total Fuelwood for a year (kg/year for total population) |
Total fuel in kilo tonne |
| Belagavi |
North Transition Zone (Dharwad) |
2750361 |
2675735 |
628990 |
5244882 |
5.49E+09 |
5494 |
| Bagalkot |
Northern Dry Zone (Vijapur) |
1090736 |
1078716 |
280395 |
2105783 |
2.21E+09 |
2206 |
| Vijayapura |
Northern Dry Zone (Vijapur) |
1343921 |
1281895 |
353632 |
2557303 |
2.68E+09 |
2679 |
| Kalburgi |
North-eastern Dry Zone (Raichur) |
1533039 |
1496802 |
372228 |
2935601 |
3.08E+09 |
3075 |
| Bidar |
North East Transition Zone (Bidar) |
989517 |
946243 |
209023 |
1866982 |
1.96E+09 |
1956 |
| Raichur |
North-eastern Dry Zone (Raichur) |
1126701 |
1098607 |
284504 |
2160093 |
2.26E+09 |
2263 |
| Koppal |
North-eastern Dry Zone (Raichur) |
814047 |
801230 |
195613 |
1563557 |
1.64E+09 |
1638 |
| Gadag |
Northern Dry Zone (Vijapur) |
584911 |
582173 |
127271 |
1124303 |
1.18E+09 |
1178 |
| Dharwad |
North Transition Zone (Dharwad) |
1080497 |
1049431 |
222158 |
2050269 |
2.15E+09 |
2148 |
| Uttara Kannada |
Hill Zone (Uttara Kannada) |
767964 |
758100 |
130203 |
1457920 |
2.15E+09 |
2150 |
| Haveri |
North Transition Zone (Dharwad) |
907107 |
868970 |
187482 |
1711350 |
1.79E+09 |
1793 |
| Bellary |
North-eastern Dry Zone (Raichur) |
1707231 |
1673009 |
374763 |
3260456 |
3.42E+09 |
3415 |
| Chitra Durga |
Central Dry Zone (Tumkur) |
912745 |
905675 |
170793 |
1742346 |
1.83E+09 |
1825 |
| Davanagere |
Central Dry Zone (Tumkur) |
909078 |
885232 |
198212 |
1730899 |
1.81E+09 |
1813 |
| Shivamogga |
Southern Transition Zone (Shivamogga) |
939105 |
936882 |
160835 |
1791747 |
0 |
0 |
| Udupi |
Coastal Zone (Dakshin Kannada) |
642447 |
683606 |
101711 |
1259111 |
1.46E+09 |
1461 |
| Chikkamagaluru |
Southern Transition Zone (Shivamogga) |
559384 |
577558 |
80573 |
1078509 |
1.13E+09 |
1130 |
| Tumakuru |
Central Dry Zone (Tumkur) |
1393572 |
1396777 |
231339 |
2661801 |
2.79E+09 |
2788 |
| Kolar |
Eastern Dry Zone (Bengaluru) |
860842 |
844594 |
157398 |
1633836 |
1.71E+09 |
1712 |
| Bengaluru Urban |
Eastern Dry Zone (Bengaluru) |
7446494 |
6825083 |
1450842 |
13755609 |
1.44E+10 |
14410 |
| Bengaluru Rural |
Eastern Dry Zone (Bengaluru) |
607048 |
560353 |
108175 |
1121209 |
1.17E+09 |
1175 |
| Mandya |
Southern Dry Zone (Mysuru) |
927498 |
922969 |
145816 |
1763057 |
1.+09 |
1847 |
| Hassan |
Southern Transition Zone (Shivamogga) |
920061 |
928569 |
140105 |
1758381 |
1.84E+09 |
1842 |
| Dakshin Kannada |
Coastal Zone (Dakshin Kannada) |
1144246 |
1166607 |
199469 |
2205676 |
2.56E+09 |
2560 |
| Kodagu |
Southern Dry Zone (Mysuru) |
274599 |
286391 |
43134 |
533128.3 |
5.58E+08 |
558 |
| Mysuru |
Southern Dry Zone (Mysuru) |
1730738 |
1707176 |
292509 |
3284216 |
3.44E+09 |
3440 |
| Chamarajanagar |
Southern Dry Zone (Mysuru) |
538322 |
543817 |
88727 |
1031621 |
1.08E+09 |
1081 |
| Chikkaballapura |
Eastern Dry Zone (Bengaluru) |
696740 |
683168 |
118423 |
1318881 |
1.38E+09 |
1382 |
| Ramanagara |
Eastern Dry Zone (Bengaluru) |
577014 |
570719 |
99799 |
1097055 |
1.15E+09 |
1149 |
| Yadgir |
North-eastern Dry Zone (Raichur) |
722924 |
722302 |
204158 |
1408336 |
1.48E+09 |
1475 |
Calculation of the per capita fuel consumption for transportation
The study calculated the per capita fuel consumption in the transportation sector for each
vehicle type based on its fuel, petrol, or diesel and the average mileage. The data of the total
vehicles registered in Karnataka was collected from Karnataka at a glace report. The average
mileage of each vehicle listed in table 11 aids in calculating the total fuel consumption in the
state.
Data are presented in table 12 – transport fuel consumption for the year 2018, table 13 –
transport fuel consumption for the year 2019 and table 6.4.3.3 – transport fuel consumption for
the year 2010 for Karnataka state as a whole as per the registered vehicle data for each year.
Table 11 Transport fuel consumption for the year 2018
| Annual Utilization(km/year) |
Annual distance travelled |
Number of registered vehicles |
Distance Travelled by the total vehicles annually |
Total Fuel consumption (Diesel/Petrol) in litres |
| Buses |
100000 |
243373 |
24337300000 |
5921484185 |
Diesel |
| Omni buses |
100000 |
14965 |
1496500000 |
100033422 |
Petrol |
| Two wheelers |
6300 |
16082941 |
1.01323E+11 |
1688708805 |
Petrol |
| Light Motor Vehicles(passengers) |
33500 |
730661 |
24477143500 |
1330279538 |
Petrol |
|
|
|
|
|
|
| Cars(total) |
12600 |
3378183 |
|
|
|
| cars diesel |
|
2026909 |
25539053400 |
1321213316 |
Diesel |
| cars petrol |
|
1351273 |
17026039800 |
523878148 |
Petrol |
| Taxi |
12600 |
397345 |
5006547000 |
254139442 |
Diesel |
| Trucks & Lorries |
57500 |
448947 |
25814452500 |
3054964793 |
Diesel |
| Light Motor Vehicles(goods) |
63000 |
639464 |
40286232000 |
2055420000 |
Diesel |
| Trailers |
21000 |
300150 |
6303150000 |
1780550847 |
Diesel |
Table 12 Transport fuel consumption for the year 2019
| As on 31.03.2019 |
| Annual Utilization(km/year) |
Annual distance travelled |
Number of registered vehicles |
Distance Travelled for Total vehicles annually |
Fuel consumed (Diesel/Petrol) in litres |
| Buses |
100000 |
254646 |
25464600000 |
6195766423 |
Diesel |
| Omni buses |
100000 |
15541 |
1554100000 |
103883690 |
Petrol |
| Two wheelers |
6300 |
17349311 |
1.09301E+11 |
1821677655 |
Petrol |
| Light Motor Vehicles(passengers) |
33500 |
793911 |
26596018500 |
1445435788 |
Petrol |
| Cars |
12600 |
3576304 |
|
|
|
| cars diesel |
|
2145782 |
27036858240 |
1398699340 |
Diesel |
| cars petrol |
|
1430521 |
18024564600 |
554601988 |
Petrol |
| Taxi |
12600 |
425076 |
5355957600 |
271876020 |
Diesel |
| Trucks & Lorries |
57500 |
469081 |
26972157500 |
3191971302 |
Diesel |
| Light Motor Vehicles(goods) |
63000 |
691122 |
43540686000 |
2221463571 |
Diesel |
| Trailers |
21000 |
308865 |
6486165000 |
1832250000 |
Diesel |
Table 1 Transport fuel consumption for the year 2020
| As on 31.03.2020 |
| Annual Utilization(km/year) |
Annual distance travelled |
Number of registered vehicles |
Distance Travelled for Total vehicles annually |
Fuel consumed (Diesel/Petrol) in litres |
| Buses |
100000 |
263099 |
26309900000 |
6401435523 |
Diesel |
| Omni buses |
100000 |
16112 |
1611200000 |
107700535 |
Petrol |
| Two wheelers |
6300 |
18510282 |
1.16615E+11 |
1943579610 |
Petrol |
| Light Motor Vehicles(passengers) |
33500 |
868807 |
29105034500 |
1581795353 |
Petrol |
| Cars |
12600 |
3756733 |
47334835800 |
1456456486 |
|
| cars diesel |
|
2254039 |
|
|
Diesel |
| cars petrol |
|
1502693 |
|
|
Petrol |
| Taxi |
12600 |
449778 |
5667202800 |
287675269 |
Diesel |
| Trucks & Lorries |
57500 |
485207 |
27899402500 |
3301704438 |
Diesel |
| Light Motor Vehicles(goods) |
63000 |
741259 |
46699317000 |
2382618214 |
Diesel |
| Trailers |
21000 |
321415 |
6749715000 |
1906699153 |
Diesel |
Calculation of the coal consumption by major thermal power plants in Karnataka
In this study, the total amount of coal consumed by the three major power plants in the year
2020 was calculated as per the data from the annual reports of Karnataka Power Corporation
Limited for the year 2020.
Table 14 lists total coal consumption in major thermal power plants in Karnataka like that
of Raichur Thermal Power Plant, Bellary Thermal Power Plant and Yermarus Thermal Power Plant
transport for the year 2020.
Table 14 Coal consumption in thermal power plants for the year 2020
| Coal consumption in major thermal power plants |
| Power Plant |
Installed Capacity in MW |
Specific Coal Consumption(kg/kwh) |
Generation in MU |
Total Coal Consumption in Kg |
Total Coal Consumption in Million Tonne |
| R.T.P.S. U- 1 |
210.00 |
0.688 |
512.00 |
3.5E+08 |
352.3 |
| R.T.P.S. U- 2 |
210.00 |
0.688 |
427.05 |
2.9E+08 |
293.8 |
| R.T.P.S. U- 3 |
210.00 |
0.688 |
302.53 |
2.1E+08 |
208.1 |
| R.T.P.S. U- 4 |
210.00 |
0.688 |
483.80 |
3.3E+08 |
332.9 |
| R.T.P.S. U- 5 |
210.00 |
0.688 |
233.68 |
1.6E+08 |
160.8 |
| R.T.P.S. U- 6 |
210.00 |
0.688 |
521.49 |
3.6E+08 |
358.8 |
| R.T.P.S. U- 7 |
210.00 |
0.688 |
353.83 |
2.4E+08 |
243.4 |
| R.T.P.S. U- 8 |
250.00 |
0.688 |
131.76 |
9.1E+07 |
90.7 |
| RTPS Total |
1720.00 |
|
2966.14 |
|
2040.8 |
| B.T.P.S-U- 1 |
500.00 |
0.645 |
481.68 |
3.1E+08 |
310.7 |
| B.T.P.S-U- 2 |
500.00 |
0.645 |
1090.61 |
7E+08 |
703.4 |
| B.T.P.S-U- 3 |
700.00 |
0.645 |
958.36 |
6.2E+08 |
618.1 |
| BTPS Total |
1700.00 |
|
2530.65 |
|
1632.2 |
| YTPS U-1 |
800.00 |
0.637 |
2609.82 |
1.7E+09 |
1662.5 |
| YTPS U-2 |
800.00 |
0.637 |
317.15 |
2E+08 |
202.0 |
| YTPS Total |
1600.00 |
|
2926.96 |
|
1864.5 |
Bioresource availability in Karnataka - Calculation of district-wise biogas yield
Bioresources in Karnataka include agricultural residues, horticultural residues, and animal
residues. Biogas is one such bioresource available in the state. This study analyses the biogas
potential of Karnataka state by calculating the district-wise biogas yield based on the latest
livestock census report of 2017(provisional). Table 15 shows approximate breed-wise dung yield
as well as the per capita biogas yield of livestock along with its energy value which was used
to calculate the district-wise biogas yield as per the 2017 livestock census of Karnataka
The study analyses division-wise district biogas potential of Karnataka state. Karnataka has
four administrative divisions, namely the Bengaluru division, Belagavi division, Kalburgi
division, and Mysuru division. The calculation of breed-wise dung yield for each type of
livestock in the state was done, thus giving the overall potential of biogas availability in
Karnataka.
agalkot district has the highest annual biogas yield in Karnataka. Table 15 lists biogas
yield from cattle dung, table 16 provides biogas yield from buffalo dung, table 17 – biogas
yield from sheep, table 18 – biogas yield from goat.
Table 15 Annual biogas yield from cattle as per 2017 livestock census
| CATTLE |
| Division |
District |
TOTAL CATTLE |
Annual dung yield(kg/year) for Total population |
Annual Biogas yield (m3) |
| Belgaum Division |
Belagavi |
222823 |
426984574 |
16652398.38 |
| Bagalkot |
549540 |
1.053E+09 |
41069184.98 |
| Vijayapura |
202111 |
387295204 |
15104512.95 |
| Dharwad |
172219 |
330014659 |
12870571.69 |
| Gadag |
136311 |
261205954 |
10187032.2 |
| Haveri |
261060 |
500256225 |
19509992.78 |
| Uttara Kannada |
336312 |
644457870 |
25133856.93 |
| Bangalore Division |
Shimoga |
518653 |
993868811 |
38760883.64 |
| Bangalore Rural |
170722 |
327146033 |
12758695.27 |
| Ramanagaram |
287502 |
550925708 |
21486102.59 |
| Chikkaballapur |
213815 |
409722994 |
15979196.76 |
| Chitra Durga |
225603 |
432311749 |
16860158.2 |
| Davanagere |
237801 |
455686166 |
17771760.48 |
| Kolar |
209642 |
401726483 |
15667332.82 |
| Bangalore Urban |
153861 |
294836141 |
11498609.51 |
| Tumkur |
431251 |
826384729 |
32229004.42 |
| Gulbarga Division |
Bellary |
343275 |
657800719 |
25654228.03 |
| Bidar |
173634 |
332726153 |
12976319.95 |
| Gulbarga |
385580 |
738867675 |
28815839.33 |
| Koppal |
231413 |
443445161 |
17294361.29 |
| Raichur |
245374 |
470197928 |
18337719.17 |
| Yadagiri |
233336 |
447130110 |
17438074.29 |
| Chamarajanagar |
249361 |
477838016 |
18635682.63 |
| Mysore Division |
Chikmagalur |
290007 |
555725914 |
21673310.64 |
| Dakshin Kannada |
250569 |
480152846 |
18725961 |
| Hassan |
548185 |
1.05E+09 |
40967920.74 |
| Kodagu |
71684 |
137364465 |
5357214.135 |
| Mandya |
369986 |
708985673 |
27650441.23 |
| Mysore |
492598 |
943940918 |
36813695.78 |
| Udupi |
254776 |
488214510 |
19040365.89 |
Table 16 Annual biogas yield from buffalo as per 2017 livestock census
| BUFFALO |
| Division |
District |
TOTAL BUFFALO |
Annual dung yield(kg/year) for Total population |
Annual Biogas yield (m3) |
| Belgaum Division |
Belagavi |
234340 |
1.155E+09 |
45033703.65 |
| Bagalkot |
844171 |
4.16E+09 |
162226451.5 |
| Vijayapura |
177079 |
872556773 |
34029714.13 |
| Dharwad |
61245 |
301784738 |
11769604.76 |
| Gadag |
55798 |
274944645 |
10722841.16 |
| Haveri |
85501 |
421306178 |
16430940.92 |
| Uttara Kannada |
73993 |
364600508 |
14219419.79 |
| Bangalore Division |
Shimoga |
120563 |
594074183 |
23168893.12 |
| Bangalore Rural |
16924 |
83393010 |
3252327.39 |
| Ramanagaram |
19644 |
96795810 |
3775036.59 |
| Chikkaballapur |
26397 |
130071218 |
5072777.483 |
| Chitra Durga |
113304 |
558305460 |
21773912.94 |
| Davanagere |
91896 |
452817540 |
17659884.06 |
| Kolar |
26520 |
130677300 |
5096414.7 |
| Bangalore Urban |
11168 |
55030320 |
2146182.48 |
| Tumkur |
142047 |
699936593 |
27297527.11 |
| Gulbarga Division |
Bellary |
159107 |
783999743 |
30575989.96 |
| Bidar |
125510 |
618450525 |
24119570.48 |
| Gulbarga |
73176 |
360574740 |
14062414.86 |
| Koppal |
63467 |
312733643 |
12196612.06 |
| Raichur |
112420 |
553949550 |
21604032.45 |
| Yadagiri |
57438 |
283025745 |
11038004.06 |
| Chamarajanagar |
9918 |
48870945 |
1905966.855 |
| Mysore Division |
Chikmagalur |
113304 |
558305460 |
21773912.94 |
| Dakshin Kannada |
1832 |
9027180 |
352060.02 |
| Hassan |
107971 |
532027103 |
20749057 |
| Kodagu |
5236 |
25800390 |
1006215.21 |
| Mandya |
109443 |
539280383 |
21031934.92 |
| Mysore |
21682 |
106838055 |
4166684.145 |
| Udupi |
2408 |
11865420 |
462751.38 |
Table 17 Annual biogas yield from sheep as per 2017 livestock census
SHEEP
| SHEEP |
| Division |
District |
TOTAL SHEEP |
Annual dung yield(kg/year) for Total population |
Annual Biogas yield (m3) |
| Belgaum Division |
Belagavi |
622856 |
22734244 |
886635.516 |
| Bagalkot |
757679 |
27655284 |
1078556.057 |
| Vijayapura |
347070 |
12668055 |
494054.145 |
| Dharwad |
79869 |
2915218.5 |
113693.5215 |
| Gadag |
395899 |
14450314 |
563562.2265 |
| Haveri |
313205 |
11431983 |
445847.3175 |
| Uttara Kannada |
8537 |
311600.5 |
12152.4195 |
| Bangalore Division |
Shimoga |
42526 |
1552199 |
60535.761 |
| Bangalore Rural |
118788 |
4335762 |
169094.718 |
| Ramanagaram |
127988 |
4671562 |
182190.918 |
| Chikkaballapur |
613193 |
22381545 |
872880.2355 |
| Chitra Durga |
1352087 |
49351176 |
1924695.845 |
| Davanagere |
238367 |
8700395.5 |
339315.4245 |
| Kolar |
483892 |
17662058 |
688820.262 |
| Bangalore Urban |
82873 |
3024864.5 |
117969.7155 |
| Tumkur |
1290008 |
47085292 |
1836326.388 |
| Gulbarga Division |
Bellary |
1272828 |
46458222 |
1811870.658 |
| Bidar |
85948 |
3137102 |
122346.978 |
| Gulbarga |
112387 |
4102125.5 |
159982.8945 |
| Koppal |
625367 |
22825896 |
890209.9245 |
| Raichur |
657633 |
24003605 |
936140.5755 |
| Yadagiri |
437092 |
15953858 |
622200.462 |
| Chamarajanagar |
135321 |
4939216.5 |
192629.4435 |
| Mysore Division |
Chikmagalur |
1352087 |
49351176 |
1924695.845 |
| Dakshin Kannada |
289 |
10548.5 |
411.3915 |
| Hassan |
199387 |
7277625.5 |
283827.3945 |
| Kodagu |
650 |
23725 |
925.275 |
| Mandya |
347133 |
12670355 |
494143.8255 |
| Mysore |
203463 |
7426399.5 |
289629.5805 |
| Udupi |
431 |
15731.5 |
613.5285 |
Table 18. Annual biogas yield from goat as per 2017 livestock census
| GOAT |
| Division |
District |
TOTAL GOAT |
Annual dung yield(kg/year) for Total population |
Annual Biogas yield (m3) |
| Belgaum Division |
Belagavi |
383926 |
14013299 |
546518.661 |
| Bagalkot |
95156 |
3473194 |
135454.566 |
| Vijayapura |
569098 |
20772077 |
810111.003 |
| Dharwad |
74069 |
2703518.5 |
105437.2215 |
| Gadag |
191656 |
6995444 |
272822.316 |
| Haveri |
144969 |
5291368.5 |
206363.3715 |
| Uttara Kannada |
10655 |
388907.5 |
15167.3925 |
| Bangalore Division |
Shimoga |
59719 |
2179743.5 |
85009.9965 |
| Bangalore Rural |
95156 |
3473194 |
135454.566 |
| Ramanagaram |
150130 |
5479745 |
213710.055 |
| Chikkaballapur |
188392 |
6876308 |
268176.012 |
| Chitra Durga |
385058 |
14054617 |
548130.063 |
| Davanagere |
79429 |
2899158.5 |
113067.1815 |
| Kolar |
93713 |
3420524.5 |
133400.4555 |
| Bangalore Urban |
62464 |
2279936 |
88917.504 |
| Tumkur |
427926 |
15619299 |
609152.661 |
| Gulbarga Division |
Bellary |
298232 |
10885468 |
424533.252 |
| Bidar |
182854 |
6674171 |
260292.669 |
| Gulbarga |
446200 |
16286300 |
635165.7 |
| Koppal |
172578 |
6299097 |
245664.783 |
| Raichur |
282718 |
10319207 |
402449.073 |
| Yadagiri |
256848 |
9374952 |
365623.128 |
| Chamarajanagar |
144633 |
5279104.5 |
205885.0755 |
| Mysore Division |
Chikmagalur |
385058 |
14054617 |
548130.063 |
| Dakshin Kannada |
32215 |
1175847.5 |
45858.0525 |
| Hassan |
129058 |
4710617 |
183714.063 |
| Kodagu |
7603 |
277509.5 |
10822.8705 |
| Mandya |
346430 |
12644695 |
493143.105 |
| Mysore |
208206 |
7599519 |
296381.241 |
| Udupi |
2676 |
97674 |
3809.286 |
The renewable energy prospects in Karnataka state
This study analysed the solar and wind energy potential of the state by assessing the
season-wise annual generation potential.
Table 19 provides the season-wise solar irradiation in Karnataka for each district. Table 20
lists the season-wise wind velocity in each district for analyzing the state's wind energy
potential. Figure 6.6 shows the map of the district-wise solar potential of Karnataka state
based on the annual irradiation received.
Table 19 Solar insolation in Karnataka (kWh/m2)
| Division |
District |
In Summer |
In Monsoon |
In Winter |
| Belgaum Division |
Belagavi |
6.02 |
4.335 |
4.25 |
| Bagalkot |
5.545 |
4.335 |
4.25 |
| Vijaya Pura |
5.545 |
4.335 |
4.25 |
| Dharwad |
5.05 |
5.13 |
5.165 |
| Gadag |
6.02 |
4.335 |
4.83 |
| Haveri |
5.545 |
5.13 |
5.165 |
| Uttara Kannada |
6.35 |
4.31 |
5.585 |
| Bangalore Division |
Shivamogga |
6.14 |
4.635 |
5.165 |
| Bangalore Rural |
5.05 |
5.13 |
4.96 |
| Ramanagaram |
5.05 |
5.13 |
4.25 |
| Chikkaballapur |
6.35 |
5.13 |
5.585 |
| Chitra Durga |
6.02 |
4.31 |
4.96 |
| Davanagere |
5.05 |
5.13 |
5.165 |
| Kolar |
6.35 |
4.635 |
4.96 |
| Bangalore Urban |
5.05 |
4.635 |
4.96 |
| Tumkur |
6.35 |
5.13 |
5.585 |
| Gulbarga Division |
Bellary |
6.02 |
4.335 |
4.83 |
| Bidar |
5.545 |
4.335 |
4.25 |
| Gulbarga |
5.545 |
4.335 |
4.83 |
| Koppal |
6.02 |
5.13 |
5.165 |
| Raichur |
6.02 |
4.335 |
4.83 |
| Yadgiri |
5.545 |
4.335 |
4.83 |
| Chamarajanagar |
5.545 |
4.635 |
4.25 |
| Mysore Division |
Chikmagalur |
6.14 |
4.335 |
4.83 |
| Dakshin Kannada |
6.14 |
3.875 |
5.165 |
| Hassan |
6.02 |
4.635 |
5.165 |
| Kodagu |
5.05 |
3.875 |
4.96 |
| Mandya |
5.05 |
3.875 |
4.25 |
| Mysore |
5.545 |
3.875 |
4.25 |
| Udupi |
6.14 |
4.335 |
5.585 |
Fig. 10 Solar PV Energy Potential
| Division |
District |
in Summer |
in Winter |
in Monsoon |
| Belgaum Division |
Belagavi |
5.415 |
6.53 |
5.13 |
| Bagalkot |
1.8 |
3.61 |
0.8 |
| Vijaya Pura |
1.8 |
3.61 |
0.8 |
| Dharwad |
5.415 |
6.53 |
5.13 |
| Gadag |
3.61 |
3.61 |
2.28 |
| Haveri |
2.28 |
3.61 |
1.8 |
| Uttara Kannada |
3.61 |
3.61 |
0.8 |
| Bangalore Division |
Shivamogga |
0.8 |
0.8 |
0.8 |
| Bangalore Rural |
2.28 |
3.61 |
1.8 |
| Ramanagaram |
2.28 |
1.8 |
1.8 |
| Chikkaballapur |
1.8 |
6.53 |
1.8 |
| Chitra Durga |
2.28 |
6.53 |
1.8 |
| Davanagere |
1.8 |
3.61 |
0.8 |
| Kolar |
1.8 |
3.61 |
1.8 |
| Bangalore Urban |
2.28 |
3.61 |
1.8 |
| Tumkur |
1.8 |
6.53 |
1.8 |
| Gulbarga Division |
Bellary |
1.8 |
3.61 |
0.8 |
| Bidar |
3.61 |
3.61 |
2.28 |
| Gulbarga |
3.61 |
3.61 |
3.61 |
| Koppal |
3.61 |
3.61 |
2.28 |
| Raichur |
3.61 |
3.61 |
3.61 |
| Yadagiri |
3.61/td>
| 3.61 |
3.61 |
| Chamarajanagar |
0.8 |
3.61 |
1.8 |
| Mysore Division |
Chikmagalur |
1.8 |
3.61 |
0.8 |
| Dakshin Kannada |
1.8 |
1.8 |
0.8 |
| Hassan |
1.8 |
3.61 |
5.13 |
| Kodagu |
1.8 |
3.61 |
1.8 |
| Mandya |
0.8 |
1.8 |
3.61 |
| Mysore |
3.61 |
3.61 |
3.61 |
| Udupi |
1.8 |
2.29 |
0.8 |