|
|
CES Technical Report 133, August 2013 |
WATERSCAPE OF KERALA: CHARACTERISATION OF SURFACE, WELL AND TAP WATER IN ALL DISTRICTS |
RESULTS AND DISCUSSION
Faecal Coliform Bacteria |
Coliform bacteria include a wide range of aerobic and facultative anaerobic, Gram-negative, non-spore-forming bacilli capable of growing in the presence of relatively high concentrations of bile salts with the fermentation of lactose and production of acid or aldehyde within 24 h at 35–37 °C. Escherichia coli and thermotolerant coliforms are a subset of the total coliform group that can ferment lactose at higher temperatures. As part of lactose fermentation, total coliforms produce the enzyme b-galactosidase. Traditionally, coliform bacteria were regarded as belonging to the genera Escherichia, Citrobacter, Klebsiella and Enterobacter, but the group is more heterogeneous and includes a wider range of genera, such as Serratia and Hafnia. The total coliform group includes both Faecal and environmental species.
By testing for coliforms, especially the well known E.coli, which is a thermotolerant coliform, one can determine if the water has probably been exposed to faecal contamination; that is, whether it has come in contact with human or animal faeces. It is important to know this because many disease-causing organisms are transferred from human and animal faeces to water, from where they can be ingested by people and infect them. |
Effects on Environment and Human Health
Total coliforms should be absent immediately after disinfection, and the presence of these organisms indicates inadequate treatment. The presence of total coliforms in distribution systems and stored water supplies reveal regrowth and possible biofilm formation or contamination through ingress of foreign material, including soil or plants.
Large quantities of Faecal coliform bacteria in water may indicate a higher risk of pathogens being present in the water. Some waterborne pathogenic diseases include ear infections, dysentery, typhoid fever, viral and bacterial gastroenteritis, and hepatitis A. The presence of faecal coliform tends to affect humans more than it does aquatic creatures, though not exclusively. |
Remedial Measures
Faecal coliform, like other bacteria, can usually be killed by boiling water or by treating with chlorine. Washing thoroughly with soap after contact with contaminated water can also help prevent infections. Municipalities that maintain a public water supply should monitor and treat for Faecal coliforms. |
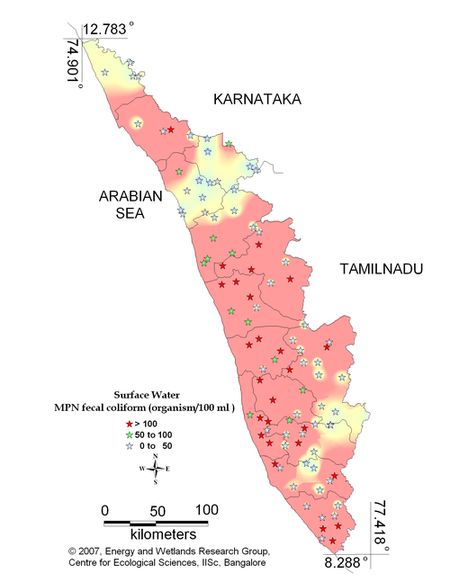
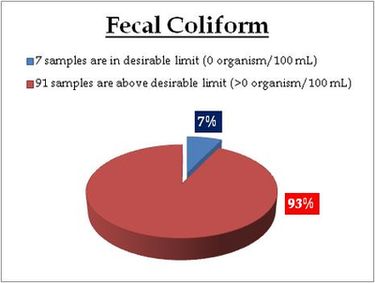
Figure 9.1: Spatial distribution of Faecal Coliform Bacteria in Kerala surface water
Surface water – Faecal Coliform |
For water entering a distribution system
- Coliform count in any sample of 100 ml should be zero (0).
For water in a distribution system –
- E coli count in 100 ml of any sample must be zero (0).
- Coliform organisms should not be more than 10 per 100 ml in any sample.
- Coliform organisms should not be present in 100 ml of any two consecutive samples or more than 5% of the samples collected for the year.
|
|
Remarks
Sampling sites above desirable limit (organism/100ml) are listed districtwise in Table 10.1 and the same is shown spatially in Figure 9.1
Table 10.1: Locations of Faecal Coliform Bacteria above desirable limit
| Location |
Value |
District |
| Kallana aru |
2 |
Kollam |
| Lekkidi-Vythri |
2 |
Wayanad |
| Mukkadavu |
2 |
Kollam |
| Munnar (8th mile) |
2 |
Idukki |
| Perumpara Estate |
2 |
Thirssur |
| Pidavoor |
2 |
Kollam |
| Tirunelli |
2 |
Wayanad |
| Vellayan |
2 |
Tiruvanthapuram |
| Annakkayathumoola |
4 |
Tiruvanthapuram |
| Kalar River |
4 |
Kollam |
| Muthanga |
4 |
Wayanad |
| Muthappankolli |
4 |
Wayanad |
| Neduvannor Kadavu |
4 |
Kollam |
| Pandalam |
4 |
Pathinamthita |
| Thamarakulam lake |
4 |
Kozhikode |
| Thommankuthu-Kaliyar |
4 |
Idukki |
| Valikulam-Palapilly |
4 |
Thirssur |
| Malampuzha |
6 |
Palakkad |
| Moonnukalunkutodu |
6 |
Idukki |
| Munddari |
6 |
Malappuram |
| Pazhayidam |
6 |
Kollam |
| Pambala-lower Periyar |
7 |
Idukki |
| Azhuta River |
8 |
Kottayam |
| Pamba-Aratukadavu |
8 |
Pathinamthita |
| Chenkulathukavu |
9 |
Kottayam |
| Koodathi |
9 |
Kozhikode |
| Alathur |
11 |
Palakkad |
| Nilambur-Chaliyar |
11 |
Malappuram |
| Panathur |
11 |
Kasarkod |
| Aranmula Sathrakadavu |
12 |
Pathinamthita |
| Cheruthoni |
12 |
Idukki |
| Jalsoor |
12 |
Kasarkod |
| Kakkad |
12 |
Ernakulam |
| Vallakadavu |
12 |
Idukki |
| Achankoil River |
14 |
Pathinamthita |
| Karimbam-Taliparamba |
17 |
Kannur |
| Kuttampuzha |
17 |
Idukki |
| Pamba-Njunungar |
17 |
Pathinamthita |
| Puthalam |
17 |
Malapuram |
| Sabrimala-Pamba |
21 |
Pathinamthita |
| Thannimoodu - Kallar |
21 |
Idukki |
| Mananchira lake |
22 |
Kozhikode |
| Bavikara-Chandragiripuzha |
23 |
Kasarkod |
| Ellukachi-Karike |
26 |
Kasarkod |
| Pookod Lake |
26 |
Wayanad |
| Azhuta River-Idukki |
27 |
Idukki |
| Manjappalam |
27 |
Kozhikode |
| Avananvancherri |
33 |
Tiruvanthapuram |
| Chenkulam |
33 |
Kollam |
| Nedumangadu |
33 |
Thiruvananthapuram |
| Sasthamkotta Lake |
33 |
Kollam |
| Koolimadu |
34 |
Kozhikode |
| Ezhuvathruthy-Nariooarambu |
50 |
Malappuram |
| Muvathupuzha |
50 |
Ernakulam |
| Pallipadi |
50 |
Malapuram |
| Karuvannurpuzha |
60 |
Malappuram |
| Kudapuzha |
60 |
Thirssur |
| Kulathurmozhi |
60 |
Kottayam |
| Kuppapuram |
60 |
Alapuzha |
| Malapuram-Chamakayam |
60 |
Malapuram |
| Marakadavu |
60 |
Wyanad |
| Vadakara-Koorangottukatavu |
60 |
Kozhikode |
| Kattupara |
80 |
Malapuram |
| Adukkam |
90 |
Kottayam |
| Cherananllur |
110 |
Thirssur |
| Kavalam-Kuttanadu |
110 |
Alapuzha |
| Nallathanni |
110 |
Idukki |
| Vettikattumukku |
110 |
Kottayam |
| Wadakancheery |
110 |
Thirssur |
| Kallarakadvu |
140 |
Pathinamthita |
| Kandiyoor |
140 |
Alappuzha |
| Malumelkadavu |
140 |
Kollam |
| Veeyapuram |
140 |
Alappuzha |
| Athikayam |
170 |
Pathinamthita |
| Kaladi |
170 |
Ernakulam |
| Kalikadu |
170 |
Tiruvanthapuram |
| Kothamangalam-Kozhipalli |
170 |
Ernakulam |
| Kundamankadavu |
170 |
Thiruvananthapuram |
| Ottapalam |
280 |
Palakkad |
| Thirthala |
280 |
Palakkad |
| Peechi Dam |
300 |
Thirssur |
| Kazhuthruthy |
350 |
Kollam |
| Poovathummuddu |
350 |
Kottayam |
| Puzhapalam - Chitturpuzha |
350 |
Palakkad |
| Thodupuzha |
500 |
Idukki |
| Changanacherry |
900 |
Kottayam |
| Irriti |
900 |
Kannur |
| Mannarkad-Kunthipuzha |
900 |
Palakkad |
| Munnar - Marayyr Rd |
900 |
Idukki |
| Aluva |
1600 |
Ernakulam |
| Neyyar |
1600 |
Thiruvananthapuram |
|
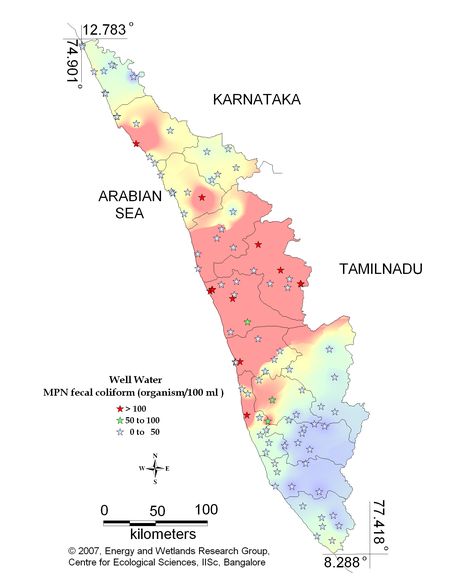
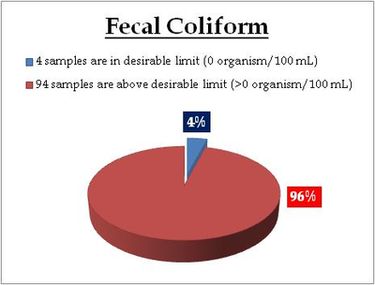
Figure 9.2: Spatial distribution of Faecal Coliform Bacteria in Kerala well water
Well water – Coliform (MPN) |
For water entering a distribution system
- Coliform count in any sample of 100 ml should be zero (0).
For water in a distribution system –
- E coli count in 100 ml of any sample must be zero (0).
- Coliform organisms should not be more than 10 per 100 ml in any sample.
Coliform organisms should not be present in 100 ml of any two consecutive samples or more than 5% of the samples collected for the year. |
|
Remarks
Sampling sites above desirable are listed districtwise in Table 10.2
Table 10.2: Locations of Faecal Coliform Bacteria above desirable limit
| Location |
Value |
District |
| Athikayam |
2 |
Pathinamthita |
| Boundermukku |
2 |
Thiruvananthapuram |
| Kallarakadvu |
2 |
Pathinamthita |
| Kallely Check Post |
2 |
Pathinamthita |
| Neyyar Dam |
2 |
Thiruvananthapuram |
| Pampa Valley |
2 |
Pathinamthita |
| Pazhayidam |
2 |
Kottayam |
| Pidavoor |
2 |
Kollam |
| Vadaserikara |
2 |
Pathinamthita |
| Vaithiri |
2 |
Wayanad |
| Bengathadka |
4 |
Kasaragod |
| Bovikanam |
4 |
Kasaragod |
| Chenkulathukavu |
4 |
Kottayam |
| Manjeri |
4 |
Malappuram |
| Nilambur |
4 |
Malappuram |
| Onakkoor-Piravam |
4 |
Ernakulam |
| Kattachal |
6 |
Kollam |
| Kochupilammood |
6 |
Kollam |
| Kulathurmozhi |
6 |
Kottayam |
| Old Munnar |
6 |
Idukki |
| Vallakadavu |
6 |
Idukki |
| Avananvancherri |
7 |
Thiruvananthapuram |
| Peeramedu |
7 |
Idukki |
| Thannimoodu |
7 |
Idukki |
| Kandiyoor |
9 |
Alapuzha |
| Kayamkulam |
9 |
Alapuzha |
| Nedumangadu |
9 |
Thiruvananthapuram |
| Veeyapuram |
9 |
Alapuzha |
| Thiruvallam |
11 |
Thiruvananthapuram |
| Adhur |
12 |
Kasaragod |
| Kallummoottilkadavu |
12 |
Kollam |
| Kanhangad |
12 |
Kasaragod |
| Kothamangalam |
12 |
Ernakulam |
| Mattancherry |
12 |
Ernakulam |
| Muvathupuzha |
12 |
Ernakulam |
| Payyanoor |
12 |
Kannur |
| Thalassery |
12 |
Kannur |
| Chatakadavu |
13 |
Wayanad |
| Alathoor -WYD |
14 |
Wayanad |
| Alathur |
14 |
palakkad |
| Kulasekaram |
14 |
Thiruvananthapuram |
| Malumelkadavu |
14 |
Kollam |
| Tirur |
14 |
Malappuram |
| Aaviyal |
17 |
Kasaragod |
| Hosabettu - Manjeshwar |
17 |
Kasaragod |
| Kottooli |
17 |
Kozhikode |
| Koyilandy-Kothamangalam |
17 |
Kozhikode |
| Thodupuzha |
17 |
Idukki |
| Adukkam |
22 |
Kottayam |
| Irriti |
22 |
Kannur |
| Mahe |
22 |
Puduchery |
| Neyyathinkara |
22 |
Thiruvananthapuram |
| Poorot |
22 |
Kasaragod |
| Karimbam-Taliparamba |
23 |
Kasaragod |
| Ponnani |
23 |
Malappuram |
| Kalikulam Junction |
26 |
Alapuzha |
| Kavalam |
26 |
Alapuzha |
| Kollengode |
26 |
palakkad |
| Koodungalur |
26 |
Thrissur |
| Koyilandy |
26 |
Kozhikode |
| Puzhapalam |
26 |
palakkad |
| Sulthan Bathery |
26 |
Wayanad |
| Thrissur |
26 |
Thrissur |
| Vettakkal Junction |
26 |
Alapuzha |
| Wadakancheery |
26 |
Thrissur |
| Koyilandy |
27 |
Kozhikode |
| Vettikattumukku |
27 |
Kottayam |
| Balusserry - Vaikundam |
30 |
Kozhikode |
| Kaladi |
30 |
Ernakulam |
| Malappuram-Kottakunne |
30 |
Malappuram |
| Vadakara |
30 |
Kozhikode |
| Chemnad |
33 |
Kasaragod |
| Cherananllur |
33 |
Thrissur |
| Kalpetta - Rattakoli |
33 |
Wayanad |
| Ottapalam |
34 |
palakkad |
| Perinthalmanna |
34 |
Malappuram |
| Payyanoor |
40 |
Kasaragod |
| Chalakudy |
50 |
Thrissur |
| Poovathummuddu |
50 |
Kottayam |
| Thuruthelpalam |
80 |
Kottayam |
| Guruvayoor |
110 |
Thrissur |
| Kannimari |
110 |
palakkad |
| Karingalmanna |
110 |
Kozhikode |
| Placimada |
110 |
palakkad |
| Mullackal-Azhapuzha |
140 |
Alapuzha |
| Guruvayoor1 |
240 |
Thrissur |
| Kannur |
280 |
Kannur |
| Chavakkad |
300 |
Thissur |
| Thondikulam Agraharam |
350 |
palakkad |
| Ernakulam |
500 |
Ernakulam |
| Fort Cochin |
500 |
Ernakulam |
| Mannarkkad |
500 |
palakkad |
| Aluva |
900 |
Ernakulam |
| Thrissur |
>1600 |
Thrissur |
|
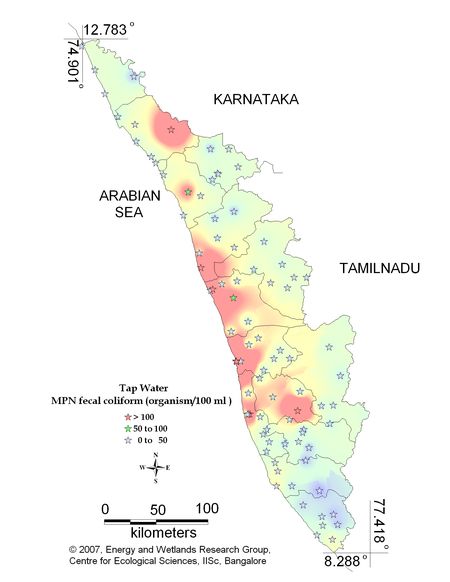
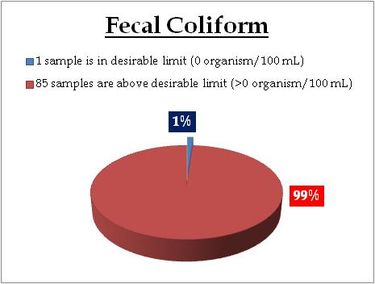
Figure 9.3: Spatial distribution of Faecal Coliform Bacteria in Kerala tap water
Tap water –Coliform (MPN) |
For water entering a distribution system
- Coliform count in any sample of 100 ml should be zero (0).
For water in a distribution system –
- E coli count in 100 ml of any sample must be zero (0).
- Coliform organisms should not be more than 10 per 100 ml in any sample.
Coliform organisms should not be present in 100 ml of any two consecutive samples or more than 5% of the samples collected for the year. |
|
Remarks
Sampling sites above desirable limit (organism/100ml) are listed districtwise in Table 10.3
Table 10.3: Locations of Faecal Coliform Bacteria above desirable limit
| Location |
Value |
District |
| Adithippuzha |
2 |
Pathinamthita |
| Boundermukku |
2 |
Thiruvananthapuram |
| Kalikadu |
2 |
Thiruvananthapuram |
| Kallely |
2 |
Pathinamthita |
| Pandalam |
2 |
Kasaragod |
| Pathanapuram pump house |
2 |
Kottayam |
| Vadaserikara |
2 |
Pathinamthita |
| Kakkad |
4 |
Ernakulam |
| Kilikkallungal |
4 |
Malapuram |
| Kondayangadi-Mananthavadi |
4 |
Wayanad |
| Nilambur |
4 |
Malapuram |
| Ponathur |
4 |
Kasaragod |
| Vaithiri |
4 |
Wayanad |
| Avananvancherri |
6 |
Thiruvananthapuram |
| Chenkulathukavu |
6 |
Kottayam |
| Kavalam-Kuttanadu |
6 |
Alappuzha |
| Kummallor |
6 |
Kollam |
| Nedumangadu |
6 |
Thiruvananthapuram |
| Pamba-Triveni |
6 |
Pathinamthita |
| Pazhavangadi Jn-Aazhapuzha |
6 |
Kannur |
| Nedumkandam |
7 |
Thiruvananthapuram |
| Peeramedu |
7 |
Alappuzha |
| Akathethara |
9 |
Palakkad |
| Kandiyoor |
9 |
Alappuzha |
| Kayamkulam |
9 |
Alappuzha |
| Payyanoor |
9 |
Pathinamthita |
| Thathampally |
9 |
Alapuzhala |
| Kakki Junction |
11 |
Alappuzha |
| Kallarakadvu |
11 |
Pathinamthita |
| Kulasekaram |
11 |
Thiruvananthapuram |
| Parayilkaling |
11 |
Pathinamthita |
| Thenkara |
11 |
palakkad |
| Aluva |
12 |
Ernakulam |
| Chalakudy |
12 |
Thrissur |
| Kothamangalam |
12 |
Ernakulam |
| Muvathupuzha |
12 |
Ernakulam |
| Pallikunnu - Kannur |
12 |
Kannur |
| Thalassery |
12 |
Kannur |
| Theekoy |
12 |
Kottayam |
| Thiruvallam |
12 |
Thiruvananthapuram |
| Veeyapuram |
12 |
Alapuzhala |
| Munnar Town |
13 |
Idukki |
| Alathoor -WYD |
14 |
Wayanad |
| Kalpetta - Rattakoli |
14 |
Wayanad |
| Kalpetta |
14 |
Wayanad |
| Malappuram-Kottakunne |
14 |
Malapuram |
| Malumelkadavu |
14 |
Kollam |
| Ottapalam |
14 |
Palakkad |
| Sultan Battery |
14 |
Wayanad |
| Chittur |
17 |
Palakkad |
| Kalikulam Junction |
17 |
Alappuzha |
| Kanhangod |
17 |
Kasaragod |
| Kasargod |
17 |
Kasaragod |
| Kollengode-Vellanara |
17 |
Palakkad |
| Mahe |
17 |
Puducherry |
| Moonkilmada |
17 |
Palakkad |
| Pokki-Manjeshwar |
17 |
Kottayam |
| South Beach - Calicut |
17 |
Kozhikode |
| Thodupuzha |
17 |
Idukki |
| Vadakara |
17 |
Kozhikode |
| Wadakancheery |
17 |
Thrissur |
| Thamarassery |
21 |
Kozhikode |
| Alathur |
26 |
Palakkad |
| Cholomkunnu |
26 |
Malapuram |
| Kaladi |
26 |
Ernakulam |
| Kallummoottilkadavu |
26 |
Kollam |
| Koodungalur |
26 |
Thrissur |
| Neyyathinkara |
26 |
Thiruvananthapuram |
| Talipparamba |
26 |
Kannur |
| Kulathurmozhi |
27 |
Kottayam |
| Chavakkad |
33 |
Thirssur |
| Cherananllur |
33 |
Thirssur |
| Ernakulam |
33 |
Ernakulam |
| Kollam Beach |
34 |
Kollam |
| Perror |
34 |
Idukki |
| Tirur |
34 |
Malapuram |
| Balusserry - Vaikundam |
60 |
Kozhikode |
| Thrissur |
60 |
Thrissur |
| Guruvayoor |
110 |
Thrissur |
| Irriti |
140 |
Kannur |
| Kuppapuram |
170 |
Alappuzha |
| Ponnani |
240 |
Malapuram |
| Chirakadavu |
280 |
Kottayam |
| Fort Cochin |
300 |
Ernakulam |
| Shastiparambu |
350 |
Ernakulam |
|
NITRATE |
Nitrate and nitrite are naturally occurring ions that are part of the nitrogen cycle. Nitrate is used mainly in inorganic fertilizers, and sodium nitrite is used as a food preservative, especially in cured meats. Nitrates may occur in both shallow and deep well supplies, but they are most common in water from shallow wells. Nitrate nitrogen can result from the seepage of water through soil containing nitrate-bearing minerals. The nitrate concentration in groundwater and surface water is normally low but can reach high levels as a result of leaching or runoff from agricultural land or contamination from human or animal wastes as a consequence of the oxidation of ammonia and similar sources. Anaerobic conditions may result in the formation and persistence of nitrite. Chlorination may give rise to the formation of nitrite within the distribution system if the formation of chloramine is not sufficiently controlled. The formation of nitrite is as a consequence of microbial activity and may be intermittent. Nitrification in distribution systems can increase nitrite levels, usually by 0.2–1.5 mg/litre. |
Effects on Environment and Human Health
The primary health concern regarding nitrate and nitrite is the formation of methaemoglobinaemia, which is also known as “blue-baby syndrome.” Nitrate is reduced to nitrite in the stomach of infants, and nitrite is able to oxidize haemoglobin (Hb) to methaemoglobin (metHb), which is unable to transport oxygen around the body. The reduced oxygen transport becomes clinically manifest when metHb concentrations reach 10% or more of normal Hb concentrations; the condition, called methaemoglobinaemia, causes cyanosis and, at higher concentrations, asphyxia. The normal metHb level in infants under 3 months of age is less than 3%. The Hb of young infants is more susceptible to metHb formation than that of older children and adults. |
Remedial Measures
The best method for treatment of large nitrate nitrogen concentrations due to human or animal wastes is prevention. Wells should be properly located and constructed in order to prevent sewage contamination. Nitrates can be removed through distillation, deionization, or reverse osmosis. Even though only 95% of ionic nitrates can be removed by reverse osmosis, non-ionic forms of nitrogen will not pass through the membrane. |
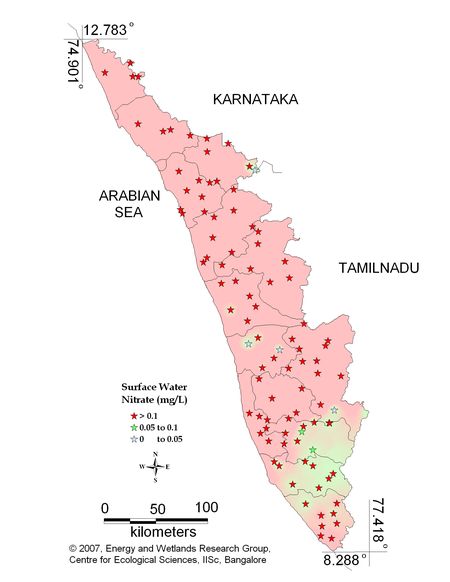
Figure 10.1 : Spatial variation of Nitrate in Kerala surface water
Surface water - Nitrate |
Tolerance limit for inland surface waters subject to pollution
Desirable Limit: 0.1 mg/L |
|
Remarks
Sampling sites above desirable limit are listed in Table 11.1
Table 11.1: Locations above desirable limits of Nitrate
| Location |
Value |
District |
| Aranmula Sathrakadavu |
0.11 |
Pathinamthita |
| Muthanga |
0.11 |
Wyanad |
| Athikayam |
0.11 |
Pathinamthita |
| Azhuta River |
0.11 |
Kottayam |
| Pidavoor |
0.12 |
Kollam |
| Kulathurmozhi |
0.12 |
Kottayam |
| Kazhuthruthy |
0.13 |
Kollam |
| Pandalam |
0.13 |
Pathinamthita |
| Avananvancherri |
0.14 |
Thiruvananthapuram |
| Sasthamkotta Lake |
0.14 |
Kollam |
| Kallarakadvu |
0.15 |
Pathinamthita |
| Malumelkadavu |
0.16 |
Kollam |
| Pamba-Aratukadavu |
0.17 |
Pathinamthita |
| Neduvannor Kadavu |
0.18 |
Kollam |
| Chenkulam |
0.20 |
Kollam |
| Kakkad |
0.20 |
Ernakulam |
| Kallana aru |
0.20 |
Kollam |
| Mukkadavu |
0.21 |
Kollam |
| Pamba-Njunungar |
0.23 |
Pathinamthita |
| Annakkayathumoola |
0.28 |
Thiruvananthapuram |
| Kaladi |
0.36 |
Ernakulam |
| Moonnukalunkutodu |
0.37 |
Idukki |
| Muvathupuzha |
0.37 |
Ernakulam |
| Karuvannurpuzha |
0.43 |
Thirssur |
| Kundamankadavu |
0.54 |
Thiruvananthapuram |
| Cherananllur |
0.61 |
Thirssur |
| Kuttampuzha |
0.63 |
Idukki |
| Kalikadu |
0.68 |
Thiruvananthapuram |
| Kallar |
0.71 |
Kollam |
| Chenkulathukavu |
0.76 |
Kottayam |
| Valikulam-Palapilly |
0.76 |
Thirssur |
| Peechi Dam |
0.81 |
Thirssur |
| Perumpara Estate |
0.87 |
Thirssur |
| Kudapuzha |
0.89 |
Thirssur |
| Neyyar |
0.90 |
Thiruvananthapuram |
| Nedumangadu |
0.91 |
Thiruvananthapuram |
| Sairandri |
0.92 |
Palakkad |
| Bhoothokallu |
0.95 |
Kannur |
| Wadakancheery |
1.04 |
Thirssur |
| Lekkidi-Vythri |
1.05 |
Wyanad |
| Urukkuzhi |
1.07 |
Kozhikode |
| Mannarkad-Kunthipuzha |
1.27 |
Palakkad |
| Tirunelli |
1.28 |
Wyanad |
| Vellayani |
1.34 |
Thiruvananthapuram |
| Vettikattumukku |
1.50 |
Kottayam |
| Changanacherry |
1.63 |
Kottayam |
| Puthalam |
1.65 |
Malapuram |
| Manchalmchola |
1.72 |
Malapuram |
| Azhuta River-Idukki |
1.76 |
Idukki |
| Koolimadu |
1.79 |
Kozhikode |
| Koodathi |
1.96 |
Kozhikode |
| Alathur |
2.00 |
Palakkad |
| Pazhasii Dam |
2.32 |
Kannur |
| Kattupara |
2.35 |
Malapuram |
| Ezhuvathruthy-Nariooarambu |
2.35 |
Malapuram |
| Ottapalam |
2.37 |
Palakkad |
| Malampuzha |
2.52 |
Palakkad |
| Adukkam |
2.63 |
Kottayam |
| Thamarakulam lake |
2.77 |
Kozhikode |
| Manjappalam |
2.79 |
Kozhikode |
| Thirthala |
2.98 |
Palakkad |
| Cheruthoni |
3.61 |
Idukki |
| Malapuram-Chamakayam |
3.72 |
Malapuram |
| Marakadavu |
3.72 |
Wyanad |
| Mananthavadi |
3.73 |
Wyanad |
| Pallipadi |
3.79 |
Malapuram |
| Irriti |
4.00 |
Kannur |
| Pambala-lower Periyar |
4.05 |
Idukki |
| Munddari |
4.31 |
Malapuram |
| Mananchira lake -Calicut |
4.37 |
Kozhikode |
| Pazhayidam |
4.39 |
Kottayam |
| Pookod Lake |
4.58 |
Wyanad |
| Nilambur-Chaliyar |
4.65 |
Malapuram |
| Vadakara-Koorangottukatavu |
4.72 |
Kozhikode |
| Karimbam-Taliparamba |
4.73 |
Kannur |
| Munnar (8th mile) |
4.74 |
Idukki |
| Panathur |
4.75 |
Kasarkod |
| Ellukachi-Karike |
4.75 |
Kasarkod |
| Thannimoodu - Kallar stream |
4.80 |
Idukki |
| Poovathummuddu |
5.23 |
Kottayam |
| Thodupuzha |
5.23 |
Idukki |
| Nallathanni |
5.91 |
Idukki |
| Bavikara-Chandragiripuzha |
6.72 |
Kasarkod |
| Puzhapalam - Chitturpuzha |
6.79 |
Palakkad |
| Veeyapuram |
7.22 |
Alapuzha |
| Jalsoor |
8.21 |
Kasarkod |
| Thommankuthu-Kaliyar |
9.07 |
Idukki |
| Kavalam-Kuttanadu |
9.14 |
Alapuzha |
| Munnar - Marayyr Rd |
9.22 |
Idukki |
| Kandiyoor |
11.30 |
Alapuzha |
| Kuppapuram |
20.40 |
Alapuzha |
|
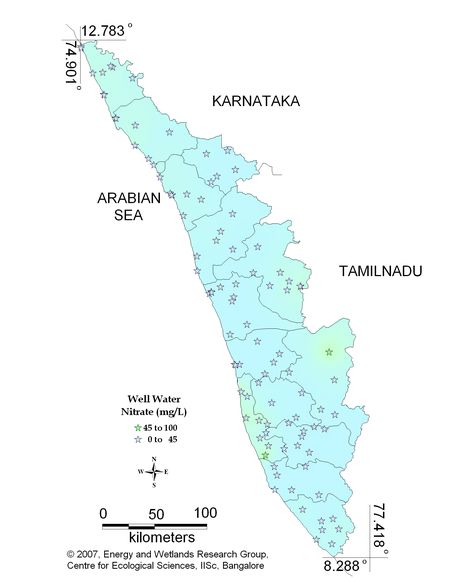
Figure 10.2: Spatial variation of Nitrate in Kerala well water
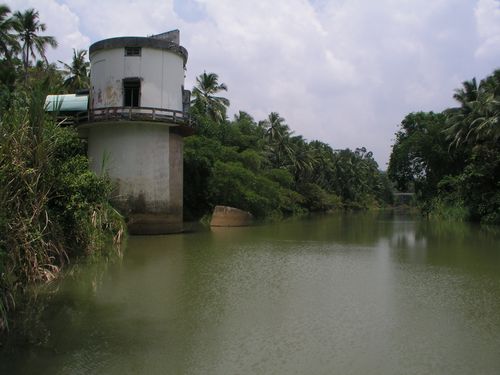
Growth of Algae due to high amount of Nitrates
Well water - Nitrate |
Standard for Drinking Water (BIS 105000)
Desirable Limit: 45 mg/L
Permissible limit in the absence of an
alternative source: 100mg/L |
|
Remarks
Sampling sites above desirable limit are given in Table 11.2
Table 11.2: Locations above desirable limits of Nitrate
| Location |
Value |
District |
| Old Munnar |
45.30 |
Idukki |
| Kayamkulam |
50.00 |
Alappuzha |
|
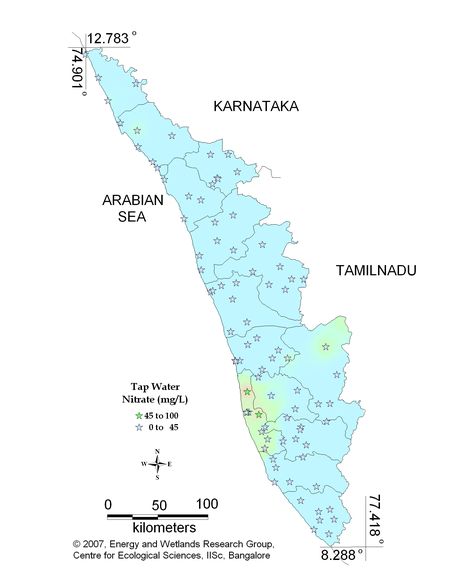
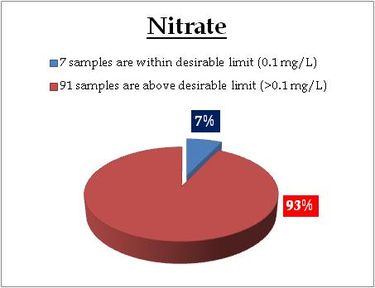
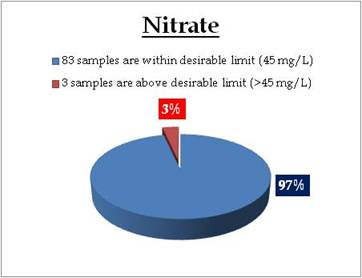
Figure 10.3: Spatial variation of Nitrate in Kerala tap water
Tap water - Nitrate |
Standard for Drinking Water (BIS 105000)
Desirable Limit: 45 mg/L
Permissible limit in the absence of an
alternative source: <45 mg/L |
|
Remarks
Sampling sites above desirable limit of Nitrate are listed in Table 11.3
Table 11.3: Sampling sites above desirable limits of Nitrate
Location Value District
Kavalam-Kuttanadu 46.10 Alappuzha
Thathampally 50.00 Alappuzha
Kalikulam Junction 54.90 Alappuzha |
Fluoride |
Fluoride accounts for about 0.3 g/kg of the Earth’s crust and exists in the form of fluorides in a number of minerals. The most important source of fluoride in drinking water is when water comes in contact with geological strata rich in fluorides. Inorganic fluoride-containing minerals are used widely in industry for a wide range of purposes, including aluminium production. Fluorides can be released to the environment from the phosphate-containing rock used to produce phosphate fertilizers; these phosphate deposits contain about 4% fluorine. Fluorosilicic acid, sodium hexafluorosilicate and sodium fluoride are used in municipal water fluoridation schemes. Daily exposure to fluoride depends mainly on the geographical area. |
Effects on Environment and Human Health
Fluoride ions maybe present either naturally or artificially in drinking water and are absorbed to some degree in the bone structure of the body and tooth enamel. Fluoride at extremely high levels can cause mottling (discoloration) of the teeth. Some fluoride compounds may also cause corrosion of piping and other water treatment equipment. Natural fluorides occur in rocks in some areas. Another source of fluorides in streams and reservoirs is releases from sewage treatment plants, since most public water supplies add fluoride to drinking water to reduce dental decay. Fluoride has beneficial effects on teeth at low concentrations in drinking water, but excessive exposure to fluoride in drinking water, or in combination with exposure to fluoride from other sources, can give rise to a number of adverse effects. High level of fluoride will also leads to soft tissue fluorosis, gastrointestinal manifestations, neurological manifestations, urinary tract manifestations, hormonal disorders, etc. |
Remedial Measures
Most people are aware that there is a controversy surrounding public fluoridation of drinking water. There are few ways to obtain drinking water without fluoride like,
- Reverse Osmosis Filtration: Reverse osmosis systems at community level would be feasible.
- Distillation Filtration: There are household distillations filters can be used to remove fluoride from water.
|
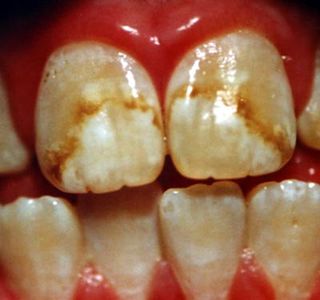
Fluorosis due to high amount of Fluoride

Skeletal Fluorosis due to high amount of Nitrates
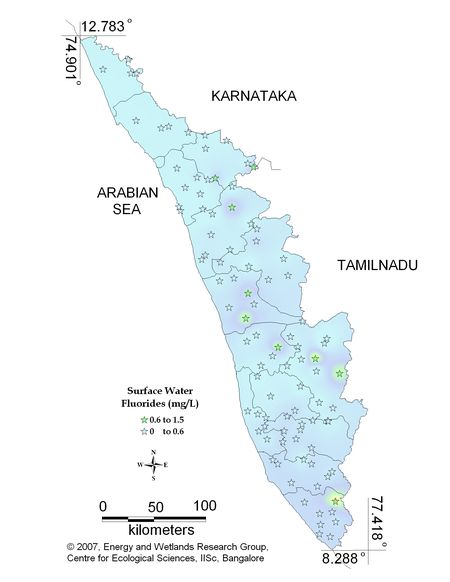
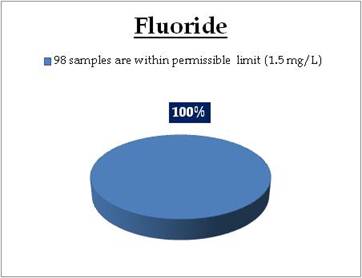
Figure 11.1: Spatial variation of fluoride in surface water
Surface water - Fluoride |
Tolerance limit for inland surface waters subject to pollution
Permissible Limit: 1.5 mg/L |
|
Remarks
All the 98 surface water samples collected from rivers, streams and lakes spread over in Kerala are under the inland surface water standard. |
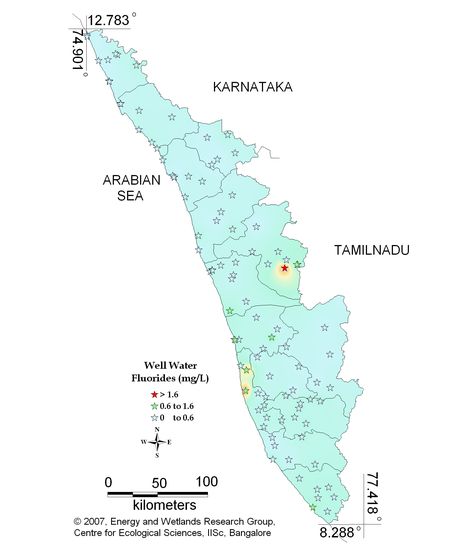
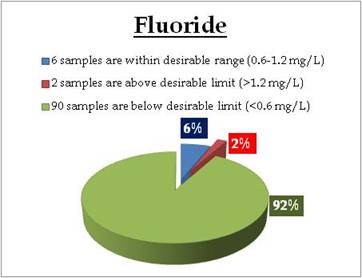
Figure 11.2: Spatial variation of fluoride in well water
Well water - Fluoride |
Standard for Drinking Water (BIS 105000)
Desirable Limit: 0.6 – 1.2 mg/L
Values below and above the standard limit cause bone related diseases. |
|
Remarks
Sampling sites above desirable limit and below desirable limits are listed in Tables 12.1 and 12.2 respectively
Table 12.1: Locations of wells - fluorides above desirable limits
| Location |
Value |
District |
| Mullackal |
1.4 |
Alappuzha |
| Kollengode |
1.6 |
Palakkad |
Table 12.2: Sampling sites below desirable limit of flouorides
| Location |
Value |
District |
| Kallummoottilkadavu |
0.2 |
Kollam |
| Pazhayidam |
0.2 |
Kottayam |
| Vettikattumukku |
0.2 |
Kottayam |
| Peeramedu |
0.2 |
Idukki |
| Mannarkkad |
0.2 |
Palakkad |
| Malappuram-Kottakunne |
0.2 |
Malapuram |
| Kalpetta - Rattakoli |
0.2 |
Wayanad |
| Poorot |
0.2 |
Kasarkod |
| Bovikanam |
0.2 |
Kasarkod |
| Koyilandy |
0.2 |
Kozhikode |
| Koyilandy-Kothamangalam |
0.2 |
Kozhikode |
| Kattachal |
0.3 |
Kollam |
| Malumelkadavu |
0.3 |
Kollam |
| Thuruthelpalam |
0.3 |
Kottayam |
| Poovathummuddu |
0.3 |
Kottayam |
| Adukkam |
0.3 |
Kottayam |
| Thannimoodu |
0.3 |
Idukki |
| Old Munnar |
0.3 |
Idukki |
| Thodupuzha |
0.3 |
Idukki |
| Kavalam |
0.3 |
Alappuzha |
| Kothamangalam |
0.3 |
Ernakulam |
| Thrissur |
0.3 |
Thrissur |
| Ponnani |
0.3 |
Palakkad |
| Vaithiri |
0.3 |
Wayanad |
| Chatakadavu |
0.3 |
Wayanad |
| Chemnad |
0.3 |
Kasarkod |
| Kanhangad |
0.3 |
Kasarkod |
| Payyanoor |
0.3 |
Kannur |
| Vallakadavu |
0.4 |
Idukki |
| Veeyapuram |
0.4 |
Alappuzha |
| Kayamkulam |
0.4 |
Alappuzha |
| Onakkoor-Piravam |
0.4 |
Ernakulam |
| Ernakulam |
0.4 |
Ernakulam |
| Kaladi |
0.4 |
Ernakulam |
| Chalakudy |
0.4 |
Thrisuur |
| Guruvayoor |
0.4 |
Thrissur |
| Guruvayoor |
0.4 |
Thrissur |
| Cherananllur |
0.4 |
Thrissur |
| Wadakancheery |
0.4 |
Thrissur |
| Thrissur |
0.4 |
Thrissur |
| Puzhapalam |
0.4 |
Palakkad |
| Ottapalam |
0.4 |
Palakkad |
| Nilambur |
0.4 |
Malapuram |
| Manjeri |
0.4 |
Malapuram |
| Karingalmanna |
0.4 |
Kozhikode |
| Balusserry - Vaikundam |
0.4 |
Kozhikode |
| Kottooli |
0.4 |
Kozhikode |
| Sulthan Bathery |
0.4 |
Wayanad |
| Hosabettu - Manjeshwar |
0.4 |
Kasarkod |
| Adhur |
0.4 |
Kasarkod |
| Payyanoor |
0.4 |
Kannur |
| Karimbam-Taliparamba |
0.4 |
Kasarkod |
| Kannur |
0.4 |
Kannur |
| Irriti |
0.4 |
Kannur |
| Mahe |
0.4 |
Puduchery |
| Vadakara |
0.4 |
Kozhikode |
| Koyilandy |
0.4 |
Kozhikode |
| Chitara Estate |
0.4 |
Kollam |
| Pidavoor |
0.5 |
Kollam |
| Athikayam |
0.5 |
Pathinamthita |
| Attathodu East |
0.5 |
Pathinamthita |
| Pampa Valley |
0.5 |
Pathinamthita |
| Vadaserikara |
0.5 |
Pathinamthita |
| Kallely Check Post |
0.5 |
Pathinamthita |
| Pandalam |
0.5 |
Pathinamthita |
| Kallarakadvu |
0.5 |
Pathinamthita |
| Chenkulathukavu |
0.5 |
Kottayam |
| Kulathurmozhi |
0.5 |
Kottyam |
| Neyyathinkara |
0.5 |
Tiruvanthapuram |
| Neyyar Dam |
0.5 |
Tiruvanthapuram |
| Kulasekaram |
0.5 |
Tiruvanthapuram |
| Boundermukku |
0.5 |
Tiruvanthapuram |
| Nedumangadu |
0.5 |
Tiruvanthapuram |
| Avananvancherri |
0.5 |
Tiruvanthapuram |
| Kochupilammood |
0.5 |
Kollam |
| Kandiyoor |
0.5 |
Alappuzha |
| Vettakkal Junction |
0.5 |
Alappuzha |
| Fort Cochin |
0.5 |
Ernakulam |
| Aluva |
0.5 |
Ernakulam |
| Chavakkad |
0.5 |
Thrissur |
| Thondikulam Agraharam |
0.5 |
Palakkad |
| Placimada |
0.5 |
Palakkad |
| Alathur |
0.5 |
Palakkad |
| Tirur |
0.5 |
Malappuram |
| Perinthalmanna |
0.5 |
Malappuram |
| Alathoor -WYD |
0.5 |
Wyanad |
| Bengathadka |
0.5 |
Kasarkod |
| Panathur |
0.5 |
Kasarkod |
| Aaviyal |
0.5 |
Kasarkod |
| Thalassery |
0.5 |
Kannur |
|
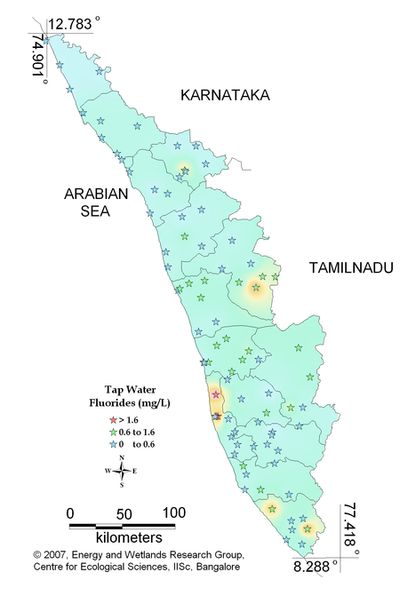
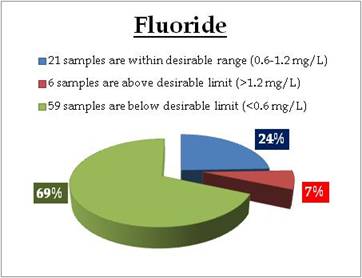
Figure 11.3: Spatial variation of fluoride in tap water
Tap water - Fluoride |
Standard for Drinking Water (BIS 105000)
Desirable Limit: 0.6 – 1.2 mg/L
Values below and above the standard limit cause bone related diseases. |
|
Remarks
Sampling sites above desirable limit and below desirable limit are listed in Table 12.3 and Table 12.4 respectively.
Table 12.3: Tap waters with fluoride above desirable limit
| Location |
Value |
District |
| Kalikadu |
1.4 |
Thiruvanathapuram |
| Kollengode-Vellanara |
1.4 |
Palakkad |
| Kalpetta |
1.4 |
Wayanad |
| Thathampally |
1.6 |
Alappuzha |
| Kuppapuram |
1.6 |
Alappuzha |
| Kalikulam Junction |
1.6 |
Alappuzha |
Table 12.4: Tap waters with fluoride below desirable limit
| Location |
Value |
District |
| Adithippuzha |
0 |
Pathinamthita |
| Fort Cochin |
0.2 |
Ernakulam |
| Kavalam-Kuttanadu |
0.2 |
Alappuzha |
| Theekoy |
0.2 |
Kottayam |
| Alathoor -WYD |
0.3 |
Wayanad |
| Balusserry - Vaikundam |
0.3 |
Kozhikode |
| Kanhangod |
0.3 |
Kasaragod |
| Kasargod |
0.3 |
Kasaragod |
| Kilikkallungal |
0.3 |
Malapuram |
| Kondayangadi-Mananthavadi |
0.3 |
Wayanad |
| Pokki-Manjeshwar |
0.3 |
Kasaragod |
| Ponathur |
0.3 |
Kasaragod |
| Sultan Battery |
0.3 |
Wayanad |
| Akathethara |
0.4 |
palakkad |
| Chalakudy |
0.4 |
Thrissur |
| Chavakkad |
0.4 |
Thirssur |
| Cholomkunnu |
0.4 |
Malapuram |
| Kakki Junction |
0.4 |
Alapuzhala |
| Kallummoottilkadavu |
0.4 |
Kollam |
| Kalpetta - Rattakoli |
0.4 |
Wayanad |
| Kandiyoor |
0.4 |
Alapuzha |
| Kayamkulam |
0.4 |
Alappuzha |
| Kollam Beach |
0.4 |
Kollam |
| Koodungalur |
0.4 |
Thrissur |
| Nilambur |
0.4 |
Malapuram |
| Ottapalam |
0.4 |
palakkad |
| Parayilkaling |
0.4 |
Kottayam |
| Pazhavangadi Jn-Aazhapuzha |
0.4 |
Alappuzha |
| Perror |
0.4 |
Kottayam |
| Ponnani |
0.4 |
Malapuram |
| Shastiparambu |
0.4 |
Ernakulam |
| South Beach - Calicut |
0.4 |
Kozhikode |
| Thenkara |
0.4 |
palakkad |
| Thodupuzha |
0.4 |
Idukki |
| Tirur |
0.4 |
Malapuram |
| Vaithiri |
0.4 |
Wayanad |
| Veeyapuram |
0.4 |
Alapuzhala |
| Boundermukku |
0.5 |
Thiruvananthapuram |
| Chenkulathukavu |
0.5 |
Kottayam |
| Chitara Estate |
0.5 |
Thirssur |
| Irriti |
0.5 |
Kannur |
| Kallarakadvu |
0.5 |
Pathinamthita |
| Kallely |
0.5 |
Pathinamthita |
| Kulasekaram |
0.5 |
Thiruvananthapuram |
| Kulathurmozhi |
0.5 |
Kottayam |
| Mahe |
0.5 |
Puducherry |
| Nedumangadu |
0.5 |
Thiruvananthapuram |
| Neyyathinkara |
0.5 |
Thiruvananthapuram |
| Pallikunnu - Kannur |
0.5 |
Kannur |
| Pamba-Triveni |
0.5 |
Pathinamthita |
| Pandalam |
0.5 |
Pathinamthita |
| Pathanapuram pump house |
0.5 |
Pathinamthita |
| Payyanoor |
0.5 |
Kannur |
| Talipparamba |
0.5 |
Kannur |
| Thalassery |
0.5 |
Kannur |
| Thamarassery |
0.5 |
Kozhikode |
| Thiruvallam |
0.5 |
Thiruvananthapuram |
| Vadakara |
0.5 |
Kozhikode |
| Vadaserikara |
0.5 |
Pathinamthita |
|
Chlorides |
Chlorides are salts resulting from the combination of the gas chlorine with a metal. Some common chlorides include sodium chloride (NaCl) and magnesium chloride (MgCl2). Chlorine alone as Cl2 is highly toxic and it is often used as a disinfectant. In combination with a metal such as sodium it becomes essential for life. Small amounts of chlorides are required for normal cell functions in plant and animal life. |
Effects on environment and human health:
Chlorides are not usually harmful to people; however, the sodium part of table salt has been linked to heart and kidney disease. Sodium chloride may impart a salty taste at 250 mg/L; however, calcium or magnesium chlorides are not usually detected by taste until levels of 1000 mg/L are reached.
Chlorides may get into surface water from several sources including: 1) rocks containing chlorides; 2) agricultural runoff; 3) wastewater from industries; and 4) effluent wastewater from wastewater treatment plants.
Chlorides can corrode metals and affect the taste of food products. Therefore, water that is used in industry or processed for any use has a recommended maximum chloride level. Chlorides can contaminate fresh water streams and lakes. Fish and aquatic communities cannot survive in high levels of chlorides. |
Remedial measures
Chlorides can be removed from water by reverse osmosis. Deionization (demineralization) or distillation will also remove chlorides from water, but these methods are less suitable for household use than reverse osmosis. |
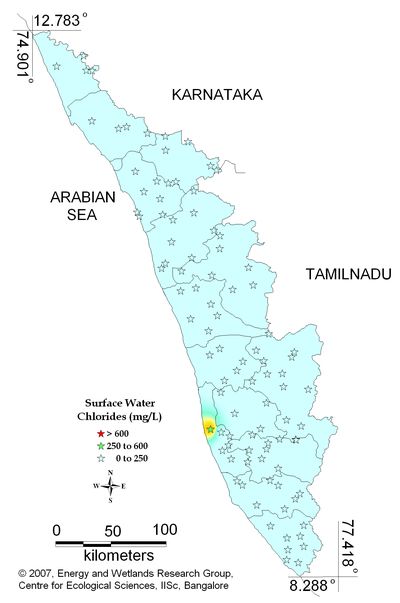
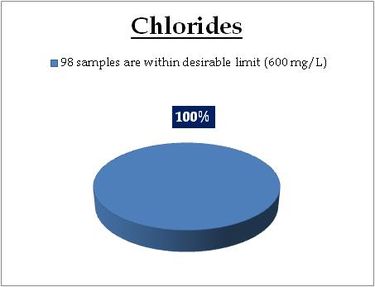
Figure 12.1: Spatial variation of Chlorides in surface water
Surface water - Chlorides |
Tolerance limit for inland surface waters subject to pollution
Desirable Limit: 250 mg/L
Permissible Limit: 1000 mg/L |
|
Remarks
All the 98 surface water samples collected from rivers, streams and lakes spread over in Kerala are under the inland surface water standard. |
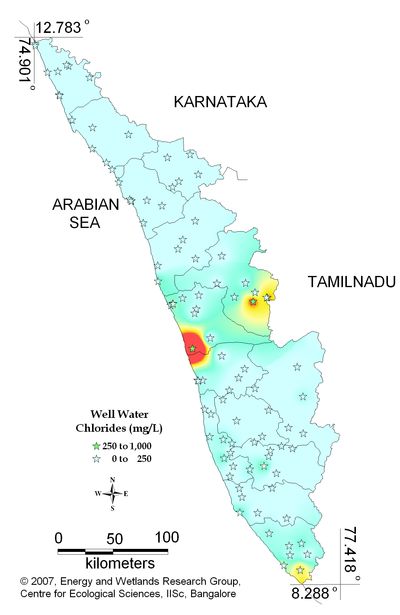
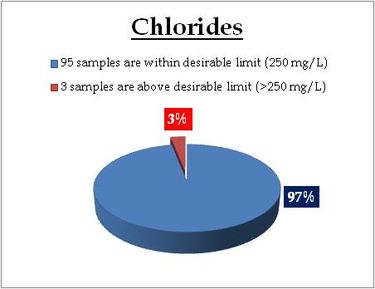
Figure 12.2: Spatial variation of chlorides in well water
Well water- Chlorides |
Standard for Drinking Water (BIS 105000)
Desirable Limit: 250 mg/L
Permissible limit in the absence of an
alternative source: 1000mg/L
Beyond this limit taste, corrosion and palatability are affected. |
|
Remarks
Sampling sites above desirable limit are listed in Table 13
Table 13: Sampling locations of well water containing chlorides above desirable limit
| Location |
Value |
District |
| Kollengode |
268.29 |
Palakkad |
| Placimada |
314.35 |
Palakkad |
| Koodungalur |
921.01 |
Thrissur |
|
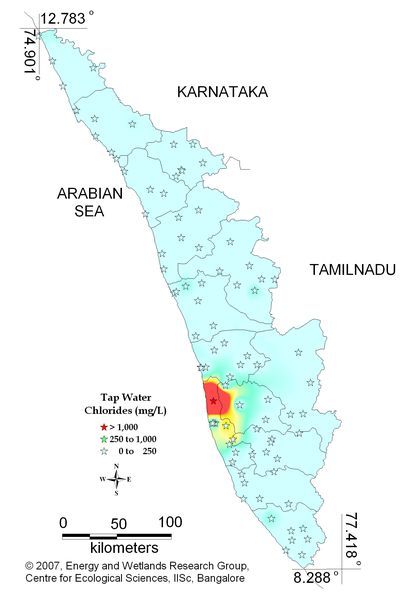
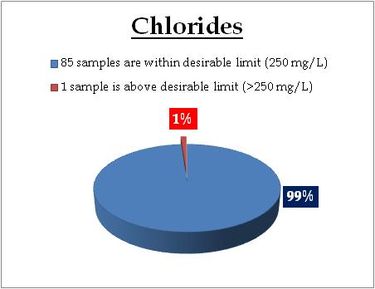
Figure 12.3: Spatial variation of chlorides in tap water
Tap water- Chlorides |
Standard for Drinking Water (BIS 105000)
Desirable Limit: 250 mg/L
Permissible limit in the absence of an
alternative source: 1000mg/L
Beyond this limit taste, corrosion and palatability are affected. |
|
Remarks
Sampling site above desirable limit is listed in Table 13.2
Table 13.2: Sampling locations of tap water containing chlorides above desirable limit
| Location |
Value |
District |
| Kalikulam Junction |
1751.93 |
Alappuzha |
|
Phosphates |
Phosphates are chemical compounds containing phosphorus. Phosphorus is a non-metallic element which is necessary for life and is found in rock as inorganic phosphates. As water runs over and through rocks it carries off small amounts of minerals such as calcium, magnesium, and phosphates. Inorganic phosphates are a plant nutrient and are taken in by plants with water and incorporated into organic phosphate compounds. Animals obtain their essential phosphorus from phosphates in water and plant material. Natural waters have a phosphorus concentration of approximately 0.02 mg/L which is a limiting factor for plant growth. On the other hand, large concentrations of this nutrient can accelerate plant growth. |
Effects on Environment and Human Health
Phosphates enter waterways through manmade sources also. The addition of large quantities of phosphates to waterways accelerates algae and plant growth in natural waters; enhancing eutrophication and depleting the water body of oxygen. This can lead to fish kills and the degradation of habitat with loss of species. Large mats of algae can form and in severe cases can completely cover small lakes. As a result, water can become putrid from decaying organic matter. When the concentration of phosphates rises above 100 mg/liter the coagulation processes in drinking water treatment plants may be adversely affected. Manmade sources of phosphate include human sewage, agricultural run-off from crops, sewage from animal feedlots, pulp and paper industry, vegetable and fruit processing, chemical and fertilizer manufacturing, and detergents. |
Remedial Measures
The precipitation of phosphates from wastewater can occur during different phases within the wastewater treatment process. Pre-precipitation, where the chemicals are added to raw wastewater in primary sedimentation facilities, removes the precipitated phosphates with the primary sludge. In co-precipitation, the chemicals are added during secondary treatment to the effluent from the primary sedimentation facilities; to the mixed liquor in the activated-sludge process; or to the effluent from a biological treatment process before secondary sedimentation. They are removed with the waste biological sludge. In post-precipitation, the chemicals are added to the effluent from secondary sedimentation facilities and are removed in separate sedimentation facilities or in effluent filters. An alternative, biotechnological, approach is that of 'Enhanced Biological Phosphate Removal' ('EBPR') which utilises the ability of some microorganisms to accumulate phosphate (as polyphosphate) in excess of their normal metabolic requirements. |

Figure 13.1: Spatial variation of phosphates in Kerala’s surface water
Surface water - Phosphates |
Tolerance limit for inland surface waters subject to pollution
Permissible Limit: 5 mg/L |
|
Remarks
All the 98 surface water samples collected from rivers, streams and lakes spread over in Kerala are under the inland surface water standard. |

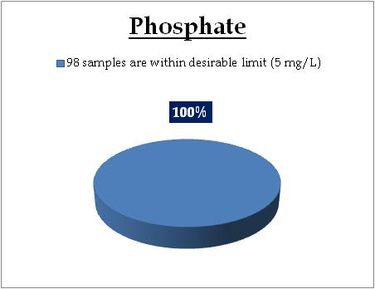
Figure 13.3: Spatial variation of phosphates in Kerala’s tap water
Sulphate |
Two forms of sulphur are commonly found in drinking water: sulphate and hydrogen sulphide. Both forms are nuisances and usually do not pose a health risk at the concentrations found in domestic wells.
Sulphate is a combination of Sulphur and oxygen, part of naturally occurring minerals in some soil and rock. The mineral dissolves over time and is released into ground water. Hydrogen sulfide is produced by Sulphur-reducing bacteria, which use sulphur as an energy source. The bacteria chemically change natural sulfate in water to hydrogen sulfide. Hydrogen sulfide gas also occurs naturally in some ground water. It is found in deep or shallow wells. |
Effects on Environment and Human Health
Sulphur a secondary water contaminant, with no direct threat to human health. Sulphate gives water a bitter taste and can have a laxative effect that may lead to dehydration. Hydrogen sulphide gives water a “rotten egg” odor and taste, and can cause nausea. Both forms of sulphur damages water distribution system. Sulphate causes scale buildup in pipes, producing a dark slime that can clog plumbing and stain clothing. Hydrogen sulphate is corrosive to metals such as iron, steel, copper and brass. It can tarnish silverware and discolor copper and brass utensils. Hydrogen sulphide also can cause yellow or black stains on kitchen and bathroom fixtures.
Coffee, tea and other beverages made with water containing hydrogen sulfide may be discolored and the appearance and taste of cooked foods can be affected. High concentrations of dissolved hydrogen sulfide also can foul the resin bed of an ion exchange water softener. |
Remedial Measures
Sulphate can be partially removed by reverse osmosis. |

Figure 14.1: Spatial variation of sulphate in Kerala’s surface water
Surface water - Sulphate |
Standard for Drinking Water (BIS 105000)
Desirable Limit: 150 mg/L
Permissible limit in the absence of an
alternative source: 400mg/L
Beyond this cause gastrointestinal irritation when magnesium or sodium is present |
|
REMARKS
All the 98 surface water samples collected from rivers, streams and lakes spread over in Kerala are under the inland surface water standard. |

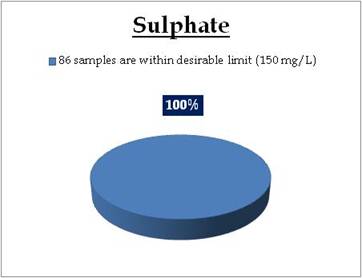
Figure 14.2: Spatial variation of sulphate in Kerala’s well water
Well water - Sulphate |
Standard for Drinking Water (BIS 105000)
Desirable Limit: 150 mg/L
Permissible limit in the absence of an
alternative source: 400mg/L
Beyond this cause gastrointestinal irritation when magnesium or sodium is present |
|
Remarks
Sampling sites above desirable limit, value (mg/L) and district is listed below:
Location Value District
Koodungalur 200.7 Thrissur |

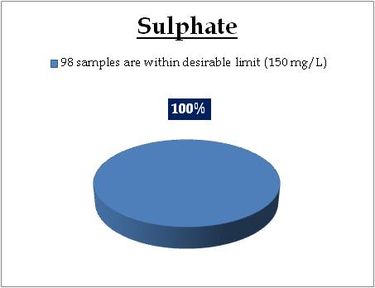
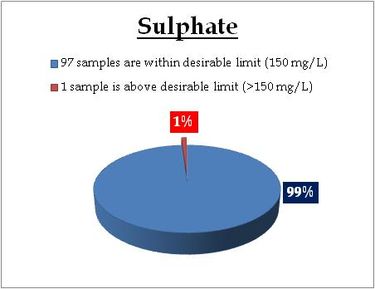
Figure 14.3: Spatial variation of sulphate in Kerala’s tap water
Tap water - Sulphate |
Standard for Drinking Water (BIS 105000)
Desirable Limit: 150 mg/L
Permissible limit in the absence of an
alternative source: 400mg/L
Beyond this cause gastrointestinal irritation when magnesium or sodium is present |
|
Remarks
All the 98 surface water samples collected from rivers, streams and lakes spread over in Kerala are under the inland surface water standard. |
Hardness |
Hard water is high in dissolved minerals, both calcium and magnesium. As water moves through soil and rock, it dissolves small amounts of these naturally-occurring minerals and carries them into the ground water zone. Water is a great solvent for calcium and magnesium, so if the minerals are present in the soil around well and its water supply, we end up with hard water. Hard water interferes with almost every cleaning task, from doing the laundry to washing dishes to taking a shower. Clothes can look dingy and feel rough and scratchy. Dishes and glasses get spotted and a film may build up on shower doors, bathtubs, sinks and faucets. Washing hair in hard water may leave it feeling sticky and dull. Finally, hard water can cause a residue to build-up in pipes that can lower water pressure throughout the house. |
Effects on Environment and Human Health
Hardness does not pose a serious health risk and is not regulated. In fact, calcium and magnesium in drinking water can help ensure to get the average daily requirements for these minerals in our diet.
However, hard water can be a nuisance due to the mineral buildup on plumbing fixtures and poor soap and detergent performance. It often causes aesthetic problems, such as an alkali taste to the water that makes coffee taste bitter; build-up of scale on pipes and fixtures than can lead to lower water pressure; build-up of deposits on dishes, utensils and laundry basins; difficulty in getting soap and detergent to foam; and lowered efficiency of electric water heaters. |
Remedial Measures
Water softeners operate on the ion exchange process (specifically a cation exchange process where ions are exchanged). In this process, water passes through a media bed, usually sulfonated polystyrene beads. The beads are supersaturated with sodium (a positive ion). The ion exchange process takes place as hard water passes through the softening material. The hardness minerals (positively charged Calcium and Magnesium ions) attach themselves to the resin beads while sodium on the resin beads is released simultaneously into the water. When the resin becomes saturated with calcium and magnesium, it must be recharged. The recharging is done by passing a concentrated salt solution through the resin. The concentrated sodium replaces the trapped calcium and magnesium ions which are discharged in the waste water. Softened water is not recommended for watering plants, lawns, and gardens due to its elevated sodium content. |

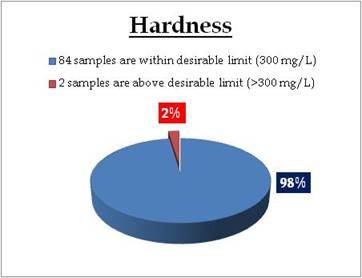
Figure 15.1: Spatial variation of Hardness in Kerala’s surface water
Surface water - Hardness |
Tolerance limit for inland surface waters subject to pollution
Desirable Limit: 300 mg/L
Permissible Limit: 600 mg/L |
|
Remarks
All the 98 surface water samples collected from rivers, streams and lakes spread over in Kerala are under the inland surface water standard. |

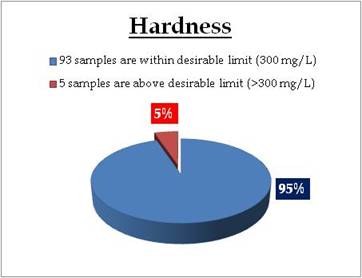
Figure 15.2: Spatial variation of Hardness in Kerala’s well water
Well water - Hardness |
Standard for Drinking Water (BIS 105000)
Desirable Limit: 300 mg/L
Permissible limit in the absence of an
alternative source: 600mg/L |
|
Remarks
Wells at following sampling sites have hardness above desirable limit
| Location |
Value |
District |
| Kannimari |
320.00 |
Palakkad |
| Fort Cochin |
392.00 |
Ernakulam |
| Placimada |
512.00 |
Palakkad |
| Kollengode |
520.00 |
Palakkad |
| Koodungalur |
700.00 |
Thrissur |
|

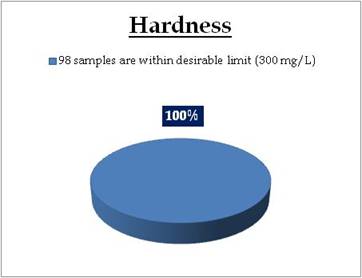
Figure 15.3: Spatial variation of hardness in Kerala’s tap water
Tap water - Hardness |
Standard for Drinking Water (BIS 105000)
Desirable Limit: 300 mg/L
Permissible limit in the absence of an
alternative source: 600mg/L |
|
Remarks
Tap water at following sampling sites have hardness above desirable limit
| Location |
Value |
District |
| Kollengode-Vellanara |
424.00 |
Palakkad |
| Kalikulam Junction |
500.00 |
Alappuzha |
|
Calcium |
Calcium salts and calcium ions are among the most commonly occurring in nature. They may result from the leaching of soil and other natural sources or may come from man-made sources such as sewage and some industrial wastes. Calcium is usually one of the most important contributors to hardness. Human body requires approximately 0.7 to 2.0 grams of calcium per day as a food element, excessive amounts can lead to the formation of kidney or gallbladder stones. High concentrations of calcium can also be detrimental to some industrial processes. Thus, both domestic and industrial water users have to consider calcium concentrations. Calcium (Ca) is the major mineral causing hardness in water. When groundwater saturated with dissolved carbon dioxide is pumped to the surface, any subsequent rise in temperature and/or reduction in pressure causes degassing of carbon dioxide and precipitation (settling) of calcium salts forming encrustation deposits. |
Effects on Environment and Human Health
Calcium also serves an important role in the health of bodies of water. In natural water it is known to reduce the toxicity of many chemical compounds on fish and other aquatic life. |
Remedial measures
In case of higher amount of calcium, it can be removed by reverse osmosis or deionization methods. These techniques will remove the entire calcium content, which may affect human health due to lack of calcium. |

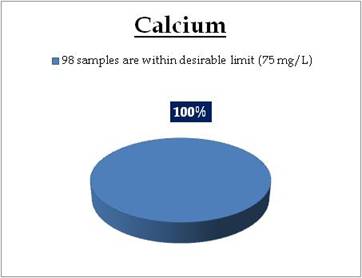
Figure 16.1: Spatial variation of calcium in Kerala’s surface water
Surface water - Calcium |
Tolerance limit for inland surface waters subject to pollution
Desirable Limit: 75 mg/L
Permissible Limit: 200 mg/L |
|
Remarks
All the 98 surface water samples collected from rivers, streams and lakes spread over in Kerala are under the inland surface water standard. |

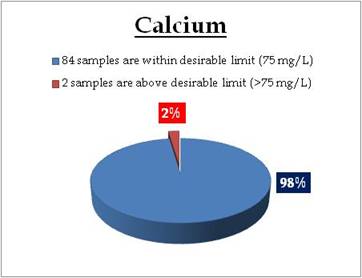
Figure 16.2: Spatial variation of calcium in Kerala’s Well water
Well water - Calcium |
Standard for Drinking Water (BIS 105000)
Desirable Limit: 75 mg/L
Permissible limit in the absence of an
alternative source: 200mg/L |
|
Remarks
Well water at following sites have calcium above desirable limit
| Location |
Value |
District |
| Ponnani |
109.02 |
Malappuram |
| Koodungalur |
120.24 |
Thirssur |
| Fort Cochin |
157.11 |
Ernakulam |
|

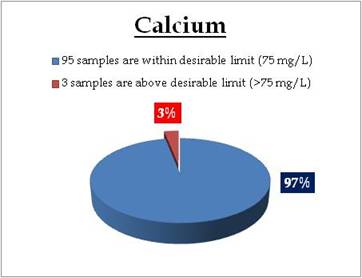
Figure 16.3: Spatial variation of calcium in Kerala’s Tap water
Tap water- Calcium |
Tolerance limit for inland surface waters subject to pollution
Desirable Limit: 75 mg/L
Permissible Limit: 200 mg/L
Encrustation in water supply structure and adverse effect on domestic use |
|
Remarks
Tap water at following sampling sites have calcium above desirable limit
| Location |
Value |
District |
| Kollengode-Vellanara |
92.99 |
Palakkad |
| Kalikulam Junction |
440.88 |
Alappuzha |
|
Magnesium |
A large number of minerals contains magnesium, for example dolomite (calcium magnesium carbonate; CaMg(CO3)2) and magnesite (magnesium carbonate; MgCO3). Magnesium is washed from rocks and subsequently ends up in water. Magnesium has many different purposes and consequently may end up in water in many different ways. Chemical industries add magnesium to plastics and other materials as a fire protection measure or as filler. It also ends up in the environment from fertilizer application and from cattle feed. Magnesium sulphate is applied in breweries and magnesium hydroxide is applied as a flocculent in wastewater treatment plants. Magnesium is also a mild laxative. |
Effects on Environment and Human Health
The studies found an inverse (protective) association between cardiovascular disease mortality and increased water hardness (measured by calcium carbonate or another hardness parameter and/or the calcium and magnesium content of water). The associations were reported in numerous studies, While magnesium is one of the elements that supports life, many studies have been performed regarding physiological functions as well as correlation with diseases.
Environmental problems indirectly caused by magnesium in water are caused by applying softeners. Calcium and magnesium ions (particularly calcium) negatively influence cleansing power of detergents, because these form nearly insoluble salts with soap. |
Remedial Measures
Magnesium compounds can be removed from water by means of water softening. |

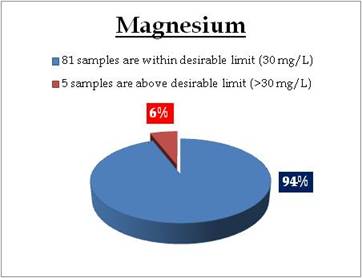
Figure 17.1: Spatial variation of Magnesium in Kerala’s surface water
Surface water - Magnesium |
Tolerance limit for inland surface waters subject to pollution
Desirable Limit: 30 mg/L*
Permissible Limit: 100 mg/L*
*Standard for Drinking Water (BIS 105000) |
|
Remarks
Sampling site above desirable limit of Magnesium is:
| Location |
Value |
District |
| Puzhapalam |
31.60 |
Palakkad |
|

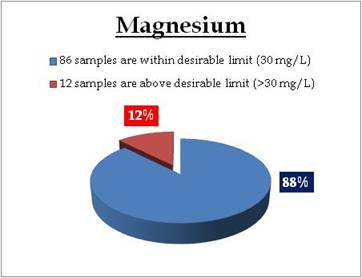
Figure 17.2: Spatial variation of Magnesium in Kerala’s well water
Well water - Magnesium |
Standard for Drinking Water (BIS 105000)
Desirable Limit: 30 mg/L
Permissible limit in the absence of an
alternative source:100 mg/L
|
|
Remarks
Sampling sites where Magnesium is above desirable limit
| Location |
Value |
District |
| Chavakkad |
30.81 |
Thrissur |
| Mahe |
31.99 |
Mahe - Puducheery |
| Kochupilammood |
35.10 |
Kollam |
| Alathur |
36.69 |
Palakkad |
| Guruvayoor |
41.95 |
Thrissur |
| Thannimoodu |
42.14 |
Idukki |
| Puzhapalam |
46.24 |
Palakkad |
| Fort Cochin |
57.31 |
Ernakulam |
| Kannimari |
69.47 |
Palakkad |
| Placimada |
109.67 |
Palakkad |
| Kollengode |
118.67 |
Palakkad |
| Koodungalur |
141.46 |
Thrissur |
|

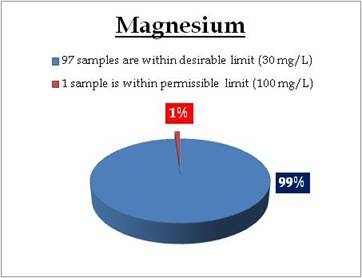
Figure 17.3: Spatial variation of Magnesium in Kerala’s tap water
Tap water - Magnesium |
Standard for Drinking Water (BIS 105000)
Desirable Limit: 30 mg/L
Permissible limit in the absence of an
alternative source:100 mg/L
|
|
Remarks
Sampling sites where Magnesium is above desirable limit
| Location |
Value |
District |
| Moonkilmada |
31.80 |
Palakkad |
| Chittur |
32.19 |
Palakkad |
| Veeyapuram |
39.98 |
Alappuzha |
| Chenkulathukavu |
40.58 |
Kottayam |
| Kollengode-Vellanara |
80.77 |
Palakkad |
|
Sodium |
Sodium is the sixth most abundant element on the Earth and is widely distributed in soils, plants, water and foods. Most parts of the world has significant deposits of sodium-containing minerals, most notably sodium chloride (salt). Sodium dissolves easily in water and is always present at some level. If well water is treated for hardness, that process usually involves sodium and can lead to higher levels of sodium in the water. (Some water softeners use potassium and are not a threat). Other sources of sodium are natural occurrences and runoff. |
Effects on Environment and Human Health
Sodium is a normal component of the body and adequate levels of sodium are required for good health. Food is the main source of daily human exposure to sodium. Less than one percent of daily intake of sodium comes from water. The people with high blood pressure are sensitive to sodium and can reduce blood pressure by reducing sodium. Although some people can consume excessive levels of sodium without increased blood pressure, many cannot. Other risk factors for high blood pressure include excess weight, alcohol consumption, and a family history of high blood pressure. High levels of sodium may aggravate existing high blood pressure. Factors to help reduce high blood pressure include a low sodium diet, increased fruit and vegetable consumption, exercise, weight control, and medication if necessary. Sodium in drinking water may be an issue for someone with heart disease, hypertension, kidney disease, circulatory illness or on a sodium-controlled diet. |
Remedial Measures
Reverse osmosis will reduce the amount of sodium in drinking water a significant amount. |

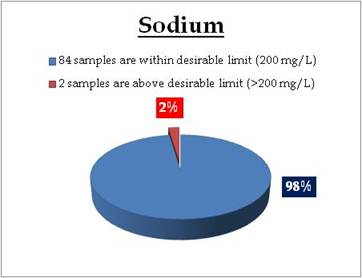
Figure 18.1: Spatial variation of sodium in Kerala’s surface water
Surface water - Sodium |
Standard for Drinking Water (WHO)
Desirable Limit: 200mg/L |

|
Remarks
Sampling site having Sodium above desirable limit
Location Value District
Kuppapuram 279.18 Alappuzha |

Figure 18.2: Spatial variation of sodium in Kerala’s well water
Well Water - Sodium |
Standard for Drinking Water (WHO)
Desirable Limit: 200mg/L |

|
Remarks
Sampling sites above desirable limit of Sodium:
| Location |
Value |
District |
| Neyyathinkara |
216.20 |
Tiruvanthapuram |
| Placimada |
229.32 |
Palakkad |
| Ponnani |
1120.14 |
Palakkad |
| Koodungalur |
1203.20 |
Thrissur |
|

Figure 18.3: Spatial variation of sodium in Kerala’s tap water
Tap water - Sodium |
Standard for Drinking Water (WHO)
Desirable Limit: 200mg/L |
|
Remarks
Sampling sites above desirable limit of Sodium are:
| Location |
Value |
District |
| Thathampally |
257.56 |
Alappuzha |
| Kalikulam Junction |
1259.60 |
Alappuzha |
|
Potassium |
Hard water is indicative of the presence of higher levels of magnesium. The need for magnesium increases with age as well as level of stress. Magnesium controls muscle contraction, protein metabolism, blood coagulation, and energy production, among other vital tasks. Failure to take in enough magnesium over time leads to high blood pressure and osteoporosis.
Magnesium aids in body functions; it can also help prevent disease. Studies show that magnesium in drinking water protects against the deaths of patients with diabetes mellitus, and prevents the development of cerebrovascular disease. Magnesium also lowers the risk of fatality from acute myocardial infarction (heart disease), particularly in females. In high-risk patients, magnesium is recommended to protect against gastric cancer |
Effects on Environment and Human Health
There is currently no background document or summary statement for potassium in the Guidelines for Drinking-water Quality. Potassium water softeners are being used as an alternative to sodium water softeners, in response to a perception that potassium is better for health. However, some people with specific diseases or on certain medications are susceptible to hyperkalaemia, and some mention of this needs to be made in WHO guidance. |
Remedial Measures
Magnesium can be removed by reverse osmosis, along with other total dissolved solids. Other removal methods like distillation and deionization |

Figure 19.1: Spatial variation of potassium in Kerala’s surface water

Figure 19.2: Map showing spatial variation of potassium in Kerala’s tap water
Alkalinity |
Alkalinity refers to the capability of water to neutralize acid. This is really an expression of buffering capacity. A buffer is a solution to which an acid can be added without changing the concentration of available H+ ions (without changing the pH) appreciably. It essentially absorbs the excess H+ ions and protects the water body from fluctuations in pH. Alkalinity is often related to hardness because the main source of alkalinity is usually from carbonate rocks (limestone) which are mostly CaCO3. If CaCO3 actually accounts for most of the alkalinity, hardness in CaCO3 is equal to alkalinity. Since hard water contains metal carbonates (mostly CaCO3), it is high in alkalinity. Conversely, unless carbonate is associated with sodium or potassium which don't contribute to hardness, soft water usually has low alkalinity and little buffering capacity. So, generally, soft water is much more susceptible to fluctuations in pH from acid rains or acid contamination. |
Effects on Environment and Human Health
Alkalinity is important for fish and aquatic life because it protects or buffers against rapid pH changes. Living organisms, especially aquatic life, function best in a pH range of 6.0 to 9.0. Alkalinity is a measure of how much acid can be added to a liquid without causing a large change in pH. Higher alkalinity levels in surface waters will buffer acid rain and other acid wastes and prevent pH changes that are harmful to aquatic life. |
Remedial Measures
Alkalinity can be removed by reverse osmosis, along with other total dissolved solids. Other removal methods like distillation and deionization remove total dissolved solids and alkalinity, but they are less suitable for household use than reverse osmosis, but can be used at community level. |

Figure 20.1: Spatial variation of alkalinity in Kerala’s surface water
Surface water - Alkalinity |
Tolerance limit for inland surface waters subject to pollution
Desirable Limit: 200 mg/L
Permissible Limit: 600 mg/L |
|
Remarks
All the 98 surface water samples collected from rivers, streams and lakes spread over in Kerala are under the inland surface water standard. |

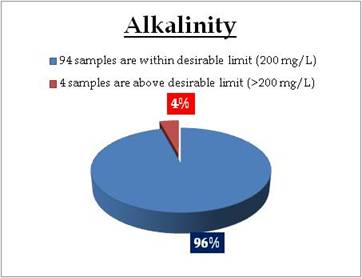
Figure 20.2: Spatial variation of alkalinity in Kerala’s well water
Well water - Alkalinity |
Standard for Drinking Water (BIS 105000)
Desirable Limit: 200 mg/L
Permissible limit in the absence of an
alternative source: 600mg/L
Beyond this limit taste becomes unpleasant. |
|
Remarks
Sampling sites above desirable limit of Alkalinity are:
| Location |
Value |
District |
| Attathodu East |
200.00 |
Pathanamthitta |
| Koodungalur |
304.00 |
Thrissur |
| Placimada |
340.00 |
Palakkad |
| Fort Cochin |
352.00 |
Ernakulam |
| Kollengode |
408.00 |
Palakkad |
|
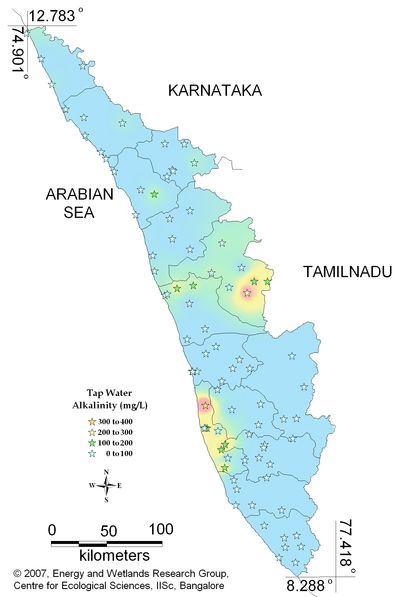
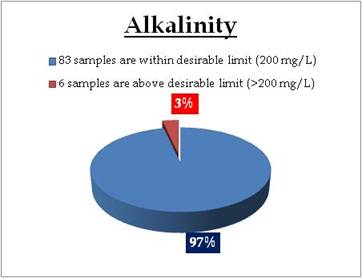
Figure 20.3: Spatial variation of Alkalinity in Kerala tap water
Tap water - Alkalinity |
Standard for Drinking Water (BIS 105000)
Desirable Limit: 200 mg/L
Permissible limit in the absence of an
alternative source: 600mg/L
Beyond this limit taste becomes unpleasant. |
|
Remarks
Sampling sites above desirable limit of Alkalinity are:
| Location |
Value |
District |
| Kollengode-Vellanara |
228.00 |
Palakkad |
| Thathampally |
232.00 |
Alappuzha |
| Kalikulam Junction |
304.00 |
Alappuzha |
|
Total Dissolved Solids |
The expression, “total dissolved solids” (TDS), refers to the total amount of all inorganic and organic substances – including minerals, salts, metals, cations or anions – that are dispersed within a volume of water. By definition, the solids must be small enough to be filtered through a sieve measuring 2 micrometers. TDS concentrations are used to evaluate the quality of freshwater systems. TDS concentrations are equal to the sum of positively charged ions (cations) and negatively charged ions (anions) in the water. Sources for TDS include agricultural run-off, urban run-off, industrial wastewater, sewage, and natural sources such as leaves, silt, and rocks. Piping or plumbing may also release metals into the water. |
Effects on Environment and Human Health
TDS is not considered primarily as pollutant, high TDS levels typically indicate hard water and may lead to scale buildup in pipes, reduced efficiency of water filters, hot water heaters, etc., and aesthetic problems such as a bitter or salty taste. Water with a high TDS concentration may indicate elevated levels of ions that do pose a health concern, such as aluminum, arsenic, copper, lead, nitrate and others. |
Remedial Measures
TDS can be removed by reverse osmosis and other removal methods like distillation and deionization. |

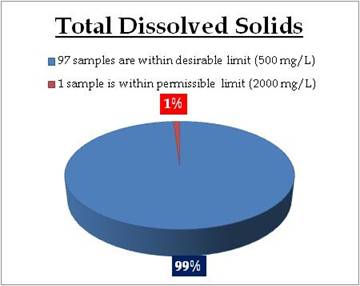
Figure 21.1: Spatial variation of TDS in Kerala’s surface water
Surface water – Total Dissolved Solids |
Tolerance limit for inland surface waters subject to pollution
Desirable Limit: 500 mg/L
Permissible Limit: 2000 mg/L |
|
REMARKS
Sampling site above desirable limit of TDS is:
Location Value District
Kuppapuram 786.00 Alappuzha |

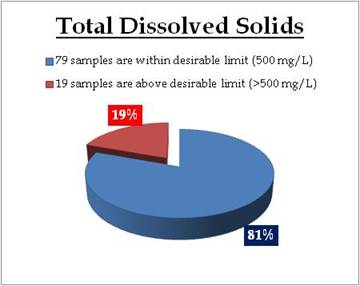
Figure 21.2: Spatial variation of TDS in Kerala’s well water
Well water – Total Dissolved Solids |
Tolerance limit for inland surface waters subject to pollution
Desirable Limit: 500 mg/L
Permissible Limit: 2000 mg/L |
|
REMARKS
Sampling sites above desirable limit of TDS are:
| Location |
Value |
District |
| Thiruvallam |
514.00 |
Tiruvanthapuram |
| Chalakudy |
518.00 |
Thrissur |
| Kochupilammood |
527.00 |
Kollam |
| Thrissur |
531.00 |
Thrissur |
| Kannimari |
539.34 |
Palakkad |
| Cherananllur |
548.00 |
Thrissur |
| Veeyapuram |
554.00 |
Alappuzha |
| Muvathupuzha |
566.00 |
Kottayam |
| Wadakancheery |
583.00 |
Thrissur |
| Fort Cochin |
633.00 |
Ernakulam |
| Ponnani |
644.33 |
Palakkad |
| Guruvayoor1 |
828.00 |
Thrissur |
| Chavakkad |
870.00 |
Thrissur |
| Kollengode |
995.92 |
Palakkad |
| Placimada |
1190.55 |
Palakkad |
| Aluva |
4060.00 |
Ernakulam |
| Kothamangalam |
4220.00 |
Ernakulam |
| Guruvayoor |
4480.00 |
Thrissur |
| Koodungalur |
6060.00 |
Thrissur |
|

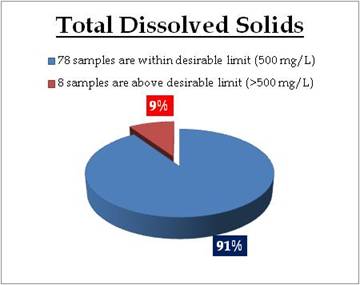
Figure 21.3: Spatial variation of TDS in Kerala’s tap water
Tap water – Total Dissolved Solids |
Tolerance limit for inland surface waters subject to pollution
Desirable Limit: 500 mg/L
Permissible Limit: 2000 mg/L |
|
Remarks
Sampling sites above desirable limit of TDS are:
| Location |
Value |
District |
| Chenkulathukavu |
517.00 |
Kottayam |
| Chavakkad |
560.00 |
Thrissur |
| Guruvayoor |
566.00 |
Thrissur |
| Wadakancheery |
597.00 |
Thrissur |
| Kollengode-Vellanara |
611.40 |
Palakkad |
| Thathampally |
695.00 |
Alappuzha |
| Cherananllur |
702.00 |
Thrissur |
| Kalikulam Junction |
1920.00 |
Alappuzha |
|
Salinity |
Salinity is an indication of the concentration of dissolved salts in a body of water. The ions responsible for salinity include the major cations (calcium, Ca2+; magnesium, Mg2+; sodium, Na-; and potassium, K-) and the major anions (carbonates, CO32- and HCO32-; sulphate, SO42-; and chloride, Cl-). The level of salinity in aquatic systems is important to aquatic plants and animals as species can survive only within certain salinity range. Although some species are well-adapted to surviving in saline environments, growth and reproduction of many species can be hindered by increases in salinity. There are two kinds of salinity – dryland and irrigation salinity. Both involve water management and the need to maintain the right balance or equilibrium.
Salinity (dry land) - Dryland salinity occurs when salt stored in the soil profile over thousands of years is brought to the surface or close to the surface by rising groundwater levels. Dryland salinity is classified as either primary or secondary. Primary salting occurs naturally while secondary salting is induced by human activities such as agriculture. The ultimate outcome of dryland salinity is the discharge of saline water to streams and soils, commonly occurring when saline groundwater rises to within two metres of the ground surface. Salinity (irrigation) - Irrigation salinity resembles dryland salinity, except that groundwater accession is induced through irrigation water rather than rainfall alone. Irrigation salinity refers to an accumulation of salt in the plant root zone or on the soil surface, commonly as a result of saline groundwater rising within two metres of the ground surface. Salt sources are consistent with those that occur in the process of dryland salinity and include cyclic salts, salts derived from old marine sediments or from the weathering and breakdown of rocks in soil formation. |
Effects on Environment and Human Health
An elevated Salinity is not a health hazard. The Salinity concentration is a secondary drinking water standard and therefore is regulated because it is more of an aesthetic rather than a health hazard. |
Remedial Measures
Salinity can be removed by reverse osmosis, along with other total dissolved solids. Other removal methods like distillation and deionization can also remove salinity. |

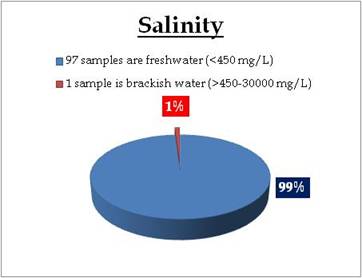
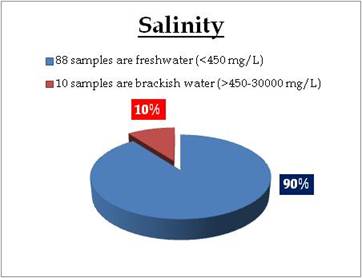
Figure 22.1: Spatial variation of Salinity in Kerala’s surface water
Surface water – Salinity |
Water Classification according to Salinity
0-450mg/L = Freshwater
450 - 30 000 mg/L = Brackish water
30 000 - 50 000 mg/L = Saline water |
|
Remarks
Sampling site in brackish water condition is:
| Location |
Value |
District |
| Kuppapuram |
561.00 |
Alappuzha |
|

Figure 22.2: Spatial variation of Salinity in Kerala’s well water
Well water – Salinity |
Water Classification according to Salinity
0-450mg/L = Freshwater
450 - 30 000 mg/L = Brackish water
30 000 - 50 000 mg/L = Saline water |
|
Remarks
Sampling sites in brackish water condition are:
| Location |
Value |
District |
| Ponnani |
461.62 |
Palakkad |
| Guruvayoor |
590.00 |
Thrissur |
| Chavakkad |
618.00 |
Thrissur |
| Kollengode |
712.46 |
Palakkad |
| Veeyapuram |
795.00 |
Alapuzha |
| Placimada |
851.32 |
Palakkad |
| Aluva |
2900.00 |
Ernakkualm |
| Kothamangalam |
3000.00 |
Ernakkualm |
| Guruvayoor 1 |
3180.00 |
Thrissur |
| Koodungalur |
4310.00 |
Thrissur |
|

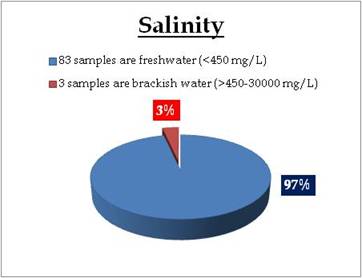
Figure 22.3: Spatial variation of Salinity in Kerala’s tap water
Tap water – Salinity |
Water Classification according to Salinity
0-450mg/L = Freshwater
450 - 30 000 mg/L = Brackish water
30 000 - 50 000 mg/L = Saline water |
|
Remarks
Sampling sites in brackish water condition are:
| Location |
Value |
District |
| Thathampally |
495.00 |
Alappuzha |
| Cherananllur |
500.00 |
Thrissur |
| Kalikulam Junction |
1380.00 |
Alappuzha |
|
Conductivity |
Conductivity is a measurement of the ability of an aqueous solution to carry an electrical current. An ion is an atom of an element that has gained or lost an electron which will create a negative or positive state. For example, sodium chloride (table salt) consists of sodium ions (Na+) and chloride ions (Cl-) held together in a crystal. In water it breaks apart into an aqueous solution of sodium and chloride ions. |
Effects on Environment and Human Health
Conductivity is a measurement used to determine a number of applications related to water quality. These are as follows:
- Determining mineralization: this is commonly called total dissolved solids. Total dissolved solids information is used to determine the overall ionic effect in a water source. Certain physiological effects on plants and animals are often affected by the number of available ions in the water.
- noting variation or changes in natural water and wastewaters quickly;
- estimating the sample size necessary for other chemical analyses; and
- Determining amounts of chemical reagents or treatment chemicals to be added to water sample.
Elevated dissolved solids can cause "mineral tastes" in drinking water. Corrosion or encrustation of metallic surfaces by waters high in dissolved solids causes problems with industrial equipment and boilers as well as domestic plumbing, hot water heaters, toilet flushing mechanisms, faucets, and washing machines and dishwashers.
Indirect effects of excess dissolved solids are primarily the elimination of desirable food plants and habitat-forming plant species. Agricultural uses of water for livestock watering are limited by excessive dissolved solids and high dissolved solids can be a problem in water used for irrigation. |
Remedial Measures
Conductivity can be removed by reverse osmosis desalination or electrodialysis. |

Figure 23.1: Spatial variation of conductivity in Kerala’s surface water
Surface water- Conductivity |
Tolerance limit for inland surface waters subject to pollution
Permissible Limit: 1000 µS/cm |
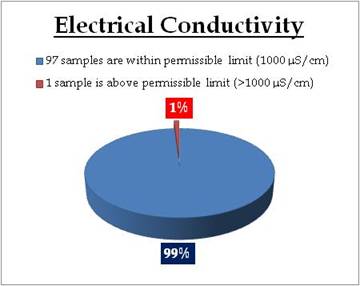
|
Remarks
Sampling site above permissible limit of conductivity is:
Location Value District
Kuppapuram 1126.00 Alappuzha |

Figure 23.2: Spatial variation of conductivity in Kerala’s Well water

Figure 23.3: Map showing spatial variation of conductivity in Kerala’s tap water
pH |
The pH level of drinking water reflects how acidic or alkaline it is. pH stands for “potential hydrogen,” referring to the amount of hydrogen mixed with the water. pH is measured on a scale that runs from 0-14. Seven is neutral, indicating there is no acid or alkalinity present. A measurement below 7 indicates acid is present and a measurement above 7 indicates alkalinity.
The normal range for pH in ground water lies between 6 and 8.5. |
Effects on Environment and Human Health
The pH is of major importance in determining the corrosivity of water. In general, the lower the pH, the higher the level of corrosion. However, pH is only one of a variety of factors affecting corrosion.
Exposure to extreme pH values results in irritation to the eyes, skin, and mucous membranes. Eye irritation and exacerbation of skin disorders have been associated with pH values greater than 11. In addition, solutions of pH 10–12.5 have been reported to cause hair fibres to swell. In sensitive individuals, gastrointestinal irritation may also occur. Exposure to low pH values can also result in similar effects. Below pH 4, redness and irritation of the eyes have been reported, the severity of which increases with decreasing pH. Below pH 2.5, damage to the epithelium is irreversible and extensive (10). In addition, because pH can affect the degree of corrosion of metals as well as disinfection efficiency, it may have an indirect effect on health. |
Remedial Measure
Treat the problem of acidic, low pH drinking water with a neutralizer. The neutralizer feeds a solution, typically using soda ash, into the water to prevent the water from reacting with the house plumbing or contributing to corrosion, which can leach metals into the water. Note: neutralizing with soda ash increases the sodium content of the water, which may pose additional health concerns for your household. Treat hard water with a high pH with an ion-exchange system or the addition of a lime-soda ash mixture. These processes also can increase the sodium content of the water.
Although pH usually has no direct impact on water consumers, it is one of the most important operational water-quality parameters. Careful attention to pH control is necessary at all stages of water treatment to ensure satisfactory water clarification and disinfection. For effective disinfection with chlorine, the pH should preferably be less than 8. The pH of the water entering the distribution system must be controlled to minimize the corrosion of water mains and pipes in household water systems. Failure to do so can result in the contamination of drinking-water and in adverse effects on its taste, odour, and appearance. |

Figure 24.1: Spatial variation of pH in Kerala’s surface water
Surface water - pH |
Tolerance limit for inland surface waters subject to pollution
Desirable range: 6 - 9 |
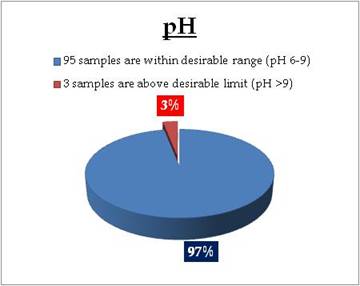
|
Remarks
Sampling sites above desirable limit of pH are:
| Location |
Value |
District |
| Thamarakulam lake |
9.08 |
Kozhikode |
| Kazhuthruthy |
9.11 |
Kollam |
| Vellayani lake |
9.18 |
Tiruvanthapuram |
|

Figure 24.2: Spatial variation of pH in Kerala’s well water
Well water - pH |
Standard for Drinking Water (BIS 105000)
Desirable range: 6.5 - 8.5 |
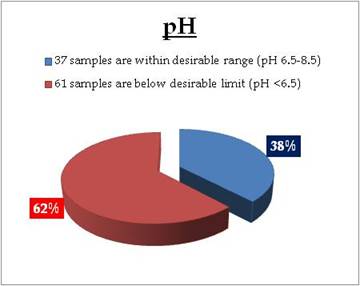
|
Remarks
Sampling sites above desirable limit of pH are:
| Location |
Value |
District |
| Neyyathinkara |
4.32 |
Tiruvanthapuram |
| Kannur |
4.87 |
Kannur |
| Bovikanam |
4.93 |
Kasarkod |
| Kulasekaram |
5.14 |
Tiruvanathapuram |
| Kallarakadvu |
5.15 |
Pathinamthitta |
| Adukkam |
5.15 |
Kottayam |
| Malumelkadavu |
5.24 |
Kollam |
| Aluva |
5.26 |
Ernakulam |
| Kottooli |
5.26 |
Kozhikode |
| Thrissur |
5.28 |
Thrissur |
| Irriti |
5.30 |
Kannur |
| Avananvancherri |
5.36 |
Tiruvanthanpuram |
| Balusserry - Vaikundam |
5.42 |
Kozhikode |
| Vaithiri |
5.47 |
Wayanad |
| Cherananllur |
5.48 |
Thrissur |
| Peeramedu |
5.49 |
Idukki |
| Thodupuzha |
5.64 |
Idukki |
| Chatakadavu |
5.65 |
Wayanad |
| Hosabettu - Manjeshwar |
5.66 |
Kasarkod |
| Onakkoor-Piravam |
5.70 |
Ernakulam |
| Malappuram-Kottakunne |
5.71 |
Malapuram |
| Sulthan Bathery |
5.72 |
Wayanad |
| Pidavoor |
5.79 |
Kollam |
| Nilambur |
5.80 |
Malapuram |
| Tirur |
5.81 |
Malapuram |
| Kaladi |
5.87 |
Ernakulam |
| Boundermukku |
5.88 |
Tiruvanthapuram |
| Vettikattumukku |
5.88 |
Kottayam |
| Chitara Estate |
5.92 |
Kollam |
| Kothamangalam |
5.92 |
Ernakulam |
| Poovathummuddu |
5.94 |
Kottayam |
| Kallummoottilkadavu |
6.01 |
Kollam |
| Vallakadavu |
6.07 |
Idukki |
| Muvathupuzha |
6.07 |
Ernakulam |
| Thrissur |
6.07 |
Thrissur |
| Thannimoodu |
6.08 |
Idukki |
| Mannarkkad |
6.11 |
Palakkad |
| Perinthalmanna |
6.11 |
Malapuram |
| Payyanoor |
6.12 |
Kannur |
| Kallely Check Post |
6.13 |
Pathinamthita |
| Bengathadka |
6.15 |
Kasarkod |
| Panathur |
6.16 |
Kasarkod |
| Karimbam-Taliparamba |
6.16 |
Kannur |
| Ottapalam |
6.19 |
Palakkad |
| Kavalam |
6.20 |
Alappuzha |
| Kayamkulam |
6.23 |
Alappuzha |
| Wadakancheery |
6.23 |
Kozhikode |
| Neyyar Dam |
6.25 |
Tiruvanthapuram |
| Kochupilammood |
6.25 |
Kollam |
| Old Munnar |
6.25 |
Idukki |
| Kalpetta - Rattakoli |
6.25 |
Wayanad |
| Alathoor |
6.25 |
Palakkad |
| Poorot |
6.28 |
Kasarkod |
| Thalassery |
6.30 |
Kannur |
| Thuruthelpalam |
6.34 |
Kottayam |
| Manjeri |
6.34 |
Malapuram |
| Kanhangad |
6.37 |
Kasarkod |
| Chalakudy |
6.38 |
Thirssur |
| Kulathurmozhi |
6.40 |
Kottayam |
| Koyilandy |
6.40 |
Kozhikode |
| Chenkulathukavu |
6.46 |
Kottayam |
|

Figure 24.3: Spatial variation of pH in Kerala’s tap water
Tap water - pH |
Standard for Drinking Water (BIS 105000)
Desirable range: 6.5 - 8.5 |
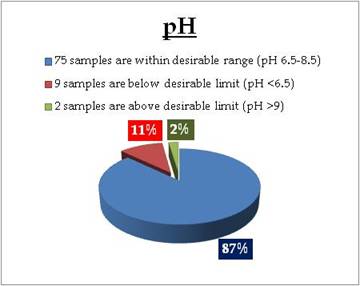
|
Remarks
Sampling sites below desirable limit of pH are:
| Location |
Value |
District |
| Pazhavangadi Jn |
5.93 |
Alappuzha |
| Payyanoor |
6.03 |
Kasarkod |
| Malumelkadavu |
6.13 |
Kollam |
| Peeramedu |
6.27 |
Idukki |
| Vaithiri |
6.28 |
Wayanad |
| Talipparamba |
6.44 |
Kannur |
| Neyyathinkara |
6.45 |
Tiruvanthapuram |
| Thenkara |
6.45 |
Palakkad |
| Perror |
6.49 |
Kottayam |
Sampling sites above desirable limit of pH are:
| Location |
Value |
District |
| Thalassery |
8.89 |
Kannur |
| Chitara Estate |
9.06 |
Kollam |
|
Dissolved oxygen |
Dissolved oxygen analysis measures the amount of gaseous oxygen (O2) dissolved in an aqueous solution. Dissolved oxygen is one of the most important parameters in aquatic systems. This gas is an absolute requirement for the metabolism of aerobic organisms and also influences inorganic chemical reactions. Therefore, knowledge of the solubility and dynamics of oxygen distribution is essential to interpreting both biological and chemical processes within water bodies. Oxygen gets into water by diffusion from the surrounding air, by aeration (rapid movement) and as a waste product of photosynthesis. The amount of dissolved oxygen gas is highly dependent on temperature. Atmospheric pressure also has an effect on dissolved oxygen. The amount of oxygen (or any gas) that can dissolve in pure water (saturation point) is inversely proportional to the temperature of water. The warmer the water, the less dissolved oxygen. |
Effects on Environment Health
In a nutrient-rich water body the dissolved oxygen is quite high in the surface water due to increased photosynthesis by the large quantities of algae. However, dissolved oxygen tends to be depleted in deeper waters because photosynthesis is reduced due to poor light penetration and due to the fact that dead phytoplankton (algae) falls toward the bottom using up the oxygen as it decomposes. In a nutrient-poor water body there is usually less difference in dissolved oxygen from surface to bottom. This difference between surface and bottom waters is exaggerated in the summer in reservoirs, stream-pools, and embayment when thermal layering occurs which prevents mixing. The surface may become supersaturated with oxygen (>100%) and the bottom anoxic (virtually no oxygen). Shallower reservoirs and actively flowing shallow streams generally are kept mixed due to wind action in the shallow reservoirs and physical turbulence created by rocks in the stream beds.
Adequate dissolved oxygen is needed and necessary for good water quality. Oxygen is a necessary element to all forms of life. Adequate oxygen levels are necessary to provide for aerobic life forms which carry on natural stream purification processes. As dissolved oxygen levels in water drop below 5.0 mg/L, aquatic life is put under stress. The lower the concentration, the greater the stress. Oxygen levels that remain below 1-2 mg/L for a few hours can result in large fish kills. Total dissolved oxygen concentrations in water should not exceed 110 percent. Concentrations above this level can be harmful to aquatic life. Fish in waters containing excessive dissolved gases may suffer from "gas bubble disease"; however, this is a very rare occurrence. The bubbles or emboli block the flow of blood through blood vessels causing death. Aquatic invertebrates are also affected by gas bubble disease but at levels higher than those lethal to fish. |

Figure 25.1: Spatial variation of dissolved oxygen in Kerala ‘s surface water
Surface water – Dissolved Oxygen |
Tolerance limit for inland surface waters subject to pollution
Desirable Limit: 3 mg/L |
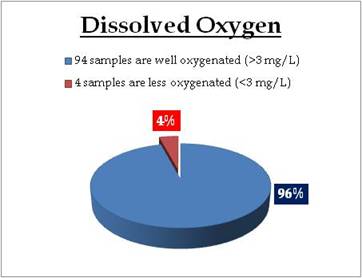
|
Remarks
Sampling sites not in the desirable limit of DO are:
| Location |
Value |
District |
| Changanacherry |
0.89 |
Kottayam |
| Alathur |
1.73 |
Palakkad |
| Athikayam |
2.08 |
Pathinamthitta |
| Peechi Dam |
2.24 |
Thrissur |
|
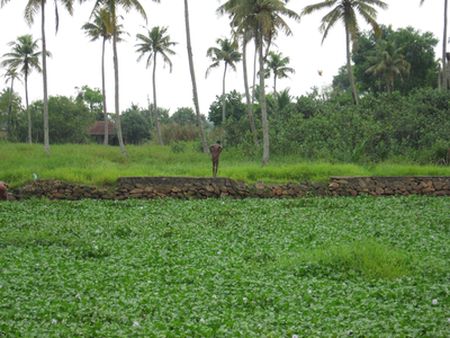
Aquatic weeds growth in waterways, which affects the oxygen mixing in water

Figure 25.2: Spatial variation of Dissolved Oxygen in Kerala’s well water

Figure 25.3: Spatial variation of dissolved oxygen in Kerala’s tap water
|