|
|
CES Technical Report 133, August 2013 |
WATERSCAPE OF KERALA: CHARACTERISATION OF SURFACE, WELL AND TAP WATER IN ALL DISTRICTS |
Reponses to queries
HOW THE SURVEY WAS DONE?
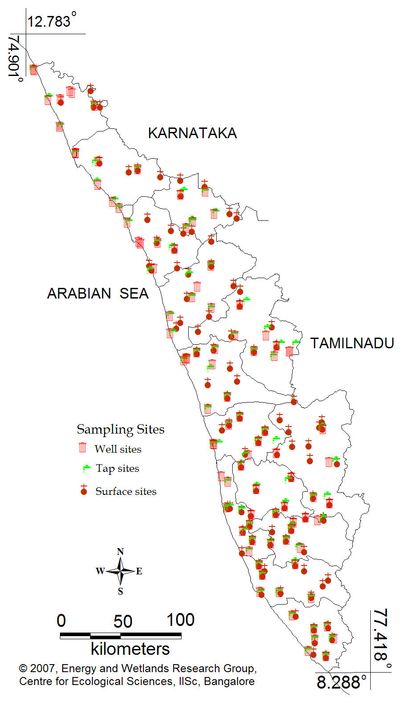
- Selection of location
- The surface, tap and well water samples are collected from the district head quarters, taluk head quarters and places of tourist importance in 14 districts in Kerala
- Time of the survey
- The sampling was done during the pre-monsoon season of 2007
- The samples were collected in three phases
- Phase I (2nd April 2007 to 8th April)
- Phase II (21st April to 3rd May 2007)
- Phase III (13th May 27th May)
- Method of sampling
- The water samples were collected in the two and half-liter polythene cans for laboratory analysis.
| Parameters |
Methods (APHA Section no.) |
| pH* |
Electrode Probe |
| Water Temperature (ºC) * |
| Salinity* |
| TDS* |
| EC (µS) * |
| DO* |
Azide Modification Iodometric (421 A) |
| Alkalinity |
Acid Titrimetric (403) |
| Chlorides |
Argentometric (407 A) |
| Hardness |
Ethelenediaminetetraacitic acid (314 B) |
| Calcium Hardness |
Ethelenediaminetetraacitic acid (311 C) |
| Magnesium Hardness |
Magnesium by Calculation (318 C) |
| Phosphates |
Stannous Chloride (424 E) |
| Sulphates |
Turbidimetric method (426 C) |
| Sodium |
Flame Photometric (325 B) |
| Potassium |
Flame Photometric (322 B) |
| Nitrate* |
Electrode screening (418 B) |
| Fluoride |
SPADNS (413 C) |
| Faecal Coliform Bacteria |
Standard Total Coliform Multiple Tube Tests (908 A, D) |
* Analysis carried on site
Why water sources are polluted in Kerala?
Most polluted surface water stretches
| Name of the River System |
Reasons |
| Kuppapuram & Vembanad Lake complex |
- High amount of Total dissolved solids, electrical conductivity, sodium, phosphates, potassium, hardness, salinity, and Nitrate
- Infestation of water hyacinth
- Waste water from boats
- Confluence of major rivers
|
| Periyar river (Aluva stretch) |
- High amount of coliform, Total dissolved solids, electrical conductivity, Sodium and salinity
- Industrial effluents
- Alteration of river bed by sand mining
- Physical appearance of water body a) abnormal colouration like greenish brown
|
| Gayathripuzha (Alathur stretch) |
- High amount of Total dissolved solids, conductivity, sodium and nitrate
- Low level of dissolved oxygen
- Infestation of water hyacinth
|
| Karamana river (Nedumangad stretch) |
- High amount of Total dissolved solids, conductivity, sodium,
|
| Pamaba river (Athikayam stretch) |
- High amount of Total dissolved solids, conductivity and sodium.
- Low level of dissolved oxygen
|
| Tamarakulam lake (Kozhikode) |
- High amount of pH, Total dissolved solids, conductivity and sodium
- Eutrophication
|
| Neyyar river (Neyyattinkara stretch) |
- High amount of coliform, Total dissolved solids, conductivity and sodium.
- Sewage and hospital waste mixing with river
|
Most polluted well water sources
| Name of the Site |
Reasons |
| Koodungalur (Thrissur) |
High amount of Total dissolved solids, electrical conductivity, sodium, chlorides, hardness, salinity, calcium, alkalinity, sulphates and nitrate |
| Thrissur town (Thrissur) |
High amount of Total dissolved solids, electrical conductivity, sodium, hardness, salinity, and nitrate
VERY HIGH AMOUNT OF COLIFORM |
| Fort Cochin (Ernakulam) |
High amount of Magnesium, alkalinity, calcium |
| Aluva (Ernakulam) |
VERY HIGH AMOUNT OF COLIFORM |
| Plachimada (Palakkad) |
High amount of Sodium, magnesium, alkalinity, salinity |
| Ponnani (Palakkad) |
High amount of sodium, alkalinity, calcium, salinity |
| Old Munnar (Idukki) |
High amount of Nitrate |
Most polluted tap water sources
| Name of the Site |
Reasons |
| Kallikulam Junction (Alappuzha) |
- High amount of salinity, calcium, alkalinity, sodium, chlorides, fluorides, Total dissolved solids, nitrates, hardness and coliform
- Salt water intrusion
|
| Thathampally (Alappuzha) |
- High amount of salinity, alkalinity, sodium, chlorides, fluorides, Total dissolved solids and nitrates
- Salt water intrusion
|
| Cheranellur (Thrissur) |
- High amount of salinity, Total dissolved solids and coliform
- Water supply from groundwater
|
| Kollengode (Palakkad) |
- High amount of calcium, alkalinity, alkalinity, fluorides, Total dissolved solids, hardness and coliform
|
| Kavalam (Alappuzha) |
- High amount of nitrates and coliform
- Salt water intrusion
|
| Guruvayoor (Thrissur) |
- High amount of Total dissolved solids and coliform
|
What are the reasons for fluoride and nitrate contamination?
Fluoride and Nitrate menace in Kerala
-
Fluoride contamination is high in well and tap waters of Alappuzha and Palakkad dist. and tap waters of Thiruvanathapuram (Kalikadu), Wayanad (Kalpetta) districts.
-
Fluoride contamination in drinking water can causes fluorosis, a mottling of the surface of the teeth, osteoporosis and arthritis, hip fractures, cancer, infertility, brain damage, etc.
-
Nitrate is high in the tap and well waters of Alapuzha and one well water sample of Idukki dist. (Old Munnar). Most of the surface water samples are having nitrate value above desirable limit (0.1 mg/L).
-
Nitrate in drinking water can cause blue baby syndrome in infants under six months old. Blue baby syndrome or methemoglobinemia are common symptoms of nitrate contamination. Nitrate contamination in drinking water may also increase cancer risk, because nitrate is endogenously reduced to nitrite and subsequent nitrosation reaction give rise to N- nitroso compounds; these compounds are highly carcinogenic and can act systematically
| River |
Grade of the river |
| Achenkovil |
A |
| Chaliyar |
B |
| Chandragiri |
B |
| Ithikkara |
B |
| Kabbini |
B |
| Kadalundi |
B |
| Kallada |
B |
| Kuttiyadi |
B |
| Manimala |
B |
| Manjeshwar |
B |
| Meenachil |
B |
| Movathupuzha |
B |
| Pallikkal |
B |
| Vamanapuram |
B |
| Bharathapuzha |
C |
| Chalakkudy |
C |
| Karamana |
C |
| Keecheri |
C |
| Neyyar |
D |
| Pamba |
D |
| Periyar |
D |
Note: Based on sampling at 3 or more locations (results at sampling locality)
A = Total Coliforms Organism MPN/100ml: 50 or less
pH between 6.5 and 8.5
Dissolved Oxygen 7mg/L or more
B = Total Coliforms Organism MPN/100ml: 500 or less
pH between 6.5 and 8.5
Nitrate more than 0.1 mg/L
Dissolved Oxygen 5 – 6 mg/L
C= Total Coliforms Organism MPN/100ml > 500
pH not in neutral range
Nitrate more than 0.1 mg/L
Dissolved Oxygen < 5mg/L
D = Total Coliforms Organism MPN/100ml > 750
Nitrate more than 0.1 mg/L
Mixing of sewage/industrial effluents
Alteration of river bed/flow (sand mining, check dam, etc.)
Sampling sites with affected regions
|