Remote sensing is the practice of deriving information about the earth’s features using images acquired from an overhead perspective, using electromagnetic radiation in one or more regions of the electromagnetic spectrum, reflected or emitted from the earth's surface (Ramachandra, 2007). Remote sensing techniques help in acquiring spatial data at various time intervals (temporal data) of earth resources, which aid in inventorying, mapping and sustainable management of resources. It offers a quick and efficient approach to analyze the drivers responsible for land use changes, which has implications on flora and fauna distribution. The multi spectral temporal data are being used effectively for quantification and monitoring of natural resources. This helps in demarcating areas of deforestation, changes in crop productivity, location of groundwater, mineral, oil and other metals, which are required for managing the resources. Remote sensing data and GIS have immense value in mapping of resources and assessment of energy demand on spatial scale. Major application includes:
- Land cover analysis
- Land use classification and evaluation of land resources
- Monitoring and management of natural resources
Geographic Information Systems (GIS) are specialized data systems that preserve location identities of the information they record (Campbell, 1996) and consist of a series of overlays for a specific geographic region. Data for GIS can be derived from many alternative sources. For example, topographic data can be derived from topographic maps (such as of Survey of India toposheets), which also provide information on the streams, highways and forested areas. GPS technology aids as convenient, inexpensive and accurate measurement of absolute location. Remote sensing and GIS technologies have been widely used for different studies across various parts of the Western Ghats.
Remote sensing in the field of conservation and management of natural resources has varied applications. Aerial photography has been used for census of wildlife especially marine mammals, and carnivores in savannas. It is also used in monitoring the movement of wildlife. But the increasing applications of remote sensing have been primarily in the area of plant sciences. Practically most of the work done in remote sensing revolves around vegetation classification, crop monitoring and harvesting, mapping patterns in different forests, range lands, agricultural lands and diseases detection in crops (James, 1996). GIS along with remote sensing data help in inventorying, monitoring and assessing the natural resources on both spatial and temporal scale.
Uttara Kannada district is the northernmost district of Karnataka state and major part of it is covered by the forests. Depending on phenological conditions and other ecological factors, the forests of Uttara Kannada are broadly divided into two types namely Moist and Dry types. The moist type may be sub‑divided into evergreen, semi‑evergreen and moist deciduous whereas the dry type can be divided into dry deciduous and thorny forest. The central part of Uttara Kannada is of evergreen type and is composed of very tall trees, forming a very dense canopy and are many storied and impenetrable. Many studies have been carried out by applying remote sensing and GIS techniques in the district for various purposes.
Prasad and Rao (1987)conducted a remote sensing analysis of Sirsi taluk of Uttar Kannada district by making the used of aircraft fitted Hasselbos cameras. Three sets of flights were made over selected areas in Sirsi and photography was done at the scale of 1:20,000. The study revealed that 50.3% of total study area was forests and 22.7% was occupied by agriculture. Barren and Marshy land, land under public use, Water bodies, orchards, and isolated trees occupied 16.5%, 6.4%, 2%, 1.2% and 0.5% respectively. Akbar Sha (1988), classified the forest Uttara Kannada district based on the density of vegetation as Partially open forest (0.2‑0.4 density), Medium density forest (0.4‑0.8), Closed forest (greater than 0.8). Daniels (1989) classified Uttara Kannada into 5 forest zones namely, the coastal, northern evergreen, southern evergreen, moist deciduous, and dry deciduous zones. Menon and Bawa (1997) inferred that remote sensing imageries can be used to assess the health of forest ecosystem and the extent of degradation. Fuzzy classification models and vegetation indices (i.e. NDVI) were used to estimate regeneration levels, biomass, and species composition at the pixel levels. Udayalaksmi et al (1998) delineated bioclimatic zones by integrating spectrally separable broad forest types from the satellite data, climate data on rainfall, temperature and physiography. Forests of Uttara Kannada were classified based on the forest type, density, rainfall, and temperature.
Ramachandra (2007) assessed the spatial and temporal vegetation changes and land-use pattern in the Uttara Kannada district using GIS, GPS and remote sensing data and found that the district showed a very high vegetative index value implying that the area was heavily forested. The study also highlighted that most of the evergreen forest area in the district was converted to semi-evergreen forest and plantations such as Teak, Arecanut, etc. The study area was also classified into 11 different Land-use classes.
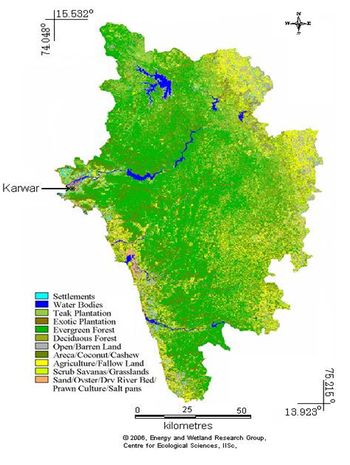
Figure 1: Land-Use map of Uttara Kannada district from IRS 1D, LISS 3 data
Madugundu et al (2008) carried out a study to demonstrate the potentials of Resourcesat-1 (IRS P6) LISS-IV sensor for the estimation of above ground biomass in the Haliyal and Yellapur forest divisions in the central Western Ghats of Uttara Kannada district in Karnataka. Cloud free IRS P6 LISS-IV multi-spectral images were acquired for Yellapur study site from NRSA, Hyderabad and field work was carried out using 30 plots of 20 m x 20 m size. The Field measured LAI (ELAI) measurements on the ground were done using Plant Canopy Analyzer (PCA) 2000. The study area comprised of large and fragmented patches with various crown densities of deciduous forest patches with 42 species of trees and shrubs. The mean value of estimated above-ground biomass and Remote Sensing-based above-ground biomass in the study area was found to be 280 (+ 72.5) and 297.6 (+ 55.2) Mg ha-1 respectively.
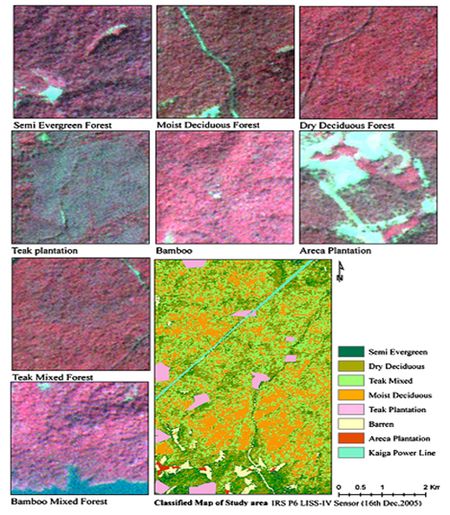
Figure 2: Classified map of land use/land cover changes (Haliyal and Yellapur forest area, Karnataka)(Source - Madugundu et al, 2008)
Hegde et al (1994) estimated the extent and spatial distribution of arecanut plantations in Sirsi taluk of this district using remote sensing techniques. The satellite data of IRS-1A, LISS-II and LANDSAT MSS was obtained and visual interpretation of this data was carried out with areca plantations being identified based in prior developed interpretation key. It was observed that the areca plantations were always found in the valleys, adjacent to the forests, in elongated strips and hence, were easily distinguishable from other plantations. The area under areca plantations was estimated to be 3030.3ha which was about 2.29% of the total geographical area of Sirsi Taluk.
Information about ecological and geographical distribution of species is essential to understand spatial patterns of biodiversity and to chalk out robust conservation strategies (Rushton et al. 2004; Graham et al. 2006). However, for most species, the number and spatial density of confirmed occurrences is very low. Hence ecologists use species distribution models in an attempt to provide predictions of distribution of species over large areas by relating presence/ absence or density of flora and fauna to environmental predictors (Elith et al. 2006). Aggregating results of several species distribution models can improve our understanding of the relationship between environmental parameters and species richness (MacNally & Fleishman 2004).
Ramachandra and Narendra (2007) sampled the ant fauna in various habitats along with mapping the vegetation using remote sensing and GIS to provide an insight into the distribution of ant fauna, endemism and changes in patterns with habitat. The study was carried out in the Linganamakki reservoir of Sharavathi river basin, where the ants were sampled using bait traps, pitfall traps, leaf litter techniques and visual collections and the cloud free IRS-1C satellite multi spectral imagery of LISS III sensors with spatial resolution of 23.5m was used for the Land cover analysis. The study region represents a mosaic of forest types with semi-evergreen to evergreen forests, deciduous forests, agricultural fields, built up regions, scrub lands and wastelands. The ant diversity consisted of 84 species representing 31 genera and 5 subfamilies and the NDVI index showed 70% of the study region to be covered by vegetation. The patterns of ant composition were found to be depending upon the dissimilarity between scrublands, plantations, moist deciduous forests and evergreen forests.
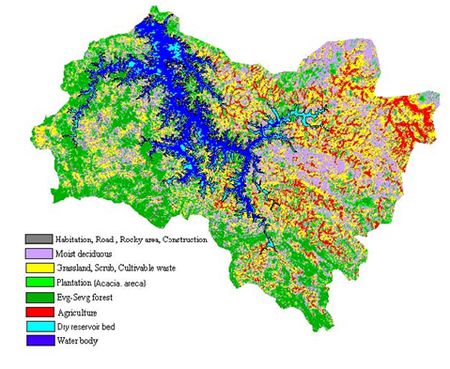
Figure 3: Supervised classification of the Linganamakki catchment of Sharavathi river basin.
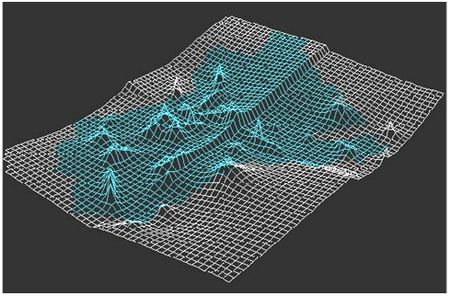
Figure 4: 3-D image of Ants' diversity at the Sharavathi river basin (using GRASS)
Narendra and Ramachandra (2008)explored the potential of the Normalised Difference Vegetation Index (NDVI) data, derived from the Linear Imaging Self-scanning Sensor (LISS) on the Indian Remote sensing Satellite IRS-1D, to distinguish between habitat types used by a variety of ant species to build their nests. According to their analysis, LISS-derived NDVI values highlighted the general trend in supposedly increasing biomass from scrub jungle to evergreen forest. The results pointed out that in the Western Ghats, some ant species and some functional groups established their nests at locations that could be clearly distinguished using LISS-derived NDVI.
Land-use changes influence local biodiversity directly, and also cumulatively, contribute to regional and global changes in natural systems and quality of life. They not only reduce biodiversity of a region, but over time and space, influence on natural resources, hydrology, nutrition cycle, natural habitat, etc. The Western Ghats being one of the global biodiversity hotspots, is reeling under a tremendous pressure from human induced changes in terms of developmental projects like hydel or thermal power plants, big dams, mining activities, unplanned agricultural practices, monoculture plantations, illegal timber logging, etc. This has led to the once contiguous forest habitats to be fragmented in patches, which in turn has led to the shrinkage of original habitat for the wildlife, change in the hydrological regime of the catchment, decreased inflow in streams, human-animal conflicts, etc. Under such circumstances, a proper management practice is called for requiring suitable biological indicators to show the impact of these changes, set priority regions and in developing models for conservation planning. Hence, studies in the recent times have been carried out to assess the influence of land use changes on the biodiversity in the Western Ghats.
Gururaja et al (2008) assessed the diversity and distribution of amphibians and the influence of land use changes on them in the Bedthi, Aghnashini and Sharavathi river basins of the central Western Ghats. They surveyed the amphibians in the region and carried out the Land-use classification using the remote sensing data through supervised classification technique based on Gaussian Maximum Likelihood algorithm. They recorded 46 species of amphibians from the study area of which 59% were endemic to the Western Ghats. Environmental descriptors like canopy, rainfall, etc., land use, fragmentation and landscape metrics were observed to be influencing the endemic species richness and abundance. The study highlighted that the regions with more human induced changes in land-uses, canopy cover and hydrological regimes support and shelter the generalist amphibian species whereas the remnant forest with higher amount of canopy and vegetation had more number of endemic species.
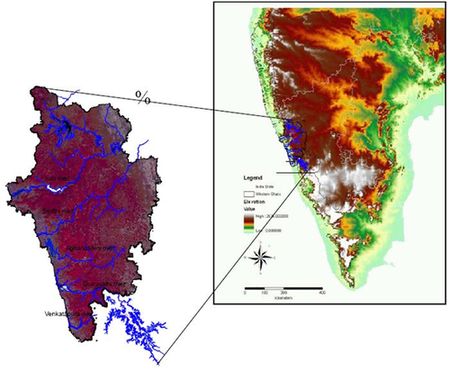
Figure 5: False colour composite image of Uttara Kannada district
Many of the developmental projects in the past have been implemented with little environmental concern in India. The assessment of the projects was based on only technical, economic and political criteria, mainly due to the fact that knowledge of environmental impacts and impact assessment technology were not fully developed at that time. As a result, a number of large-scale development projects led to adverse impacts on the environment. Environmental Impact Assessment (EIA) has gained tremendous importance in nineties and is mandatory for any major developing work in India. An EIA is an effective tool in identifying and evaluating the potential impacts of the project, related to physical, chemical, biological and socio-economic components of the environment and in-turn reducing the likely adverse consequences, by proper mitigation measures, appropriate monitoring as well as auditing programmes. Normally, EIA is vastly implemented prior to project initiation. In absence of such investigations, the scope is expanded to include larger issues, such as biodiversity changes, sustainable development, economic valuation of natural resources and impacts etc., to assess the cumulative impacts. The projects that have not undertaken EIA, during the construction phase can be valued using Cumulative Impact Assessment studies. The Cumulative Impact Assessment or Cumulative Effects Assessment (CEA) considers systematically multiple impact sources, pathways between sources and impact receptors, and direct and indirect, additive and non-additive interactions.
Ramachandra et al (2004) carried out the cumulative impact assessment of the Sharavathi river basin in the central Western Ghats. The land cover and land-use analyses were done with the help of remote sensing data as well as collateral data while GIS was used to integrate remote sensing data with collateral data. The Land use analyses of the upper river basin showed that 25% of the area was under moist deciduous, followed by category II (21%, consisting of grass land, scrub, cultivable waste), evergreen to semi-evergreen (16%), plantations (9.7%), agriculture (8.5%), water body (7.1%), class I (7.14%, habitation, roads, rocky area, etc.) and dry reservoir bed (5.4%). The analyses also revealed extensive fragmentation in the river basin as a consequence of damming the river, conversion of forestlands to agricultural lands, and encroachment etc. the river basin having variety of habitats supported a rich floristic diversity including trees, shrubs, herbs and climbers of which 215 species were recorded in this study. The aquatic biodiversity of the river comprised of 216 species of phytoplanktons, 39 species of zooplanktons and 37 genera of aquatic insects. The Sharavathi river basin also harbors diverse agricultural systems and the study revealed the presence of 59 paddy varieties of which 29 were traditional. The energy survey carried out in 447 households covering 42 villages in the catchment reveal that the majority of the population is dependent on bioresources to meet the daily energy requirements with the major cooking device being the traditional Chula.
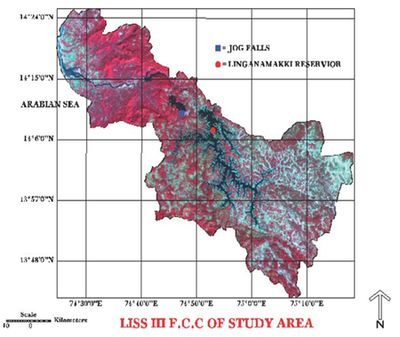
Figure 6: LISS 3 FCC image of Sharavathi River Basin
Bawa et al (2002) demonstrated the potential use of satellite imagery for characterization of areas with high and low species richness of trees in tropical forests where biodiversity losses are high by taking Biligirirangaswamy Temple Wildlife Sanctuary in Karnataka as the study site. They calculated the Normalized Difference Vegetation Index (NDVI), which is an index of green biomass, by using cloud-free IRS 1 C LISS III images from three different seasons. The results showed a positive correlation between the mean NDVI and species richness across all cells, without considering the vegetation types.
Due to wide scale variations in the rainfall in our country, it has become a common practice to construct dams across the rivers for management of water resources and regulating the water flow. However, the water flowing into a dam from surface run-off always carries sediments, which settle down on the bed of the reservoir due to decrease in the velocity of flow and the continued deposition of the sediments result in decreased storage capacity of the dams. Hence, for the proper functioning of the dams, it has become imperative to take into account the rate of sedimentation while constructing a dam. The development of remote sensing techniques has aided in quantifying the sedimentation patterns and monitoring the reservoirs at fixed interval of times.
Durbude and Purandara (2005) assessed the sedimentation pattern in Linganamakki reservoir of the Sharavathi River Basin with the help of remote sensing techniques. The satellite data for nine scenes corresponding to the reservoir levels were procured from NRSA, Hyderabad and the image processing capabilities of GIS software namely Integrated Land and Water Information System (ILWIS) were used to identify the reservoir location and extraction of water spread area of the reservoir. The results showed that the volume of sediment deposition in the zone (533.05 - 548.78 m) under study for the period 1957- 1989 was 58.91 M cure and for the period 1957-2001, it was 74.94 M cum.
Forest fires play an important role in the succession of many forest ecosystems. Hence, it becomes ery essential to understand the ecological changes due to fire and other anthropogenic factors for successful conservation and management of biodiversity. The total extent of forests in Karnataka is 3.87 Mha of which about 45 ha of the forests are under the threat of fire, encroachment, smuggling etc. (Somashekhar et al, 2007). The remote sensing and GIS have proved to be very effective tools in studying the forest fires. Somashekhar et al (2007) monitored the occurrence of forest fires in Bhadra Wildlife Sanctuary in the central Western Ghats of Karnataka state using remote sensing data obtained from Indian Remote Sensing Satellite IRS 1C LISS III for 2000 and 2004. The classification of the forests using the vegetation maps generated by French Institute (1982) for Western Ghats revealed that major proportion of Bhadra WLS was covered with moist deciduous forests followed by dry deciduous forests. The results revealed that the main forest type affected by the fire was Dry deciduous forest followed by grassland and moist deciduous forest. The total extent of area burnt between 9th February and 4th March 2004, was estimated to be 4.46 km2 while the forest area affected during 1st March 2000 was 2.15 km2. Prevailing drought conditions were one of main reasons for aggravating forest fires in the moist and dry deciduous forests during study period.
Somashekhar et al (2009) also used the remote sensing and GIS data for detecting the fire prone zones and identifying the fire intensity zones in the Bandipur National Park in Karnataka. The satellite data of IRS-1C/D LISS III was obtained between 1997 and 2006 from National Remote Sensing Centre (NRSC), Hyderabad and The Survey of India (SOI) toposheets of 1:50,000 scale pertaining to the study area were used for geo-referencing of satellite images, creation of cultural features and ground truth acquisition. The spatial distribution of vegetation types in the nine ranges of Bandipur National Park were broadly classified into four different forest types namely dry deciduous occupying the largest area followed by moist deciduous forest, scrub forest and semi-evergreen forest. The results indicated a significant variation in the fire incidences and the area damaged in different ranges of Bandipur and it was evident from the results that the Bandipur National Park faces the risk of fire almost every year. The moist and dry deciduous forests were found to be falling in the high fire intensity zones while the teak plantations and scrub forests fell under moderate fire intensity zones. Out of 35.14% of the area of national park prone to fire incidence, nearly 14.19 % were low intensity fires followed by 11.94 % of medium and 9.01 % of high intensity.
Defining, mapping and monitoring the land quality play an important role in the use and management of land resources. Large scale land quality changes have taken place in many countries, with most of the land quality declining. The remote sensing and GIS technologies have been very effective tools to generate and update the natural resources information in spatial format at frequent intervals, thus enabling proper monitoring of natural resources (Devi and Kumar, 2008). Thus, an assessment of land quality was carried out in the coffee growing regions viz. Chikmagalur, Kodagu and Hassan districts of Karnataka state using remote sensing techniques and soil studies by (Devi and Kumar, 2008). The image and toposheets of coffee growing areas were collected from Karnataka State Remote Sensing Application Centre and National Bureau of Soil Survey and Land use planning respectively. The images of coffee growing areas were interpreted based on tonal variations to give an insight into land characteristics. The soil samples were collected and analyzed for physio-chemical parameters. The analysis revealed that the coffee growing regions of Gabbugal and Kelagur were having the best land qualities whereas Ballur and Nellikkad were having moderate land qualities.
Kumaraswamy et al (2009) investigated the utility of multi-season NDVI based Mahalanobis distance approach for mapping tree species compositional turnover between forest types and sites at fine scales and at multiple landscape scales. The study was conducted at two protected areas namely Biligirirangaswamy Wildlife Sanctuary and Bhadra Wildlife Sanctuary in the Western Ghats of Karnataka.
References:
- Akbar Shah A. (1988), Integrated development of forests in Western Ghats, Karnataka Forest Department.
- Bawa K., Rose J., Ganeshaiah K.N., Barve N., Kiran M.C. and Umashaanker R. (2002), Assessing Biodiversity from space: an Example from the Western Ghats, India. Conservation Ecology, 6(2): 7.
- Campbell J.,(1996), Introduction to Remote Sensing, Taylor and Francis publication, second edition.
- Daniels R.J.R., (1989),A Conservation Strategy for the Birds of Uttara Kannada district, Ph.D thesis, Centre for Ecological Sciences, Indian Institute of Science, Bangalore, pg.: 27-47.
- Devi G.M.S. and Kumar K.S.A. (2008), Remote sensisng and GIS application for land quality assessment for coffee growing areas of Karnataka. J. Ind. Soc. Remote Sens., 36: 89 – 97.
- Durbude D.G. and Purandara B.K. (2005), Assessment of sedimentation in the Linganmakki reservoir using remote sensing. Journal of the Indian Society of Remote Sensing, 33(4): 503-509.
- Elith J., Graham C.H., Anderson R.P., Dudik M., Ferrier S., Guisan A., et al, (2006), Novel methods improve prediction of species’ distributions from occurrence data. Ecography, 29(2): 129 – 151.
- Graham C.H., Moritz C. and Williams S.E. (2006), Habitat history improves prediction of biodiversity in a rainforest fauna. Proceedings of the National Academy of Science U.S.A, 103(3): 632 – 636.
- Gururaja K. V., Sameer Ali and Ramachandra T. V. (2008), Influence of land-use changes in river basins on diversity and distribution of amphibians. In Environment Education for Ecosystem Conservation, Ramachandra (ed.), Capital publishing company, New Delhi, Pp 33-42.s
- Hegde V. R., Jayaraj K. R., Karale R. L. and Subba Rao P. (1994), Area Estimation of Arecanut Plantations in Sirsi Taluk Using IRS Data. Journal of the Indian Society of Remote Sensing, 22(3): 149-153.
- MacNally R. and Fleishman E. (2004), A successful predictive model of species richness based on indicator species. Conservation Biology, 18(3): 646 – 654.
- Madugundu R., Nizalapur V. and Jha C.S. (2008), Estimation of LAI and above-ground biomass in deciduous forests: Western Ghats of Karnataka, India. International Journal of Applied Earth Observation and Geoinformation, 10: 211 – 219.
- Menon S. and Bawa K.S., (1997), Applications of Geographic Information systems, Remote Sensing, and Landscape ecology approach to biodiversity conservation in the Western Ghats, Current Science, July 25 1997, Vol. 73, pg.: 134-146.
- Narendra A. and Ramachandra T.V. (2008), Remote detection and distinction of ants using nest-site specific LISS-derived Normalised Difference Vegetation Index. Asian myrmecology 2: 51 – 62.
- Prasad S.N. and Rao K.V. (1987), Remote sensing analysis of Sirsi taluk in Uttara Kannada district, CES Technical Report no.35, Centre for Ecological Sciences, Indian Institute of Science, Bangalore.
- Ramachandra T.V., Channdran M.D.S., Sreekantha, Mesta D., Rao G.R. and Sameer Ali (2004), Cumulative impact assessment in Sharavathi river basin. International Journal of Environment and Development, 1(1): 113-135.
- Ramachandra T.V. (2007), Vegetation status in Uttara Kannada district. MJS, 6(7): 1-26.
- Ramachandra T. V. and Narendra A. (2007), Ants Habitat Mapping Using Remote Sensing and GIS, Eco_chronicle 2(3): 115-121.
- Rushton SP, Ormerod SJ and Kerby G, 2004. New paradigms for modelling species distributions? Journal of Applied Ecology, 41(2): 193–200.
- Somashekhar R.K., Nagaraja B.K. and Urs K. (2007), Monitoring of Forest Fires in Bhadra Wildlife Sanctuary. J. Indian Soc. Remote Sens. 36: 99–104.
- Somashekar R.K., Ravikumar P., Mohan Kumar C.N., Prakash K.L. and Nagaraja B.C. (2009), Burnt Area Mapping of Bandipur National Park, India using IRS 1C/1D LISS III Data. . J. Indian Soc. Remote Sens. 37: 37–50.
- Virk R. and King D. (2006), Comparison of techniques for forest change mapping using Landsat data in Karnataka, India. Geocarto International, 21(4): 49 – 57.
