Results and Discussions
Anuran Diversity
Twenty nine species of anurans were recorded from this region belonging to seven families and eighteen genera. This is nearly 19% of Western Ghats amphibians and 10% of Indian amphibians recorded till date. Table 5 details the species list with distribution and threat status. Twenty species among the total of twenty nine species (69%) are endemic (Endemism is categorized into species exclusive to the Western Ghats and Western Ghats-Sri Lanka hotspot). There are four endangered species recorded from DATR.
Table 5. Anuran amphibians recorded from DATR
| Species |
Common name |
Distribution |
Threat status‡ |
| Family: Bufonidae |
Duttaphrynus melanostictus
(Schneider, 1799) |
Common Indian Toad |
India |
Least concerned |
Duttaphrynus scaber
Schneider, 1799 |
Ferguson’s Toad |
Endemic WG-SL |
Least concerned |
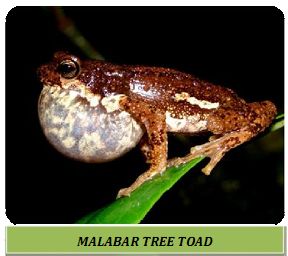
| Pedostibes tuberculosus Gunther, 187 |
Malabar Tree Toad |
Endemic WG |
Endangered |
| Family:Dicroglossidae |
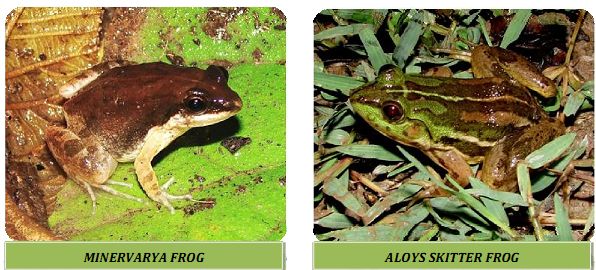
Euphlyctisaloysii
Joshy, Alam, Kurabayashi, Sumida and Kuramoto, 2009 |
Aloys skittering Frog |
Endemic WG |
Data deficient |
| Euphlyctiscyanophlyctis(Schneider, 1799) |
Skittering Frog |
India |
Least concerned |
Fejervaryacaperata
Kuramoto, Joshy, Kurabayashi and Sumida, 2007 |
Wrinkled Fejervarya |
Endemic WG |
Data deficient |
Fejervaryarufescens
(Jerdon, 1853) |
Reddish Burrowing Frog |
Endemic WG |
Least concerned |
| FejervaryaSp. 1 |
|
|
|
| FejervaryaSp. 2 |
|
|
|
Hoplobatrachustigerinus
(Daudin, 1802) |
Indian Bull Frog |
India |
Least concerned |
Minervaryasahyadris
Dubois, Ohler and Biju, 2001 |
Minervarya Frog |
Endemic WG |
Endangered |
| Sphaerothecabreviceps(Schneider, 1799) |
Indian Burrowing Frog |
India |
Least concerned |
| Sphaerothecaleucorhynchus? (Rao, 1937) |
Rao’s Burrowing Frog |
Endemic WG |
Data deficient |
| Family: Microhylidae |
Kaloulataprobanica
Parker, 1934 |
Sri LankanKaloula |
India |
Least concerned |
Microhylaornata
(Dumeril and Bibron, 1841) |
Ornate Narrow-mouthed Frog |
India |
Least concerned |
Microhylarubra†
(Jerdon, 1854) |
Red Narrow-mouthed Frog |
Endemic WG-SL |
Least concerned |
Ramanella marmorata
Rao, 1937 |
Marbled Ramanella |
Endemic WG |
Endangered |
| Family: Nyctibatrachidae |
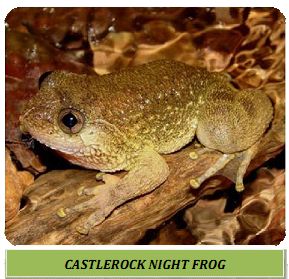
Nyctibatrachus petraeus
Das and Kunte, 2005 |
Castle rock Night frog |
Endemic WG |
Least concerned |
| Family: Ranidae |
|
|
|
Clinotarsuscurtipes
(Jerdon, 1853) |
Bicoloured Frog |
Endemic WG |
Near threatened |
| Hylaranamalabarica (Tschudi, 1838) |
Fungoid Frog |
India |
Least concerned |
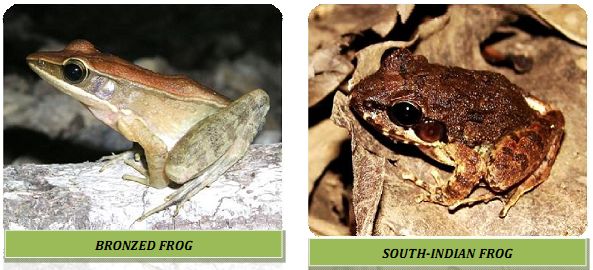
| Hylarana temporalis (Gunther, 1864) |
Bronze Frog |
Endemic WG-SL |
Near threatened |
| Family: Ranixalidae |
|
|
|
Indiranabeddomii
(Gunther, 1875) |
Beddome’s Indian Frog |
Endemic WG |
Least concerned |
| Indirana semipalmata (Boulenger, 1882) |
South Indian Frog |
Endemic WG |
Least concerned |
| Family: Rhacophoridae |
|
|
|
Pseudophilautusamboli
(Biju and Bossuyt, 2009) |
Amboli bush frog |
Endemic WG |
Data deficient |
| Raorchestesbombayensis (Annandale, 1919) |
Maharashtra Bush Frog |
Endemic WG |
Vulnerable |
Raorchestes tuberohumerus †
(Kuramoto and Joshy, 2003) |
Kudremukh Bush Frog |
Endemic WG |
Data deficient |
| Pseudophilautuswynaadensis† (Jerdon, 1854) |
Dark-eared Bush Frog |
Endemic WG |
Endangered |
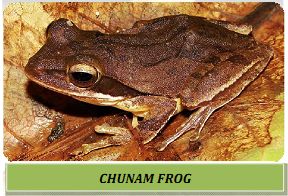
| Polypedatesmaculatus(Gray, 1833) |
Chunam Frog |
India |
Least concerned |
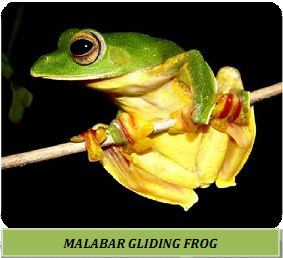
| RhacophorusmalabaricusJerdon, 1870 |
Malabar Gliding Frog |
Endemic WG |
Least concerned |
Note: WG-Western Ghats; WG-SL-Western Ghats and Sri Lanka † opportunistic sightings and not included in further analysis, ‡ based on IUCN, 2009;
Considering number of species in each family, Dicroglossidae represents maximum of 10 species, followed by Rhacophoridae and Microhylidae with six and four species respectively. Nyctibatrachidae is represented by only one species. All species in Nyctibatrachidae, Ranidae and Ranixalidae families are endemics. Dicroglossidae and Microhylidae, even though have more species, but have only 50% of them as endemics. Familial break up of genera, species and endemics are given in Table 6.
Table 6. Species, genera and endemics represented in each family recorded from DATR.
| Family |
Genera |
Species |
Endemics |
| Bufonidae |
3 |
3 |
2 |
| Dicroglossidae |
5 |
10 |
5 |
| Microhylidae |
3 |
4 |
2 |
| Nyctibatrachidae |
1 |
1 |
1 |
| Ranidae |
2 |
3 |
3 |
| Ranixalidae |
1 |
2 |
2 |
| Rhacophoridae |
3 |
6 |
5 |
 Bufonidae
Bufonidae represents three species belonging to two genera. Species in this family are called ‘toads’ and generally prefer terrestrial habitat. Malabar tree toad (Pedostibestuberculosus) is an arboreal toad recorded from DATR. It is an endangered and endemic species.
Dicroglossidae
Maximum species (10) were recorded in this family. This family represents most common and diverse habitat dwellers in a region. They can be observed in majority of the habitats, including human habitations. Minervaryasahyadris being the smallest species in this family, while Hoplobatrachustigerinus (Indian Bull Frog) being the largest. Recently described species, Euphlyctisaloysiiis recorded for the first time from DATR. Burrowing frogs (Sphaerothecabreviceps and S. leucorhynchus?) are also recorded in this family.
Microhylidae
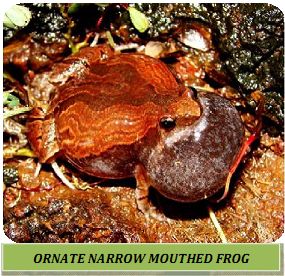 Four species belonging to Microhyla, Kaloula and Ramanella genera are recorded in the present study. Ramanella mormorata (Marbled Ramanella) is an endemic and endangered species recorded in DATR. Microhylidmembers are known for their loud advertisement calls during breeding season. Microhylaornata, M. rubra and Kaloulataprobanica are the other species in this family.
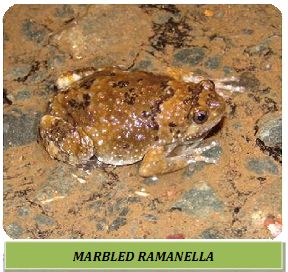
 Nyctibatrachidae
Castle rock night frog (
Nyctibatrachuspetraeus) is the only species observed from this family. This species was discovered from Castle rock in 2005. The species is known lay eggs on leaves and tree trunks.
Ranidae
Bicoloured frog (Clinotarsuscurtipes), Bronze frog (Hylarana temporalis) and Fungoid frog (Hylaranamalabarica) represent Ranidae. Bicoloured frog is the most common species among the three.
Ranixalidae
IndiranabeddomiiandI. semipalmatus represent this family. Members of this family are generally called leaping frogs for their agility. Both species are endemic to the Western Ghats.
Rhacophoridae
Arboreal frogs (Tree and Bush frogs) are members of Rhacophoridae. Raorchestes bombayensis(Maharashtra bush frog), is a species discovered from Castle rock by Annandale in 1919. Amboli bush frog (Pseudophilautus amboli)is a recently described species (Biju and Bossuyt, 2009) recorded from DATR. Malabar gliding frog (Rhacophorusmalabaricus) is an endemic tree frog observed from DATR. Polypedatesmaculatus (Chunam frog) is other tree frog from DATR.
AnuranAbundance
Table 7 provides sampling localities and species abundance recorded in the present study from DATR. Euphlyctiscyanophlyctis is the most abundant and most frequently encountered species. According to IUCN red list (2009), it is least concerned in threat status. Similarly, Nyctibatrachuspetraeus, also a least concerned species is the second most abundant species at DATR. Species total abundance and frequency are illustrated in Figure 4. It is quite evident that high threat status species and endemic species are recorded with low abundance and low frequency, excluding Duttaphrynus scaber, Euphlyctisaloysii, Indiranabeddomii, Kaloulataprobanica and Sphaerothecaleucorhynchus?
Table 7.Anuran abundance in sampling localities at DATR.
| Species |
I |
VII |
X |
XII |
VI |
XVI |
XV |
II |
III |
IV |
V |
XIII |
XIV |
VIII |
IX |
XI |
O_I |
O_II |
O_III |
O_IV |
| Bu_sc |
|
|
|
|
|
|
1 |
|
|
|
|
|
|
|
|
|
|
|
|
|
| Cl_cu |
1 |
|
|
|
2 |
4 |
|
|
|
1 |
|
|
|
|
|
|
|
|
|
|
| Du_me |
|
2 |
|
3 |
2 |
2 |
|
|
|
|
|
2 |
|
2 |
|
1 |
|
|
|
|
| Eu_al |
|
|
|
|
|
|
|
|
|
|
|
|
|
|
|
|
|
|
1 |
|
| Eu_cy |
28 |
12 |
40 |
2 |
10 |
2 |
4 |
|
|
|
16 |
6 |
4 |
2 |
6 |
10 |
28 |
20 |
48 |
|
| Fe_ca |
|
4 |
1 |
|
4 |
|
1 |
1 |
|
|
2 |
|
|
|
3 |
5 |
4 |
|
|
7 |
| Fe_ru |
1 |
|
|
|
|
|
|
|
|
|
|
|
|
|
2 |
1 |
|
|
|
2 |
| Fe_sp1 |
|
|
1 |
|
|
2 |
|
|
2 |
|
|
|
|
2 |
|
23 |
|
|
5 |
3 |
| Fe_sp2 |
|
|
|
|
|
1 |
|
|
|
|
|
|
|
|
|
2 |
|
|
|
|
| Ho_ti |
|
1 |
|
|
|
|
3 |
|
1 |
1 |
|
|
|
2 |
|
|
|
|
|
|
| Hy_ma |
|
|
|
|
|
|
|
|
|
|
|
|
|
|
|
2 |
|
|
|
|
| Hy_te |
|
|
|
2 |
|
|
|
2 |
|
3 |
|
2 |
2 |
|
|
1 |
|
5 |
|
|
| In_be |
|
|
|
|
|
|
|
|
|
|
|
|
1 |
|
|
|
|
|
|
|
| In_se |
|
|
|
|
3 |
|
|
2 |
|
|
2 |
4 |
|
|
|
|
|
6 |
|
|
| Ka_ta |
|
|
|
|
|
|
1 |
|
|
|
|
|
|
|
|
|
|
|
|
|
| Mi_or |
|
6 |
|
|
|
|
3 |
|
|
|
|
|
|
|
2 |
|
|
|
|
|
| Mi_sa |
|
4 |
|
|
|
|
2 |
|
1 |
|
|
2 |
|
|
|
1 |
|
|
|
|
| Ny_pe |
|
|
|
|
|
|
|
3 |
5 |
1 |
3 |
2 |
3 |
11 |
|
1 |
|
15 |
|
3 |
| Pe_tu |
|
|
|
|
|
|
|
|
2 |
|
|
|
|
|
|
|
|
|
|
|
| Ph_am |
4 |
|
1 |
2 |
3 |
|
4 |
6 |
7 |
1 |
4 |
|
|
4 |
|
3 |
|
|
|
6 |
| Ph_bo |
|
|
|
|
2 |
|
3 |
10 |
2 |
1 |
2 |
|
|
|
|
1 |
|
|
|
6 |
| Po_ma |
|
|
|
|
|
|
2 |
|
|
|
|
2 |
|
|
|
1 |
|
|
|
|
| Ra_mo |
|
|
|
|
|
|
1 |
|
1 |
|
|
|
|
2 |
|
|
|
|
|
|
| Rh_ma |
|
|
|
|
|
|
|
|
|
|
2 |
|
|
|
|
|
|
|
|
|
| Sp_br |
|
|
|
|
|
1 |
1 |
|
|
|
|
|
|
|
2 |
|
|
|
|
|
| Sp_le |
|
|
|
|
|
|
1 |
|
|
|
|
|
|
|
|
|
|
|
|
|
Note: Species names are abbreviated with two letters from genus and two from species. Sites with roman numerals are coded in Table 1.
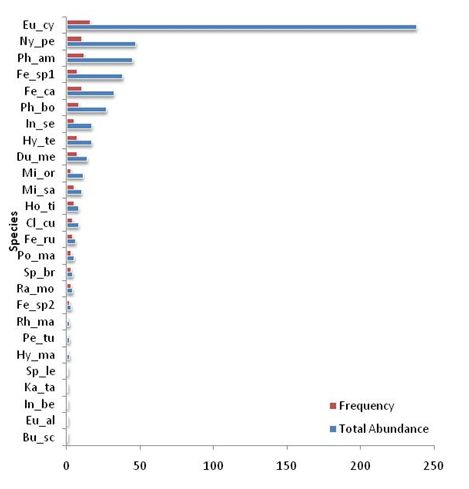
Figure 4. Total abundance and frequency of occurrence in anurans of DATR.
Rank abundance plot is illustrated in Figure 5. As observed in Table 7, rarer species are less abundant and common species are most abundant is clearly depicted in this plot. Most abundant species, in this study, Euphlyctiscyanophlyctis, inhabits in almost all study localities, while rarer species like Pedostibestuberculosus and Rhacophorusmalabaricus are found in particular habitats of very few localities.
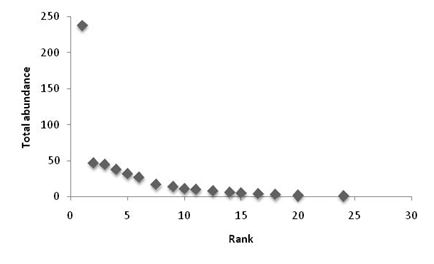
Figure 5. Rank versus total abundance plot of anurans of DATR.
Alpha and Beta Diversity
Table 8a and b provides alpha diversity measures of DATR. Species richness is highest in locality XI and XV with 13 species. It was least in O_I with 2 species. Shannon’s and Simpson’s diversity index also reveal the same with highest index value for site XI and XV. It is very interesting to note that, despite low species richness, site XII has evenly distributed species abundance (0.98), followed by site O_IV (S=6, E=0.91) and site XIV (S=4, E=0.9).
Table 8a. Alpha diversity measures of anuran amphibians at DATR.
| Indices |
I |
VII |
X |
XII |
VI |
XVI |
XV |
II |
III |
IV |
| Species richness |
4.00 |
6.00 |
4.00 |
4.00 |
7.00 |
6.00 |
13.00 |
6.00 |
8.00 |
6.00 |
| Shannon’s |
0.62 |
1.54 |
0.33 |
1.37 |
1.75 |
1.68 |
2.42 |
1.52 |
1.82 |
1.67 |
| Simpson’s |
1.44 |
3.88 |
1.15 |
3.86 |
4.63 |
4.80 |
9.99 |
3.74 |
4.96 |
4.57 |
| Evenness |
0.46 |
0.78 |
0.35 |
0.98 |
0.82 |
0.89 |
0.86 |
0.76 |
0.77 |
0.88 |
Table 8b. Alpha diversity measures of anuran amphibians at DATR.
| Indices |
V |
XIII |
XIV |
VIII |
IX |
XI |
O_I |
O_II |
O_III |
O_IV |
| Species richness |
7.00 |
7.00 |
4.00 |
7.00 |
5.00 |
13.00 |
2.00 |
4.00 |
3.00 |
6.00 |
| Shannon’s |
1.54 |
1.83 |
1.28 |
1.67 |
1.49 |
1.85 |
0.38 |
1.23 |
0.40 |
1.70 |
| Simpson’s |
3.24 |
5.56 |
3.33 |
3.98 |
3.95 |
3.99 |
1.28 |
3.08 |
1.25 |
5.10 |
| Evenness |
0.67 |
0.89 |
0.90 |
0.75 |
0.89 |
0.49 |
0.73 |
0.86 |
0.50 |
0.91 |
Beta diversity measure based on Bray-Curtis similarity values are given as dendrogram in Figure 6. All the twenty sites are clustered into five groups based the similarity between sites. Maximally dissimilar sites, namely, XVI, XII, XIII, XIV and IV form one cluster, while maximally similar sites, X, O_III, O_I and I for another cluster. O_II stands out separate among all sites. XV, II, O_IV, III and VIII forms fourth cluster and finally, VI, V, VII, XI and IX forms fifth cluster. Species richness is poor in maximum similarity sites and is governed by the abundance of Euphlyctiscyanophlyctis in these sites. Low abundance and higher species richness marks the maximally dissimilar sites, attributed to the difference in species composition and low abundance in each species.
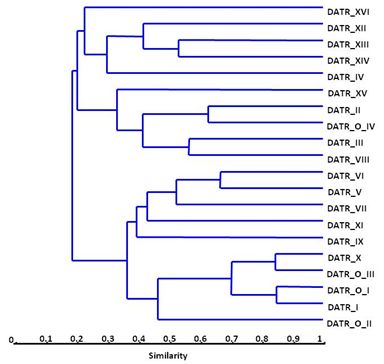
Figure 6. Dendrogram of Bray-Curtis similarity values for all sites in DATR.
Anuran Distribution
Anuran distribution is illustrated in Figure 7. Species richness and endemic species are marked on the sampling localities both within and outside DATR. Total richness and endemic species were high in sites III, V, VI, XI and XV, where as I, VII, XII, X, XVI, O_I, O_II and O_III were low in species richness as well as in endemic species. The low richness localities are either Agriculture or Mining areas, while high richness areas belong to water, forest or plantations.
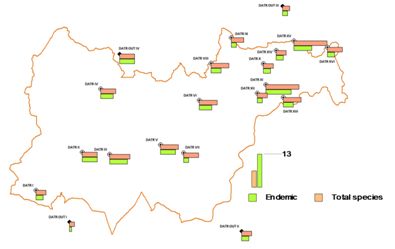
Figure 7. Anuran distribution in sampling localities of DATR. Maximum bar length indicates 13 species.
Land-use land-cover analysis
Land-cover analysis based on NDVI provided vegetation and non-vegetation cover in the study region. Figure 8 depicts NDVI for DATR. DATR has 98% area in vegetation cover (irrespective of whether natural or artificial) and remaining 2% are in agriculture fallow lands, dry river bed, sand, and waterbodies. Value ranges from -1 to 1, where in values from 0 to -1 indicates non-vegetated areas, 0 to 1 indicates vegetated areas. Eastern part of the DATR, especially near Ambikanagar, Kulgi, Bhagavati, BP dam areas are relatively poor in vegetation. Such non-vegetated areas are also on KumbarvadaJoida section, Gund, Ulvi and Anshi area, attributed mainly to agriculture clearings and dry river beds.
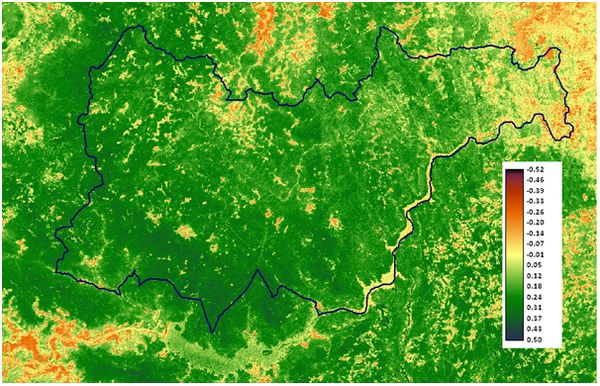
Figure 8. Normalized difference vegetation index (NDVI) of DATR.
Based on fuzzy supervised classification approach, land-use analysis of DATR was carried out. Error matrix is provided in Table 9. Kappa statistic (the measure of agreement between ground truth and computer based classification) is calculated using K= Pr(a)-Pr(e)/(1-Pr(e)), wherePr(a) is the relative observed agreement among classes, and Pr(e) is the hypothetical probability of chance agreement, using the observed data to calculate the probabilities of each classification randomly in each category. If the overall classification are in complete agreement then κ = 1. If there is no agreement among the classification and ground truth, then κ ≤ 0. In the present classification, κ=0.89. Overall accuracy is 92.83% computed using agreement in classification divided by total number of pixels.
Table 9. Error matrix computed for fuzzy classification technique used for land-use classification.
| Ground truth |
| Fuzzy classification |
Class |
1 |
2 |
3 |
4 |
5 |
6 |
7 |
8 |
9 |
10 |
Total |
EC |
| 1 |
448 |
6 |
1 |
12 |
24 |
46 |
24 |
3 |
3 |
2 |
569 |
0.2127 |
| 2 |
0 |
1239 |
0 |
0 |
0 |
0 |
0 |
17 |
75 |
3 |
1334 |
0.0712 |
| 3 |
0 |
0 |
20655 |
0 |
0 |
0 |
0 |
0 |
0 |
0 |
20655 |
0 |
| 4 |
0 |
0 |
0 |
747 |
0 |
0 |
0 |
0 |
0 |
0 |
747 |
0 |
| 5 |
0 |
0 |
0 |
0 |
2222 |
17 |
0 |
0 |
12 |
0 |
2251 |
0.0129 |
| 6 |
12 |
0 |
0 |
0 |
27 |
492 |
3 |
0 |
0 |
0 |
534 |
0.0787 |
| 7 |
37 |
1 |
0 |
0 |
0 |
5 |
559 |
0 |
1 |
0 |
603 |
0.073 |
| 8 |
0 |
204 |
0 |
1 |
0 |
0 |
0 |
3178 |
727 |
93 |
4203 |
0.2439 |
| 9 |
1 |
679 |
0 |
0 |
7 |
0 |
0 |
303 |
3367 |
14 |
4371 |
0.2297 |
| 10 |
0 |
0 |
0 |
0 |
0 |
0 |
0 |
184 |
17 |
265 |
466 |
0.4313 |
| Total |
498 |
2129 |
20656 |
760 |
2280 |
560 |
586 |
3685 |
4202 |
377 |
35733 |
|
| EO |
0.1004 |
0.418 |
0 |
0.0171 |
0.0254 |
0.1214 |
0.0461 |
0.1376 |
0.1967 |
0.2971 |
|
|
Note: 1-Builtup, 2-Scrub, 3-Waterbodies, 4-Agriculture (Wet), 5-Agriculture (Dry), 6-Dry riverbed, 7-Grassland, 8-Forest (dense), 9-Forest (sparse), 10-Plantation (Areca, Coconut,etc.); EC-Error of commission, EO-Error of omission.
Figure 9 illustrates the land-use classification of the region and details of each land-use class are provided in Table 10. Note: Overall area from the cropped area of DATR is 879.48sq.km, which is 64.59sq.km more than actual area of DATR. This could be due to boundary delineation. The boundary was re-digitised considering half of the River Kali as part of DATR, which was along the bank in earlier boundary provided. Nearly 98% of the region is covered with vegetation, among this; dense forest occupies nearly 57% followed by spare forest 26.5%. Plantation including Acacia/Areca/Coconut, etc., has 8.69% cover in DATR. Built-up occupies 0.5% of the area, indicating that DATR still has not been invaded by human habitation. It is also evident with almost 1% of area under agriculture. Hence, DATR is one of potential protected area in the northern Western Ghats for conservation priority. On careful examination, eastern part of DATR is predominant with sparse forest (logged/teak plantation). This is due to selective logging and teak plantation in the region in early 1980’s. Anshi, Ulvi, Gund, Ambikanagar, Kulgi, and places near Kumbarwada have agriculture areas. West, South, North-western and south-western parts are among the very less disturbed regions in DATR. It is a very good initiative from Forest Department, Government of Karnataka, to include regions up to Kadra in south and up to Diggi in North, which are also of less disturbed forested areas in the vicinity.
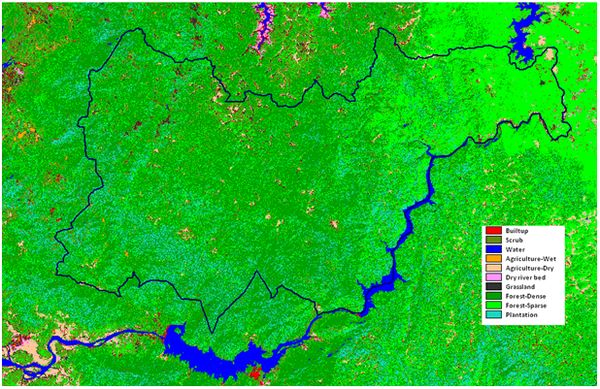
Figure 9. Fuzzy based supervised classification of DATR region.
Table 10. Fuzzy classified land-use composition in DATR. Values are in sq.km and percentage.
| Class |
Area (in sq.km) |
Percentage |
- Built-up
|
4.57 |
0.52 |
- Scrub
|
35.45 |
4.03 |
- Waterbodies
|
5.37 |
0.61 |
- Agriculture (wet)
|
0.79 |
0.09 |
- Agriculture (dry)
|
8.19 |
0.93 |
- Dry riverbed
|
0.84 |
0.10 |
- Grassland
|
10.69 |
1.22 |
- Forest (dense)
|
503.87 |
57.29 |
- Forest (sparse)
|
233.26 |
26.52 |
- Plantation
|
76.45 |
8.69 |
| Total |
879.48* |
100.0 |
Note: Difference of 64.59sq.km to the actual area of DATR. Refer text for explanation.
Relationship between Habitat Variables and Anuran Abundance
The ordination diagram, with points of species (Figure 10), sites (Figure 11) and classes of qualitative habitat variables (Figure 11) illustrates relationship of each other. Niche centres along each axis (Axis 1 and 2) represents species point, which is determined by weighted average of axis values of sites in which they occur. Hence, each species point in this ordination diagram is at the centroid of sites points in which they were recorded. It is also indicative of relative locations of their two dimensional niches. In Figure 10, Euphlyctiscyanophlyctis and E. aloysii, despite being difference in their endemism, they form a cluster as they share similar habitat (aquatic) and also have similar tadpole development (aquatic). Except for Pedostibestuberculosus and Indiranabeddomii, other species have formed their cluster of unique niches. First three axes scores are given in Table 11.
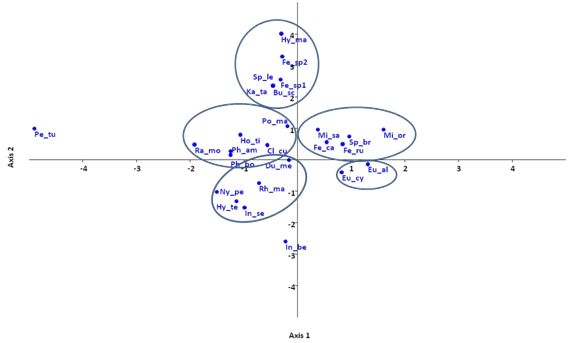
Figure 10. CCA ordination plot of species recorded at DATR.
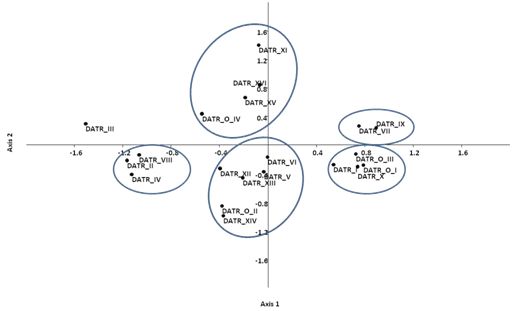
Figure 11. CCA ordination plot of sampling sites of DATR.
Table 11. CCA scores of each species along three canonical axes.
| Species |
Axis 1 |
Axis 2 |
Axis 3 |
| Bu_sc |
-0.45 |
2.34 |
-5.01 |
| Cl_cu |
-0.56 |
0.46 |
-0.88 |
| Du_me |
-0.15 |
-0.01 |
-1.34 |
| Eu_al |
1.32 |
-0.15 |
0.93 |
| Eu_cy |
0.82 |
-0.41 |
0.24 |
| Fe_ca |
0.55 |
0.55 |
0.08 |
| Fe_ru |
0.85 |
0.49 |
0.62 |
| Fe_sp1 |
-0.31 |
2.54 |
1.60 |
| Fe_sp2 |
-0.27 |
3.28 |
1.23 |
| Ho_ti |
-1.05 |
0.78 |
-2.67 |
| Hy_ma |
-0.30 |
4.01 |
2.44 |
| Hy_te |
-1.14 |
-1.33 |
0.18 |
| In_be |
-0.23 |
-2.61 |
1.25 |
| In_se |
-0.98 |
-1.53 |
0.07 |
| Ka_ta |
-0.45 |
2.34 |
-5.01 |
| Mi_or |
1.61 |
0.96 |
-3.27 |
| Mi_sa |
0.39 |
0.95 |
-2.39 |
| Ny_pe |
-1.50 |
-1.03 |
0.37 |
| Pe_tu |
-4.89 |
0.99 |
-1.55 |
| Ph_am |
-1.24 |
0.25 |
-0.25 |
| Ph_bo |
-1.24 |
0.14 |
0.21 |
| Po_ma |
-0.18 |
1.07 |
-2.09 |
| Ra_mo |
-1.92 |
0.47 |
-1.86 |
| Rh_ma |
-0.71 |
-0.75 |
0.16 |
| Sp_br |
0.97 |
0.73 |
-2.32 |
| Sp_le |
-0.45 |
2.34 |
-5.01 |
| Eigenscores |
0.37 |
0.35 |
0.30 |
Similar to species ordination, site coordinates are the values of sites on the two best axes, which are standardized to zero weighted mean and unit weighted variance. Figure 11 illustrates the ordination plot of sites of DATR. First three axes scores are given in Table 12. Sites having similar habitat variables, altitude and species richness have formed unique clusters.
Table 12. CCA scores of each sampling sites along three canonical axes.
| Sites |
Axis 1 |
Axis 2 |
Axis 3 |
| DATR_I |
0.54 |
-0.28 |
0.16 |
| DATR_VII |
0.75 |
0.26 |
-1.08 |
| DATR_X |
0.74 |
-0.31 |
0.26 |
| DATR_XII |
-0.40 |
-0.33 |
-0.41 |
| DATR_VI |
-0.01 |
-0.18 |
-0.07 |
| DATR_XVI |
-0.07 |
0.84 |
-0.30 |
| DATR_XV |
-0.19 |
0.66 |
-1.68 |
| DATR_II |
-1.17 |
-0.22 |
0.09 |
| DATR_III |
-1.51 |
0.29 |
-0.30 |
| DATR_IV |
-1.13 |
-0.42 |
-0.34 |
| DATR_V |
-0.03 |
-0.38 |
0.16 |
| DATR_XIII |
-0.21 |
-0.47 |
-0.44 |
| DATR_XIV |
-0.37 |
-1.00 |
0.37 |
| DATR_VIII |
-1.07 |
-0.14 |
-0.20 |
| DATR_IX |
0.90 |
0.24 |
-0.55 |
| DATR_XI |
-0.08 |
1.40 |
0.81 |
| DATR_O_I |
0.79 |
-0.29 |
0.22 |
| DATR_O_II |
-0.38 |
-0.86 |
0.25 |
| DATR_O_III |
0.73 |
-0.13 |
0.38 |
| DATR_O_IV |
-0.55 |
0.44 |
0.28 |
Triplot of habitat variables, sites and species occurrence is illustrated in Figure 12. Variables like altitude, habitat, threat status, endemics, endemism, tadpole habitat and species richness are highly correlated with axis 1. CCA scores of first three axes are given in Table 13. Species and sampling sites in this ordination are positively influenced by aforesaid habitat variables. Stream, rainfall, land-use land-cover and canopy are negatively correlated with axis 2. Negative correlation is strong with canopy than any other variable. It is also interesting to note that, species like E. cyanophlyctis, E. aloysii, Minervaryasahyadris, Microhylaornata, Fejervaryacaperata, F. rufescens and Sphaerothecabreviceps seemed to be independent of the influence of these habitat variables. Maximum conservation priority must be given to regions having higher influence from the habitat variables and species endemism. These priority regions in DATR are all the fourteen localities apart from agriculture dominated areas like Ulvi, Goira village, Amgaon village, water body near Patoli cross.
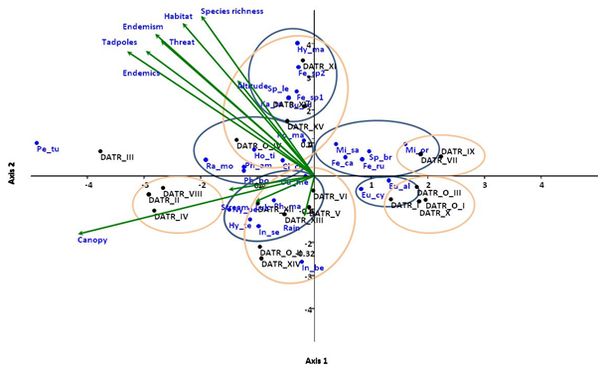
Figure 12. Triplot of CCA showing sampling sites, species and habitat variables.
Table 13. CCA scores of habitat variables explained in first three axes.
| Habitat variables |
Axis 1 |
Axis 2 |
Axis 3 |
| Altitude (m asl) |
-0.22 |
0.40 |
-0.31 |
| Rainfall (annual, mm) |
-0.03 |
-0.17 |
0.28 |
| Land-use land-cover |
-0.17 |
-0.11 |
0.13 |
| Stream |
-0.24 |
-0.06 |
0.11 |
| Canopy |
-0.67 |
-0.25 |
-0.06 |
| Species richness |
-0.32 |
0.68 |
-0.33 |
| Endemic richness |
-0.53 |
0.53 |
0.08 |
| Endemism |
-0.45 |
0.60 |
-0.08 |
| Threat |
-0.43 |
0.57 |
-0.38 |
| Habitat |
-0.37 |
0.65 |
-0.35 |
| Tadpole habitat |
-0.48 |
0.53 |
-0.19 |