Materials and Methods
Study area
Dandeli Wildlife Sanctuary (DWS) and Anshi National Park (ANP), encompassing 475.02sq.km and 339.87sq.km respectively, were declared as Dandeli Anshi Tiger Reserve (DATR) on 4th January 2007 (Vide GO No. FEE 254 FWL 2006) with total area of 814.89sq.km. This region falls in the Western Ghats Protected Area Network. DATR is located in Uttara Kannada district of Karnataka state between 14.9564°-15.33227°N latitude and 74.2521°-74.7196°E longitude. In 1956, DWS was declared as a game sanctuary covering an area of 127.71sq.km. In 1975, the area was declared as a wildlife sanctuary and it was expanded to 5,729.07sq.km. In 1987, the wildlife sanctuary was divided into two protected areas: ANP and DWS, reducing the area of DWS to 834.157sq.km. In 1994, DWS was reduced again to 475.02sq.km. The present DATR boundary is based on Govt. of Karnataka order in 1998 (Figure 1). For more detailed account please refer to Tiger Conservation Plan (2008-2018). DATR forms major catchment area for River Kali with tributaries like Nagazhari and Kaneri.
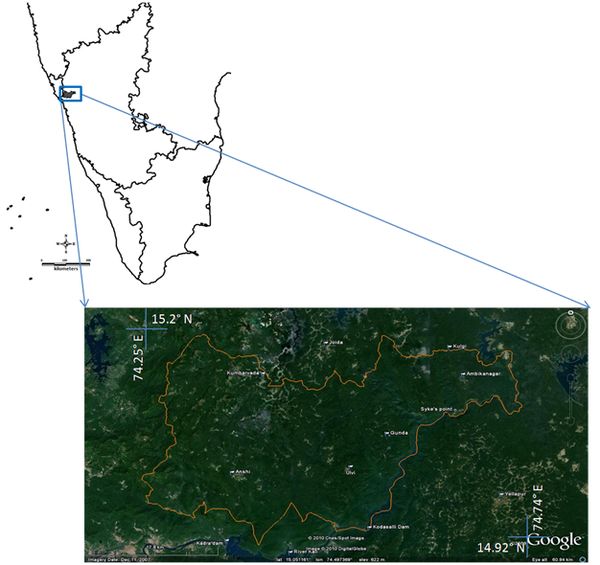
Figure 1. Boundary of Dandeli-Anshi Tiger Reserve. Image Source: Google
Vegetation: The area of study is covered by moist deciduous and tropical semi-evergreentype of forests. There is a gradation of forest from moist deciduous with bamboo in eastern parts (Kulgi, Ambikanagar, Phansoli, Gund and Ulvi) to semi-evergreen in western parts (Kumbarwada, Amboli, Nujji, Badapoli and Anshi). According to Pascal (1988), the forest type in the Dandeli Wildlife Sanctuary, consists of Lagerstroemiamicrocarpa-Tectonagrandis-Dileniapentagynawith a very abundant population of bamboo (Bamboo sp). According to Champion and Seth (1968), five types of forests are identified in the DATR, namely, i) south Indian moist deciduous teak forest; ii) southern moist mixed deciduous forests; iii) west coast semi-evergreen forests; iv) moist bamboo brakes and v) cane brakes. However, this classification requires a proper ground truth in the present from DATR.
Climate and Geology: Seasonality is marked in DATR with pre-monsoon(March-June), monsoon (July-October) and post-monsoon (November-February) periods respectively. The south-west monsoon brings heavy rainfall in DATR with an average 2500mm (range 1250-4000mm). Rainfall gradient is very distinct in DATR with ≥5000mm on the Western part which gradually becomes ≤2000mm on the eastern part. Temperature varies from 13°C to 37°C, January and February being coldest and April and May being the warmest.
The rocks have undergone laterization to varying degrees in DATR. Gneiss is the underlying rock. It is often foliated and mixed with shale and mica schist. It isimportant to point that the economically important ore that are found in this area are: iron,manganese, bauxite, limestone and clay.In the area soils are mainly lateritic soils, clayey rich in humus and well drained.
The average elevation of the area is 473 meters (minimum 40 m in Kali River, maximum 943 m in Dhavarlitemba). The Kali River and its tributaries (NagazhariHalla, SatkhandaHalla, and ShivapurHalla) originate in DWS. The Kali River is one of many rivers that flow in the Western Ghats. It is 184 km long and flows into the Arabian Sea.
Amphibian Sampling
Sixteen sampling localities within DATR and four localities outside DATR were marked randomly with systematic stratified sampling method. Stratification is based on the land-use categories, namely, Forest, Teak/plantation, Water-bodies, Agriculture and Mining. Based on the percentage land-use composition, sampling is weighted accordingly, with ten sampling localities in forest, followed by water, plantation and agriculture with three each and one sampling in defunct mining areas. Table 1 and Figure 2 depict the sampling localities of the study area.
Table 1: Sampling plots for amphibian survey at DATR.
| Place |
Code |
Latitude (°N) |
Longitude (°E) |
Altitude (m) |
Remarks |
| Within DATR |
| Goira |
DATR I |
14.96194 |
74.28962 |
47 |
Agriculture |
| Badapoli |
DATR II |
15.01441 |
74.35596 |
532 |
Forest |
| Anshi |
DATR III |
15.01148 |
74.39502 |
529 |
Forest |
| Jhalavali |
DATR IV |
15.10174 |
74.38209 |
546 |
Forest |
| Kaneri bridge |
DATR V |
15.02469 |
74.46763 |
527 |
Forest |
| Cyntheri rock |
DATR VI |
15.08591 |
74.52303 |
446 |
Plantation |
| Ulvi |
DATR VII |
15.01365 |
74.50061 |
634 |
Agriculture |
| Gunda road |
DATR VIII |
15.13708 |
74.53978 |
483 |
Forest |
| Water |
DATR IX |
15.17264 |
74.56855 |
578 |
Water |
| Amgaon |
DATR X |
15.13677 |
74.61419 |
556 |
Agriculture |
| Water |
DATR XI |
15.10789 |
74.61771 |
563 |
Water |
| Mines |
DATR XII |
15.09609 |
74.60576 |
659 |
Mining |
| Nagazhari |
DATR XIII |
15.09002 |
74.64248 |
181 |
Forest |
| Nagazhari |
DATR XIV |
15.15467 |
74.63223 |
394 |
Forest |
| Kulgi |
DATR XV |
15.16804 |
74.65769 |
500 |
Plantation |
| Virnolii |
DATR XVI |
15.15933 |
74.7055 |
456 |
Plantation |
| Outside DATR |
| Sakatihalla |
DATR OUT I |
14.9185 |
74.33778 |
30 |
Forest |
| Beegaru |
DATR OUT II |
14.90581 |
74.58308 |
283 |
Forest |
| Kanshirda Lake |
DATR OUT III |
15.21615 |
74.64164 |
479 |
Water |
| Deriye |
DATR OUT IV |
15.15003 |
74.4089 |
592 |
Forest |

Figure 2. Amphibian sampling localities in DATR. Image Source: Google
In the selected sampling sites, anurans were systematically sampled between 18:30-20:30hr from June-September 2008 and June-September 2009. Amphibians have been sampled similarly outside the DATR since 2007 in a project on Kali river catchment. Apart from these systematic surveys, opportunistic samplings were also done both in breeding and non-breeding period so as to include most of the species in the region. Visual encounters, calls, tadpoles, foam nests, spawn would be used to record the anurans in the field. Two man hours of searching is made using torch lights by walking across the streams, forest floors, gleaning leaf litters, prodding bushes, wood logs, rock crevices etc.
Species were measured (snout-vent length and weight) and released back. All species encountered are identified up to species level using the keys of Bossuyt and Dubois (2001), Daniels (2005) and Biju and Bossuyt (2009). In cases of likely new species, voucher specimens up to 6 individuals werepreserved in 70% alcohol morphological and molecular analysis in due course of time.
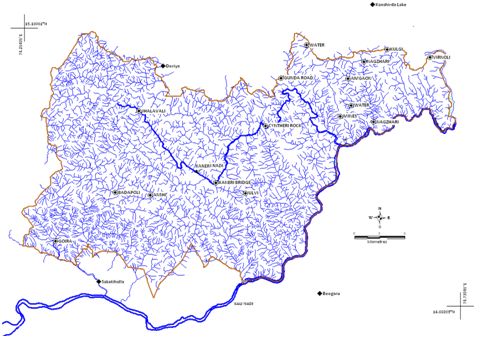
Figure 3. Drainage network of DATR with sampling localities.
Land-use and land-cover (LULC) Analysis
Multispectral satellite remote sensing images (IRS P6, LIS 3, 23.5m resolution) of 6 and 11 January 2004 were procured from National Remote Sensing Centre (NRSC), Hyderabad. Path and row corresponding to DATR were in three scenes, namely, 97:63, 97:62 and 96:62. These images were geo-corrected referring Survey of India toposheets (scale, 1:50 000; 48 I/8, I/12, J/5 and J/9) in IDRISI® remote sensing software. Band 2, 3 and 4 corresponding to green, red and near-infra red (electromagnetic spectrum of 0.5-0.6, 0.6-0.7 and 0.7-0.9µm respectively) were used for false colourcomposite(FCC) generation. Land-cover analysis was done using vegetation index. The analogous behavior of red (R) and near infrared (NIR) bands over vegetated areas is used in this index, which clearly demarcates vegetated and non-vegetated areas. Normalized difference vegetation index (NDVI) based on the following formula, NDVI=(NIR-R)/(NIR+R). The output image values ranges from -1 to +1, wherein -1 indicates bare soil and +1 indicates complete vegetation. Land-use analysis was based on fuzzy classifiers of supervised classification approach. Ground truth data was used to assign a particular land-use. Fuzzy classification has yielded higher overall accuracy and Kappa statistic than most commonly used maximum likelihood approach.
Habitat Variables
Altitude (meters above sea level), rainfall (annual, mm), stream perenniality (seasonal or perennial), canopy cover (open, partial or closed) and predominating land-use (from the LULC analysis) are used to determine anuran distribution. These habitat variables were graded from lowest to highest. For the analysis, these grades are used than the actual values. Details of gradation are given in Table 2.
Table 2.Habitat variables with their grades.
| Variable |
Range |
Grade |
| Altitude (m asl) |
<150 |
1 |
| |
150-300 |
2 |
| |
300-450 |
3 |
| |
450-600 |
4 |
| |
>600 |
5 |
| Rainfall (mm annual) |
<2000 |
1 |
| |
2000-4000 |
2 |
| |
>4000 |
3 |
| Stream persistence |
Seasonal |
1 |
| |
Perennial |
2 |
| Landuse |
Mining |
1 |
| |
Agriculture |
2 |
| |
Plantation/Teak |
3 |
| |
Water bodies |
4 |
| |
Forest |
5 |
| Canopy cover |
Open |
1 |
| |
Partial |
2 |
| |
Closed |
3 |
Ecological Guild Analysis
For understanding complex patterns in biogeography, evolution and community structure, putting species into ecologically similar groups or guilds, irrespective of their taxonomic position has been an extremely useful tool (
Wiens, 1989). Guild classification is also used to gain a greater understanding of spatial patterns of species richness and assemblage structure (
Williams, 1997). Anuran amphibians in this study were classified into guilds on the basis of four variables describing their functional ecology, namely, endemism (referring to their spatial extent of occurrence), threat status (based on IUCN red data base, 2009), habitat specificity (aquatic to arboreal, considering aquatic to be very primitive) and finally tadpole habitat (direct development being considered most advanced). Table 3 details the ecological guild classification in the present study.
Table 3. Ecological guild gradation used in the present study.
| Variable |
Range |
Grade |
| Endemism |
Non-endemic |
1 |
| |
India |
2 |
| |
Endemic to Western Ghats-Sri Lanka Hotspot |
3 |
| |
Endemic to the Western Ghats |
4 |
| Threat status |
Data deficient |
1 |
| |
Least concerned |
2 |
| |
Near threatened |
3 |
| |
Vulnerable |
4 |
| |
Endangered |
5 |
| Habitat specific |
Aquatic |
1 |
| |
Semi-Aquatic |
2 |
| |
Terrestrial |
3 |
| |
Fossorial |
4 |
| |
Arboreal |
5 |
| Tadpole |
Aquatic |
1 |
| |
Semi-aquatic |
2 |
| |
Arboreal/Direct development |
3 |
Diversity Measures
Alpha (α) diversity is a measure of species diversity in a given habitat. It is measured both parametrically and non-parametrically. A simple species-abundance curve is a parametric measure of alpha diversity. Shannon’s and Simpson’s index are non-parametric measure of the same. Evenness is measured so as to know how evenly species are distributed in a locality. Beta (β) diversity is the measure of degree of variation in diversity from two habitats, patches or communities. Bray-Curtis similarity measure is used to calculate beta diversity. These indices were measured using formula given in Table 4.
Table 4.Alpha and beta diversity measures used in the present study.
| Index |
Equation |
Remarks |
Reference |
| Shannon’s |
H’= -Σpilnpi |
pi is the proportional value of the ith species. Value ranges from 0-4.6 |
Ali et al., 2007 |
| Simpson’s |
D=1/Σpi2 |
pi is the proportional value of the ith species. |
Ali et al., 2007 |
| Evenness |
E=H’/lnS |
H’ is Shannon’s index, S is species richness |
Ramachandra et al., 2006 |
| Bray-Curtis |
Bc=b+c/2a+b+c |
a is species common to both sites A and B, b is species unique to Site A and C is species unique to site B. |
Ramachandra et al., 2006 |
Statistical Analysis
Ecological data are quite distinct from the multivariate data for the following two reasons. First, most species occur only in a subset of the samples; hence they are indicative more of either presence or absence. Second, relationships between species and environmentalvariables are generally nonlinear, and non-monotonic. These two features make very difficult to analyze ecological data using linear based multivariate statistics like Principal component analysis. Canonical correspondence analysis (CCA) based on weighted averaging and ordination of reciprocal averaging of species and environmental data helps to elucidate the relationshipsbetween biological assemblages of species and their environment. Relationship between habitat variables, sampling localities and species abundance was estimated through CCA using PAST ver1.98 (Hammer et al., 2001). CCA is a direct gradient analysis, where the gradient in environmental variables is known a priori and the species abundances are considered to be a response to this gradient (Legendre and Legendre, 1998). It is a multivariate methoddesignedtoextract synthetic environmental gradients from ecological data-sets.
