| Sahyadri Conservation Series - 6 |
ENVIS Technical Report: 22, February 2012 |
 |
CONSERVATION OF ENDANGERED FAUNA IN SHARAVATHI RIVER BASIN, CENTRAL WESTERN GHATS |
 |
|
|
METHOD
This involved the following tasks:
- Exploratory survey: It was carried out throughout the river basin to find out the habitats preferred by Lion Tailed Macaque (LTM) and the catchment status.
- Consultation with the experts and local people.
- Mapping its distribution with the help of GPS in the field
- Analyses of entire catchment using already classified remote sensing data (supervised classification)
General forest types and classification:
Plant identification using standard keys from published literature on flora
| Survey |
Method |
| Mapping of LTM distribution in the Sharavathi River Basin |
Transect based sampling - using binoculars, GPS and maps |
| Habitat Identification |
Field visits – reconnaissance survey |
| Vegetation Sampling |
Transect based Quadrat method |
Vegetation Identification
- Phenological, Morphological
- Physiological, Anatomical.
|
Fieldwork, Literature, Consultation with the experts and Local people. |
| General information about LTM |
Literature |
| Identification of the Animal |
Field visits |
| Conservation of the animal |
Literature, fieldwork, data analyses in consultation with experts |
Vegetation sampling in the Sharavathi river basin: The methodology used for sampling the vegetation is a combination of transects (line laid from a point considering all elevation) with quadrats (for recording ground vegetation) as shown in the Figure 4. Transect has to be flexible so that one does not leave the course of the stream. It may even be sinuous. Along the transect, quadrats of 20x20 m2 are laid to enumerate all the trees (which are 30 cm or more in GBH). The girth was measured at 130 cms. For each tree, the approximate height is estimated visually in metres (m). The climbers associated with the trees were noted although there was further survey to identify some of them. The inter-quadrat distance kept was normally 20 m. Larger area was sampled using more number of quadrats (5 quadrats were laid on the right and left hand side, alternatively) maintaining inter-quadrat distance of approx. 20 m.
Figure 4: Transect based quadrats
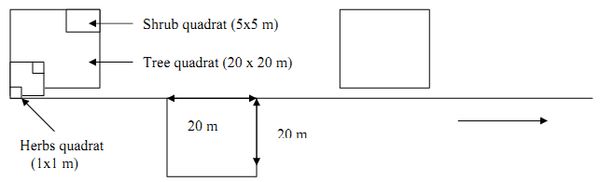
- Ground vegetation: The ground layer of plants, the plants of 1m or more in height but having GBH <30 cm, were sampled using 2 sub-quadrats of 5x5 m2 each, located within the tree quadrat as shown in the Figure 4. Within the 5x5 m2 quadrats, 2 sub-quadrats of 1x1 m2 were placed, as shown in the Figure, for sampling the diversity of herb layer of plants less than 1m in height.
- The herb layer: The herb layer of plants (<1m in ht.) within each of these 5x5 m2 sub-samples were enumerated in 2 sub-quadrats of 1x1 m2 each, also placed diagonally towards two of the corners of the 5x5 m2 quadrat as shown in the Figure. All plants within the herb layer quadrats, including Pteridophytes and seedlings of trees were enumerated and identified as far as possible.
- Estimation of Canopy Cover: The nature of canopy cover within each quadrat of 20x20 m2 has been noted at different points, one point being in the centre of the quadrat. The canopy cover is ranked as 0, 1, 2 and 3.
- Estimating Community Parameters: Species diversity is one of the most obvious and characteristic features of a community. From the earliest observations of rich diversity of tropical communities in comparison with impoverished polar communities, ecologists have tried to quantify the diversity concept.
Species Diversity: Diversity consists of two components¾variety and relative abundance of species (species richness).
- The diversity measurement: Species richness is used because it may only be one component of diversity but it is relatively simple to measure, and it has been successful in many studies. Moreover, species diversity measurement is more informative than species alone. (Anne E. Magurran, 1988). Diversity of tree species has been estimated using Shannon-Weiner’s and Simpson’s methods (Krebs, 1985).
- Species richness: This is the oldest and the simplest concept of species diversity¾the number of species in the community. The basic measurement problem is that it is often not possible to enumerate the entire species in a natural community.
- Heterogeneity: Simpson (1949), who proposed the second concept of diversity, combines two separate ideas, species richness and evenness. In a forest with 10 equally abundant tree species, two trees picked at random are likely to be different species. But in a forest with 10 species, one of which is dominant and contains 99% of all the individuals, two trees picked at random are unlikely to be different species (Krebs, 1989). The term heterogeneity was first applied to this concept by Good (1953) and for many ecologists this concept is synonymous with diversity (Hurlbert, 1971).
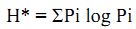
- Shannon-Wiener’s Index, H: A measure of a community’s diversity is simply the number of species it contains; say s. this is, however, an unweighed measure analogous to the range of a qualitative variety. To arrive at a weighed measure, i.e., one takes an account of the relative quantities of the species. The appropriate functions of Pi (i = 1…s), where Pi is the proportion of the community belonging to the ith species. The desirable proportion for H is as follows:
For a given s, H* should have its greatest value when Pi=1/s for all i. Such community will be called completely even.
Given the two completely even community s, one with s species and other with s+1, the latter should have greater H*. Proportion ‘1’ ensures that an ‘even’ community shall have a greater index of diversity than one in which, though the number of species is the same, the community is dominated by one or a few of them in which case its diversity in the intuitive sense would be less. The function of Pi, which satisfy this property is given by (Bhat, Prasad, Hedge, Saldanha, 1986)
It assumes that individuals are randomly sampled from an “indefinitely large” (i.e., an effectively infinite) population (Pielou, 1975). In practice, error is significant (Peet, 1974). The value of index falls between 1.5 and 3.5 and rarely surpasses 4.5 (Margalef, 1972).
- Species Dominance: This is a measure of concentration and is given by

l is the probability that any two individuals picked independently and at random from the community will belong to the same species. This measure is the property, which is the opposite of diversity. Thus, lower the l, higher the diversity. This suggests the use of some function that increases with decreasing λ as an index. Negative of dominance or concentration =1- λ or 1/λ. This Simpson’s index (1- l) ranges form zero (low diversity) to almost 1 (Krebs, 1989).
- Importance value index (IVI): It is a statistical quantity, which gives an overall picture of the importance of the species in the community. It considers the relative values of the density, frequency and basal area in a given sample (Subash, Divakar and Naik, 1999). IVI is given by
IVI = Relative Density + Relative Frequency + Relative Basal Area
The measurement of diversity requires knowledge of taxonomic classification. Diversity measures require an estimate of species importance in the community.
|
|
|
