SAMPLING AND ANALYSIS OF WATER
Water is a dynamic system and hence its characteristic quality changes with time and place. Water samples were collected at regular intervals to identify their characteristics and the changes in their quality. A total of 40 water samples (16 in the upstream and 24 in the downstream) were collected from various locations encompassing the entire catchment area. Precautions were taken while handling the collected samples to ensure its integrity.
1. Sampling Sites
Upper catchment
For physico-chemical and biological characterisation, monthly samples were collected (numbers in the square brackets indicate sampling sites):
- Areas where principal feeder tributaries Sharavathi [1] (Nagara), Sharavathi [2], Sharmanavathi or Mavinaholé [3], Haridravathi [4] and Yenneholé [10] meet the reservoir.
- Central part of reservoir near Holébagilu [8] to get a general quality of the water.
- Outlet [7] from the dam.
- Other minor tributaries like Hurliholé [9] and Keshawapura [14] and Nandiholé [15] (streams near Haridravathi), Valagere [11], Nittur [13] and Sampekai [16].
- At Talakalale dam, a balancing reservoir [6], near Muppane forest area [5] and Madenur dam [12] to get a comparative water quality status over the other sampling sites.
Table 2 gives the water sampling sites and its respective co-ordinates in the upper catchment of Sharavathi river basin.
Table 2. Water sampling representative sites of the Sharavathi upper catchment
| Sub-basin |
Sampling Sites |
Latitude
(°N) |
Longitude
(°E) |
| Hilkunji (US8) |
Sharavathi (Nagara) [1] |
13.8267 |
75.0601 |
| Sharavathi (US4) |
Sharavathi [2] |
13.8789 |
75.065 |
| Mavinaholé (US3) |
Sharmanavathi [3] |
13.9855 |
75.0822 |
| Haridravathi (US2) |
Haridravathi [4] |
14.0384 |
75.1207 |
| Yenneholé (US5) |
Muppane [5] |
14.1083 |
74.7902 |
| Yenneholé (US5) |
Talakalale [6] |
14.1853 |
74.7863 |
| Yenneholé (US5) |
Dam outlet [7] |
14.1917 |
74.8268 |
| Linganamakki (US9) |
Reservoir [8] |
14.0756 |
74.8977 |
| Hurliholé (US6) |
Hurliholé [9] |
13.9914 |
74.8672 |
| Yenneholé (US5) |
Yenneholé [10] |
14.0417 |
74.759 |
| Linganamakki (US9) |
Valagere [11] |
14.0624 |
74.8452 |
| |
Madenur Dam [12] |
|
|
| Linganamakki (US9) |
Nittur [13] |
13.9371 |
74.9139 |
| Haridravathi (US2) |
Keshawapura [14] |
14.0191 |
75.1215 |
| Nandiholé (US1) |
Nandiholé [15] |
14.0426 |
75.1254 |
| Linganamakki (US9) |
Sampekai [16] |
14.048 |
75.0467 |
Note: Numbers in the square brackets indicate sampling sites.
Lower catchment
In the lower catchment among the 7 sub-basins, 20 localities were selected for water sampling (Table 3). Landuse pattern and stream orders of the localities are detailed in Table 4.
Table 3. Water sampling representative sites of the downstream catchment
| Sub Basin |
Sampling locations |
Latitude
(°N) |
Longitude
(°E) |
Altitude
(m) |
| Dabbe falls (DS4) |
Hebbankere [2] |
|
|
|
| Dabbe falls (DS 4) |
Dabbe falls [1] |
14.13747 |
74.74158 |
567 |
| Magod (DS 3) |
Hosagadde [3] |
14.17009 |
74.54848 |
41 |
| Magod (DS 3) |
Dabbod [4] |
|
|
|
| Magod (DS 3) |
Magodholé [5] |
14.22377 |
74.59595 |
13 |
| Magod (DS 3) |
Gazni/ Hennur [6] |
14.21883 |
74.53471 |
16 |
| Magod (DS 3) |
Heggar [7] |
14.23294 |
74.52602 |
13 |
| Chandavar (DS 1) |
Chandavar [21] |
|
|
|
| Chandavar (DS 1) |
Gudankateholé [22] |
14.38152 |
74.44321 |
22 |
| Chandavar (DS 1) |
Badagani [23] |
14.35294 |
74.42194 |
10 |
| Gudankatehole (DS 7) |
Bhaskere [8] |
14.3027 |
74.48524 |
35 |
| Haddinabal (DS 2) |
Chandubanu [9] |
14.32452 |
74.58300 |
27 |
| Haddinabal (DS 2) |
Haddinabal [10] |
14.28523 |
74.51153 |
36 |
| Haddinabal (DS 2) |
Mavinaholé [11] |
14.24546 |
74.61644 |
15 |
| Haddinabal (DS 2) |
Mahasati [12] |
14.26296 |
74.68116 |
76 |
| Haddinabal (DS 2) |
Vatahalla [13] |
14.27035 |
74.69153 |
68 |
| Magod (DS 3) |
Upponi location 1 [14] |
14.23432 |
74.60058 |
26 |
| Magod (DS 3) |
Upponi village loc 2 [15] |
14.23167 |
74.58934 |
31 |
| Kathalekan (DS 6) |
Kathalekan [16] |
14.27267 |
74.74788 |
633 |
| Mavinagundi (DS 5) |
Mavinagunde [17] |
14.24380 |
74.81250 |
577 |
| Mavinagundi (DS 5) |
Jog lower [18] |
14.22767 |
74.8120 |
331 |
| Mavinagundi (DS 5) |
Jog upper [19] |
14.22973 |
74.81355 |
491 |
| Mavinagundi (DS 5) |
Joginamuttu [20] |
14.23024 |
74.82361 |
499 |
Note: Numbers in the square brackets indicate sampling sites.
Table 4. Sub-basinwise locations, landuse pattern, stream orders in the downstream catchment
| Sub Basin |
Sampling locations |
Land use pattern |
Stream orders |
| DS 4 |
Hebbankere |
Forest, agriculture |
1st |
| DS 4 |
Dabbe falls |
Forest, agriculture |
1st |
| DS 3 |
Hossagadde |
Agriculture |
1st |
| DS 3 |
Dabbod |
Agriculture |
2nd |
| DS 3 |
Magodholé |
Agriculture |
2nd |
| DS 3 |
Gazni/ Hennur |
Agriculture |
2nd |
| DS 3 |
Heggar |
Human dwelling, Agriculture |
3rd |
| DS 3 |
Nagarbhastikere |
Forest |
2nd |
| DS 1 |
Chandavar |
Agriculture |
2nd |
| DS 1 |
Gudankateholé |
Agriculture |
2nd |
| DS 1 |
Badagani |
Human dwellings and agriculture |
2nd |
| DS 7 |
Bhaskere |
Human dwellings and Agriculture |
2nd |
| DS 2 |
Chandubanu |
Agriculture |
2nd |
| DS 2 |
Haddinabal |
Agriculture |
2nd |
| DS 2 |
Mavinaholé |
Agriculture |
2nd |
| DS 2 |
Mahasati |
Forest |
3rd |
| DS 2 |
Vatahalla |
Forest |
2nd |
| DS 3 |
Upponi location 1 |
Agriculture |
3rd |
| DS 3 |
Upponi village loc 2 |
Agriculture |
3rd |
| DS 6 |
Kattlekan |
Forest |
2nd |
| DS 5 |
Mavinagunde |
Forest |
2nd |
| DS 5 |
Jog lower |
Forest |
3rd |
| DS 5 |
Jog upper |
Forest |
3rd |
| DS 5 |
Joginamuttu |
Agriculture |
2nd |
2. Sampling Containers
Polyethylene containers (PEC) were used for collecting and storing the samples in the field.
3. Sampling Frequency
The generally adopted frequencies of sampling are hourly, daily, weekly, bi-monthly and monthly. Monthly samplings were adopted to get samples at these representative points.
4. Preservation and Handling Methods
The samples were preserved in the dark and the temperature was lowered to 4oC
5. Sampling Procedure
The following procedure was followed while sampling.
- The container was rinsed with HCl followed by distilled water.
- Before being filled with the sample, the container was first rinsed with the sample.
- The samples were collected by directly immersing the container in the water, and it was closed properly using appropriate stoppers.
- A number of parameters like pH, temperature, colour, and dissolved oxygen were measured at the sampling sites immediately after collection of the sample.
- After the addition of preservatives like Toluene (to check microbial action) the samples were transported to the laboratory for further analysis (physico-chemical and biological).
6. Physico-Chemical and Biological Analysis
Physico-chemical and biological parameters for monthly samples were analysed according to the standard methods provided by National Environmental Engineering Research Institute NEERI and American Public Health Association (APHA) and the values were compared with World Health Organization and Indian Standard Specifications (IS: 1050-1983; IS: 2490 –1982).
The following physico-chemical and biological parameters were measured at various representative sites within the Sharavathi catchment area at one-month intervals. Table 5 gives physico-chemical and biological parameters and its respective method of analysis.
Table 5. Water quality parameters and its method of analysis
| Physical Parameter |
Method of Analysis |
| Temperature (°C) |
Mercury Thermometer |
| Transparency (cm) |
Secchi Disk |
| Total Dissolved Solids (mg/L) |
Electrometric |
| Total Suspended Solids (mg/L) |
Gravimetric |
| Turbidity (NTU) |
Jal Tara Water Testing Kit |
| Colour |
Visual Comparison |
| Odour |
Olfactory sensing |
| Chemical Parameter |
|
| pH |
Electrometric |
| Conductivity (mS/cm) |
Electrometric |
| Acidity (mg/L) |
Titrimetric |
| Alkalinity (mg/L) |
Titrimetric |
| Chloride (mg/L) |
Argentometric |
| Residual chlorine (mg/L) |
Visual Colour Comparison |
| Total Hardness (mg/L) |
Titrimetric |
| Calcium hardness (mg/L) |
Titrimetric |
| Magnesium hardness (mg/L) |
Titrimetric |
| Dissolved oxygen (ppm) |
Electrometric |
| Fluoride (mg/L) |
Jal Tara Water Testing Kit |
| Ammonia (mg/L) |
Visual Colour Comparison |
| Sodium (mg/L) |
Flame Photometer |
| Potassium (mg/L) |
Flame Photometer |
| Sulphates (mg/L) |
Spectrophotometer |
| Iron (mg/L) |
Visual Colour Comparison |
| Nitrates (mg/L) |
Phenoldisulphonic Acid |
| Phosphates (mg/L) |
Ammonium molybdate |
| Biological Parameter |
|
| Coliform |
Visual Comparison |
Note: Parts per million (ppm) is equivalent to mg/L
Physical Parameters
Temperature
Waterbodies undergo temperature variations that occur seasonally and in some waterbodies diurnally (24 hour period). Rivers also exhibit vertical stratification of temperature within the water column. The rate of chemical and biological processes in surface water, especially oxygen levels, photosynthesis and algal production, are strongly influenced by temperature. Temperature readings are used in the calculations of various forms of alkalinity and salinity. In limnological studies, water temperature is often taken as a function of depth. Increase in temperature over 40°C in natural water tends to accelerate chemical reactions, lower solubility of gases like oxygen, carbon dioxide, nitrogen and methane, amplify taste and odour, and increase metabolic activity of organisms.
Impinging solar radiation and atmospheric temperature brings about spatial and temporal changes in water temperature setting up convection currents and thermal stratification. Temperature plays a very important role in wetland dynamism affecting the various parameters such as alkalinity, salinity, dissolved oxygen, electrical conductivity, etc. In an aquatic system, these parameters affect the chemical and biological reactions such as solubility of oxygen, carbon-dioxide, carbonate-bicarbonate equilibrium, increasing the in metabolic rate and affecting the physiological reactions of organisms, etc. Water temperature is important in relation to fish life. The temperature of drinking water has an influence on its taste.
Apparatus Required: Thermometer- 0.1o C division.
Procedure: Immerse the thermometer directly in the waterbody for a period of time sufficient to permit constant reading. If it is not possible to take reading directly, then collect water in a sampling bottle nearly one L & measure the temperature by dipping the thermometer in the sample. But while collecting the sample, it must not be exposed to heat or direct solar radiation.
Unit: Degrees Celsius (°C)
Transparency (Light Penetration)
The major source of light energy in an aquatic system is solar energy governing the primary productivity. Transparency is a characteristic of water that varies with the combined effect of colour and turbidity. It measures the light penetrating through the waterbody and it is determined using the Secchi disc.
Apparatus Required: Secchi disc; a metallic disc of 20 cm diameter with four quadrats of alternate black and white on the upper surface. The disc with centrally placed weight at the lower surface is suspended with a graduated cord at the centre.
Procedure: Transparency is measured by gradually lowering the Secchi disc at respective sampling points. The depth at which it disappears (X1) and reappears (X2) is noted. The transparency of the waterbody is calculated as follows
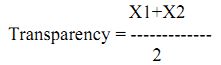
where, X1 = Depth at which Secchi disc disappears (cm or m)
X2 = Depth at which Secchi disc reappears (cm or m)
Total Dissolved Solids
Dissolved solids are in dissolved state in solution (having particle size less than 10-9m). Low concentrations of dissolved substances have no significant influence on the water quality but at high concentrations impair the water quality and suitability of water for various applications such as domestic, industrial and agricultural purposes. It has an overall effect on the living creatures like humans, aquatic and terrestrial organisms. Excessive concentrations increase water turbidity, affects photosynthesis, absorbs more heat, enriches nutrient status of water, etc. It helps in understanding level of turbidity and hardness of water. They cause laxative effects in humans and when present in irrigation water enrich the soil making it saline.
USEPA standard 500 mg/L
Method: Electrometric
Procedure: Take 50 ml of water sample in a 50 ml beaker and insert the TDS probe into it. Record the TDS value from the instrument.
Unit: parts per million or mg/L
Range for total dissolved solids in natural waters:
Freshwater - < 1500 mg/L
Brackish water - 1500 – 5000 mg/L
Saline water - > 5000 mg/L
Sea water - 30000 – 40000 mg/L
Total Suspended Solids
Solids that remain in suspension like silt, sand, clay and phytoplankton etc., form the total suspended solids. Similar to TDS, it interferes in the quality of the water.
Method: Gravimetric
Procedure: Take 50 ml of water sample and filter it using a previously weighed filter paper (Whatman) (W1). Dry the filter paper in oven at 105°C till it dries. Weigh the dried filter paper (W2).
Calculations: TSS = (W2 – W1)/ Sample taken in mL
Unit: parts per million or mg/L
Turbidity
The substances not present in form of true solution can cause turbidity in water. True solution have a particle size of less than 10-9 m and any substances having more than this size will produce turbidity. Suspended solids and colour are the main interference for transparency. The clarity of a natural waterbody is a major determinant of the condition and productivity of the system. Turbidity value above 10 NTU would affect these processes and transparency. It restricts the penetration of light giving rise to reduced photosynthesis and affects the aesthetics. High levels of turbidity can protect microorganisms from the effects of disinfection and can stimulate bacterial growth. The transparency and turbidity are inversely related to each other, if turbidity is more, transparency is less and vice versa.
Turbidity is an expression of optical property; wherein light is scattered by suspended particles present in water (Tyndall effect). Suspended and colloidal matter such as clay, silt, finely divided organic and inorganic matter, plankton and other microscopic organisms cause turbidity in water. Turbidity affects light penetration, absorption properties and aesthetic appearance of a waterbody. Increase in the intensity of scattered light results in higher values of turbidity.
Increased turbidity associated with reduction in suspended matter and microbial growth makes water unfit for drinking and other purposes. High turbidity levels in natural waters makes water warmer as suspended particles absorb more heat from the sunlight resulting in low dissolved oxygen concentrations. Turbidity also restricts light penetration for photosynthesis and hence a major determinant of the condition and productivity of the natural waterbody.
Method: Turbidity measuring tube
Procedure: Fill the turbidity measuring tube (with a black cross mark at the bottom) till the mark just disappears and note down the range of turbidity marked on the tube.
Unit: NTU [Nephlometric turbidity units]
Colour
In natural water, colour is due to the presence of humic acids, fulvic acids, metallic ions, suspended matter, plankton, weeds and industrial effluents. Colour is removed to make water suitable for general and industrial applications and is determined by visual comparisonof the sample with distilled water.
Visual Comparison: About 20 mL of the sample and 20 mL of distilled water are taken in two separate wide mouthed test tubes. The results are noted (as clear, greenish, greyish, brownish, blackish, etc.) by comparing the colour of the sample with distilled water.
Odour
Odour is an in situ parameter and temperature dependent. It impairs the water quality creating unhygienic conditions and a pollution indicator. Odour test helps in assessing the suitability of water for the intended applications for process control and wastewater treatment plants. Odour is imparted to water due to the presence of volatile and dissolved organic and inorganic components such as organic matter, phytoplankton, contamination due to domestic sewage and industrial effluents, dissolution and presence of gases in water like NH3, H2S, etc.
Method: Sensory method
Units / Range: Odourless, faint, distinct, very strong, odourless, fishy, rotten egg, faecal or any other.
Chemical Parameters
pH
pH has its great influence on the chemical and biological properties of liquids, hence its determination is very important. It is one of the important parameters in water chemistry and is defined as -log [H+], and measured as intensity of acidity or alkalinity on a logarithmic scale ranging from 0 to 14. If free H+ are more it is expressed as acidic (i.e. pH < 7) and if OH- ions are more then it is expressed as alkaline (i.e. pH > 7). pH is important for acid-base neutralisation, water softening, precipitation, coagulation, disinfections and corrosion control. pH less than 7 (acidic) has significance from public health point of view and creates corrosion and interferes in the water softening process. pH greater than 7 (alkaline) is mainly due to carbonates and bicarbonates and hence poses a problem of scale formation, hardness, etc. In natural water, pH is governed by the equilibrium between carbon dioxide / bicarbonate / carbonate ions and ranges between 4.5 and 8.5 although mostly basic. It tends to increase during day largely due to the photosynthetic activity (consumption of carbon dioxide) and decreases during night due to respiratory activity. Wastewater and polluted natural waters have pH values lower or higher than 7 based on the nature of the pollutant.
Apparatus Required:
Electrometric method: Glass electrode, reference electrode (mercury/calomel or silver/silver chloride) and pH meter.
Principle:
Electrometric method: pH is determined by measuring the Electro Motive Force (E.M.F) of a cell comprising an indicator electrode (an electrode responsive to hydrogen ions such as a glass electrode) immersed in the test solution and the reference electrode (usually a mercury/calomel electrode). Contact between the test solution and the reference electrode is usually got by means of a liquid junction, which forms a part of reference electrode. EMF of this cell is measured with pH meter, that is, a high impedance voltmeter calibrated in terms of pH. The electrode is allowed to stand for 2 minutes to stabilise before taking reading (at least ±0.1 pH units).
Procedure:
Take 50mL of sample in a beaker and insert the pH probe. Record the readings.
Electrical Conductivity
Conductivity (specific conductance) is the ability of water to conduct an electric current. It is measured in milli-Siemens per cm and depends on the total concentration, mobility, valence of ions and the temperature of the solution. Electrolytes in a solution disassociate into positive (cations) and negative (anions) ions and impart conductivity. Most dissolved inorganic substances are in the ionised form in water and contribute to conductance. The conductance of the samples gives rapid and practical estimate of the variation in dissolved mineral content of the water supply. Conductance is defined as the reciprocal of the resistance involved and expressed as mho or Siemens (s).
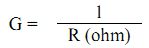
where, G – conductance (ohm-1 = mho = Siemens)
R – Resistance (ohm)
Apparatus Required: Conductivity meter
Procedure: The electrode of the conductivity meter is dipped into the sample, and the readings are noted for stable value displayed in mS/cm.
Most dissolved inorganic substances in water are in the ionised form and hence contribute to conductance. Conductivity gives a rapid and practical estimate of total dissolved solids. It helps in determining suitability of water for irrigation and domestic applications.
- Pure deionised water : < 1 μS/cm
- Distilled water : 0.5 – 2.0 mS/cm
- Fresh or surface waters – 50 – 500 mS/cm
- Groundwaters > surface waters
- Polluted waters – high conductance
- Rain water: 20 – 40 μS/cm
- Effluent from Effluent Treatment Plants: 300 –1000 μS
- Conductivity μS/cm = 110 – 115 % of TDS [mg/L]
Acidity
Acidity of a liquid is its capacity to denote H+ ions. Since most of the natural waters and sewage are buffered by carbon dioxide - bicarbonate system, the acidity present due to free CO2 has no significance from public health point of view. Water containing mineral acidity (due to H2SO4, HNO3 and HCl) is unacceptable. Further, acid waters pose problems of corrosion and interfere with water softening. It is measured by titrimetric method.
Principle: The mineral acids present and contributing mineral acidity can be calculated by titrating or neutralising samples to pH 4.3. The CO2 and bicarbonate (carbonic acid) present in the sample can be neutralised completely by continuing the titration to pH 8.3.
Reagents:
- Standard sodium hydroxide 0.02N: Dissolve 0.8 g of NaOH and dilute to 1000 mL using CO2 free distilled water. Store in airtight, rubber stoppered glass bottle to protect from atmospheric CO2. Standardise against 0.02N potassium biphthalate.
- Phenolphthalein indicator: Dissolve 0.5 g in 500 mL 95% ethyl alcohol. Add 500 mL of distilled water. Add drop wise 0.02N NaOH till faint pink colour appears.
- Methyl orange indicator: Dissolve 0.5 g with CO2 free distilled water (1000 mL).
Procedure:
- Take 25 or 50 mL of sample in a conical flask add 2 drops of methyl orange and titrate with standard 0.02N NaOH till the colour changes to faint orange, characteristic of pH 4.4 - 4.3.
- Note down the volume of NaOH used.
- Again add 2 or 3 drops of phenolphthalein indicator and continue the titration against the same sodium hydroxide till the pink colour appears.
- Note down the additional volume used.
Calculation:
Each mL of 0.02 N NaOH = 1 mg CaCO3.
Hence, acidity mineral or due to CO2 as mg/L CaCO3 = 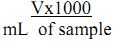
If the normality of NaOH is not 0.02, then,
Acidity mineral or due to CO2 as mg/L, CaCO3 = 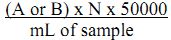
where, V= volume of NaOH used in final round (vol. 1 + vol. 2)
A = mL of NaOH required for sample to raise pH upto 4.4 -4.3
B = mL NaOH required for sample to raise pH from 4.4 to 8.3.
N = normality of NaOH used.
Alkalinity
The alkalinity of water is the measure of its capacity to neutralise acids. The alkalinity of natural waters is due to the salts of carbonates, bicarbonates, borate, silicates and phosphates along with the hydroxyl ions in the free state. However, hydroxide, carbonate and bicarbonate cause the major portion of the alkalinity in the natural water, which may be ranked in order of their association with high pH values. Alkalinity values provide guidance in applying proper doses of chemicals in water and waste water treatment processes, particularly in coagulation, softening and operational control of anaerobic digestion.
Principle: Alkalinity of a sample can be measured by titrating with standard sulphuric acid. Titration to pH 8.3 or decolourisation of phenolphthalein indicator will indicate complete neutralisation of OH and 1/2 of CO3 while to pH 4.5 or sharp changes from yellow to orange of methyl orange indicator will indicate total alkalinity.
Reagents:
- Standard H2SO4 0.02N: Prepare 0.1N sulphuric acid by diluting 3.0 mL of conc. H2SO4 to 1000 mL and standardise it against standard Na2CO3 (0.1N). Dilute appropriate volume of H2SO4 to get 0.02N H2SO4.
- Phenolphthalein indicator: Dissolve 0.5 g in 500 mL 95% ethyl alcohol and add 500 mL distilled water. Add drop-wise 0.02N NaOH till faint pink colour appears.
- Methyl orange: Dissolve 0.5 g and dilute to 1000 mL with CO2 free distilled water.
Procedure:
- Take 25 or 50 mL sample in a conical flask and add 2 or 3 drops of phenolphthalein indicator.
- If pink colour appears titrate with 0.02N H2SO4 till the colour disappears or pH is 8.3. Note the volume of H2SO4 used.
- Add 2 or 3 drops methyl orange indicator to the same flask and continue titration till pH comes down to 4.5 or yellow colour changes to orange. Note the sulphuric acid used.
Calculation:
P- alkalinity (mg/L as CaCO3) = (A x 1000) / mL of sample.
Total alkalinity (mg/L as CaCO3) = (B x 1000) / mL of sample.
In case H2SO4 is not 0.02N apply the following formula;
Alkalinity mg/L as CaCO3 = {(A or B) x N x 50000}/ mL of sample used.
where, A = mL of H2SO4 required to bring the pH to 8.3 (P-alkalinity value)
B = mL of H2SO4 required to bring the pH to 4.5 (Total alkalinity)
N = Normality of H2SO4 used.
Once the phenolphthalein and total alkalinities are determined then three types of alkalinities i.e. hydroxide, carbonate and bicarbonate are easily calculated from the given Table 7.
Table 7. Relation between Hydroxide, Carbonate and Bicarbonate alkalinities
| Values of P and T |
OH |
CO3 |
HCO3 |
| P = 0 |
0 |
0 |
T |
| P < 1/2 T |
0 |
2P |
T-2P |
| P =1/2 T |
0 |
2P |
0 |
| P >1/2 T |
2P-T |
2(T-P) |
0 |
| P =T |
T |
0 |
0 |
Once the values of carbonate and bicarbonate alkalinities are known then their conversion to mg/mL of CO32- or HCO3- is possible.
mg/L CO32- = mg/L carbonate alkalinity x 0.6
mg/L HCO3- = mg/L bicarbonate alkalinity x 1.22
Chlorides
The presence of chlorides in natural waters can mainly be attributed to dissolution of salt deposits in the form of ions (Cl-). Otherwise, high concentrations may indicate pollution by sewage or some industrial wastes or intrusion of seawater or other saline water. It is the major form of inorganic anions in water for aquatic life. High chloride content has a deleterious effect on metallic pipes and structures, as well as agricultural plants. In natural freshwaters, high concentration of chlorides is regarded as an indicator of pollution due to organic wastes of animal origin (animal excreta have higher chlorides along with nitrogenous wastes). Domestic sewage and industrial effluents also bring chlorides into the water. Chloride content above 250 mg/L makes water salty. However, a level up to 1000 mg/L is safe for human consumption. High level results in corrosion and non-palatability. They are calculated by Argentometric method.
Principle: In alkaline or neutral solution, potassium chromate indicates the endpoint of the silver nitrate titration of chlorides. Silver chloride is quantitatively precipitated before the red silver chromate is formed.
Apparatus Required: Lab glassware.
Reagents:
- Potassium chromate indicator solution:50 g of potassium chromate is dissolved in minimum amount of distilled water and silver nitrate is added drop wise till a red precipitate is formed. The mixture is allowed to stand for about 12 hours and diluted to 1000 mL with distilled water.
- Silver nitrate solution (0.014N):2.395 g of silver nitrate is dissolved in distilled water and made up to 1000 mL.
Procedure: A known volume of filtered sample (50 mL) is taken in a conical flask, to which about 0.5 mL of potassium chromate indicator is added and titrated against standard silver nitrate till silver dichromate (AgCrO4) starts precipitating.
Calculation:
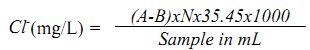
where, A - Volume of silver nitrate consumed by the sample
B - Volume of silver nitrate consumed by the blank
N - Normality of silver nitrate
Residual Chlorine
The chlorination of water supplies and polluted waters serves primarily to destroy or deactivate disease-producing microorganisms. A secondary benefit is the overall importance in water quality resulting from the reaction of chlorine with ammonia, iron, manganese, sulphide and some organic substances. Chlorination may produce adverse effects. Taste and odour characteristics of compounds present in a water supply may be intensified. Potentially carcinogenic chloroorganic compounds such as chloroform may be formed. Combined chlorine formed on chlorination of ammonia or amine bearing waters adversely affects some aquatic life. To fulfil the primary purpose of chlorination and to minimise any adverse effect, it is essential that proper testing producers be used with a foreknowledge of the limitation of the analytical determination.
Free chlorine reacts readily with ammonia and certain nitrogenous compounds to form combined chlorine. With ammonia, chlorine reacts to form the chloroamines; monochloroamine, dichloroamines and nitrogen trichloride. The presence and concentrations of these combined forms depend chiefly on pH, temperature, and initial chlorine to nitrogen ratio, absolute chlorine demand and reaction time. Both free and combined chlorine may be present simultaneously. Combined chlorine in water supplies may be formed during the treatment of raw water containing ammonia or ammonium salt. Chlorinated wastewater effluents as well as certain chlorinated industrial effluents, normally contain combined chlorine. In the present study Tara Water Testing Kit was used for the estimation of Residual Chlorine. The permissible level of residual chlorine in drinking water is 0.2mg/L.
Principle: Ortho-toludine forms yellow complex, the intensity of the developed colour is dependent on the amount of residual chlorine present in the sample.
Reagents Used:
Steps Followed:
- Take 10 mL sample in a cylinder and find the pH of sample using the pH paper.
- If the pH is less than 9, add 4 drops of O-toludine and if greater than 9, add 8 or 10 drops.
- Now compare the colour with standard colour chart given with Tara Water Testing Kit and record the concentration in mg/L.
Total Hardness
Hardness is due to the presence of multivalent metal ions, which come from minerals dissolved in the water. The total hardness is defined as the sum of calcium and magnesium concentrations, expressed as CaCO3 in mg/L and is given in Table 6. Carbonates and bicarbonates of calcium and magnesium cause temporary hardness. Sulphates and chlorides cause permanent hardness. It is based on the ability of these ions to react with soap to form a precipitate or soap scum. In freshwater the primary ions are calcium and magnesium; however iron and manganese may also contribute. Carbonate hardness is equal to alkalinity but a non-carbonate fraction may include nitrates and chlorides. Depending on pH and alkalinity, hardness of about 200 mg/L can result in scale deposition, particularly on heating. Soft waters with a hardness of less than about 100 mg/L have a low buffering capacity and may be more corrosive to water pipes. The taste threshold for the calcium ion is 75 mg/L, depending on the associated anion, and the taste threshold for magnesium is probably less than that for calcium.
Table 6. Water quality on the basis of hardness as (CaCO3).
| Soft |
0 – 60 mg/L |
| Medium |
60 –120 mg/L |
| Hard |
120 – 180 mg/L |
| Very Hard |
> 180 mg/L |
Principle: In alkaline conditions, EDTA (Ethylene-diamine tetra acetic acid) and its sodium salts react with cations forming a soluble chelated complex when added to a solution. If a small amount of dye such as Eriochrome Black-T is added to an aqueous solution containing calcium and magnesium ions at alkaline pH of 10.0 ± 0.1, it forms wine red colour. When EDTA is added as a titrant, all the calcium and magnesium ions in the solution gets complexed resulting in a sharp colour change from wine red to blue, marking the end point of the titration. Hardness of water prevents lather formation with soap rendering the water unsuitable for bathing and washing. It forms scales in boilers, making it unsuitable for industrial usage. At higher pH > 12.0, Mg++ ion precipitates with only Ca++ in solution. At this pH, Murexide indicator forms a pink colour with Ca++ ion. When EDTA is added, Ca++ gets complexed resulting in a change from pink to purple indicating end point of the reaction.
Apparatus Required: Lab glassware - burette, pipette, conical flask, beakers, etc.
Reagents:
- Buffer solution: 16.9 g of ammonium chloride, 1.25 g of magnesium salt of EDTA is dissolved in 143 mL of concentrated ammonium hydroxide and diluted to 250 mL with distilled water.
- Eriochrome Black-T indicator: 0.5 g of Eriochrome black-T indicator is dissolved in 100 g of triethanolamine.
- Standard EDTA titrant: 0.01 M or Ng AR grade EDTA is dissolved in distilled water and diluted to 1000 mL and is standardised against standard calcium solution, 1 mL = 1 mg CaCO3.
- Standard Calcium solution: 1.0 g of AR grade CaCO3 is weighed into a 250 mL conical flask, to which 1+1 HCl is added till all CaCO3 is dissolved completely. 200 mL of distilled water is added and boiled to expel carbon-di-oxide. Dilute to 1000 mL. 1 mL = 1 mg CaCO3.
Procedure: Exactly 50 mL of the well-mixed sample is pipetted into a conical flask, to which 1 mL of ammonium buffer and 2-3 drops of Eriochrome black -T indicator is added. The mixture is titrated against standard 0.01M EDTA until the wine red colour of the solution turns pale blue at the end point.
Calculation:
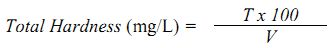
where, T = Volume of titrant, V = Volume of sample
Calcium Hardness
The presence of calcium (fifth most abundant) in water results from passage through or over deposits of limestone, dolomite, gypsum and other calcium bearing rocks. Calcium contributes to the total hardness of water and is an important micronutrient in aquatic environment and is especially needed in large quantities by molluscs and vertebrates. It is measured by EDTA titrimetric method. Small concentration of calcium carbonate prevents corrosion of metal pipes by laying down a protective coating. But increased amount of calcium precipitates on heating to form harmful scales in boilers, pipes and utensils.
Principle: When EDTA (Ethylene-diamine tetra acetic acid) is added to the water containing calcium and magnesium, it combines first with calcium. Calcium can be determined directly with EDTA when pH is made sufficiently high such that the magnesium is largely precipitated as hydroxyl compound (by adding NaOH and iso-propyl alcohol). When murexide indicator is added to the solution containing calcium, all the calcium gets complexed by the EDTA at pH 12-13. The end point is indicated from a colour change from pink to purple.
Apparatus Required: Burettes, pipette, conical flask, beakers and droppers.
Reagents:
- Sodium hydroxide (8%):8 g of sodium hydroxide is dissolved in 100 mL of distilled water.
- Murexide indicator (ammonium purpurate):0.2 g of murexide is ground well with 100 g of sodium chloride thoroughly.
- Standard EDTA titrant, 0.01M:3.723 g of EDTA (disodium salt) is dissolved in distilled water and made up to 100 mL with the same.
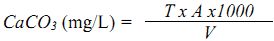
Procedure: A known volume (50 mL) of the sample is pipetted into a clean conical flask, to which 1 mL of sodium hydroxide and 1mL of iso-propyl alcohol is added. A pinch of murexide indicator is added to this mixture and titrated against EDTA until the pink colour turns purple.
Calculation:
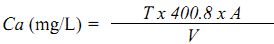
where, T= volume of titrant, mL
V= volume of sample taken (mL)
A= mg of CaCO3 equivalent to 1mL of EDTA titrant
Calcium as CaCO3
Magnesium Hardness
Magnesium is a relatively abundant element in the earth's crust, ranking eighth in abundance among the elements. It is found in all natural waters and its source lies in rocks, generally present in lower concentration than calcium. It is also an important element contributing to hardness and a necessary constituent of chlorophyll. Its concentration greater than 125 mg/L can influence cathartic and diuretic actions.
Principle: Magnesium hardness can be calculated from the determined total hardness and calcium hardness.
Calculation:
Magnesium (mg/L) = (T - C)
where, T = Total hardness mg/L as CaCO3
C = Calcium hardness mg/L as CaCO3
High concentration of magnesium proves to be diuretic and laxative, and reduces the utility of water for domestic use while a concentration above 500 mg/L imparts an unpleasant taste to water and renders it unfit for drinking. Chemical softening, reverse osmosis and electro dialysis or ion exchange reduces the magnesium hardness to acceptable levels.
Dissolved Oxygen
Oxygen dissolved in water is a very important parameter in water analysis as it serves as an indicator of the physical, chemical and biological activities of the waterbody. The two main sources of dissolved oxygen are diffusion of oxygen from the air and photosynthetic activity. Diffusion of oxygen from the air into water depends on the solubility of oxygen, and is influenced by many other factors like water movement, temperature, salinity, etc. Photosynthesis, a biological phenomenon carried out by the autotrophs, depends on the plankton population, light condition, gases, etc. Oxygen is considered to be the major limiting factor in waterbodies with organic materials. If its value is less than 3 mg/L, the metabolic processes that produce energy for growth and reproduction get affected. Oxygen levels that remain below 1-2 mg/L for a few hours can result in large fish kills. In the present study, for analysis of DO, DO meter is used.
Principle: The membrane electrode has a sensing element protected by an oxygen-permeable plastic membrane that serves as a diffusion barrier against impurities. Under steady conditions, the electric current read is directly proportional to the DO concentrations (electric current is directly proportional to the activity of molecular oxygen).
Apparatus and reagents: Oxygen-sensitive membrane electrode, beaker, tissue paper, glass rods, sodium sulphite, sodium sulphate, cobalt chloride, etc.
Method: Instrumental [Systronics DO meter]
Procedure: For calibration, add a pinch of sodium sulphate, sodium sulphite and cobalt chloride to the tap water, dip the probe into it and gently shake the probe till the reading in the DO meter comes to 0.5. For air calibration, wrap the probe with moist tissue paper and keep the probe in the air for 10 minutes. Record the temperature readings of the instrument and refer the table for dissolved oxygen concentrations against temperature. Record the corresponding value and the altitude of location (in feet), refer the table and note the correction factor. Multiply correction factor with the corresponding dissolved oxygen concentration to get the calibration value. Adjust the DO knob to the calibration value calculated and at the same time adjust the salinity knob depending on the source to be monitored. Then dip the DO probe into the sample or waterbody with gentle shaking and record the DO directly from the instrument.
Unit: ppm or mg/L
Range:
5-6 ppm sufficient for most species
<3 ppm stressful to most aquatic species
<2 ppm fatal to most species
Fluoride
Fluorides have dual significance in water supplies. High concentration causes dental fluorosis and lower concentration (< 0.8 mg/L) causes dental caries. A fluoride concentration of approximately 1 mg/L in drinking water is recommended. They are frequently found in certain industrial processes resulting in fluoride rich wastewaters. Significant sources of fluoride are found in coke, glass and ceramic, electronics, pesticide and fertiliser manufacturing, steel and aluminium processing and electroplating industries. For potable water maximum permissible level for fluoride is 1.5mg/L and minimum is 0.6mg/L. In the present, fluoride was estimated using Jal Tara Water Testing Kit.
Principle: The colorimetric method of estimating fluoride is based on the reaction of fluorides (HF) with zirconium dye. Fluoride reacts with the dye dissociating (bleaching) the dye into a colourless complex anion (ZrF62-). As the amount of fluoride increases, the colour produced becomes progressively higher or of a different hue.
Apparatus Required: Jal Tara Water Testing Kit and lab glassware.
Reagents: Zirconyl-alizarine reagent
Procedure: Take 50mL of sample in a test tube provided. Add Zirconyl-alizarine till 52.5mL mark on the test tube. Mix the solution well. Allow the solution for an hour till the colour develops. Compare and record the developed colour with the standard chart provided (in mg/L).
Ammonia
Ammonia is produced by the microbial degradation of organic matter. It appears therefore, in many grounds as well as surface waters. Concentrations of ammonia above a certain level in water; polluted either due to sewage or industrial wastes, is toxic to fish. The proportion of two forms of ammonia in surface water depends on pH, which are listed below in Table 8.
Table 8. Availability of ammonia at different pH.
| pH |
6 |
7 |
8 |
9 |
10 |
11 |
| % NH3 |
0 |
1 |
4 |
25 |
78 |
96 |
| % NH4+ |
100 |
99 |
96 |
75 |
22 |
4 |
For accurate result, it is generally preferable to distil off ammonia from the sample, and absorb in boric acid. It is then determined either by titration of colorimetrically using Nessler reagent. Direct Nesslerization of sample is quicker but subject to considerable interference.
Principle: Ammonia produces a yellow coloured compound when reacted with alkaline Nessler’s reagent, provided the sample is clarified properly. Pre-treatment with ZnSO4 and NaOH precipitates Ca, Fe, Mg and sulphide and removes turbidity and apparent colour. Addition of EDTA (before Nessler’s reagent) or Rochelle salt solution prevents precipitation of residual Ca and Mg in the presence of alkaline Nessler’s reagent.
Interferences: Colour, turbidity Ca, Mg, salts and Fe in the sample constitute the prime sources of interferences.
Method Used: In this study the estimation of ammonia was carried out using Jal Tara Water Testing Kit, following the principle:
When Nessler's reagents is added to a diluted to ammonia solution, the liberated ammonia reacts with the reagent fairly rapid to form an orange-brown product, which remains in colloidal solution but flocculates on long standing.
Reagent Used: Nessler's reagent.
Steps Followed:
- Take a cylinder and transfer 5 mL sample.
- Add 2 or 3 drops of Nessler's reagent.
- Now compare the colour developed with the standard chart given with Tara Water Testing Kit, and find the concentration mg/L
Sodium and Potassium
Sodium is one of the most abundant elements and is a common constituent of natural waters. The sodium concentration of water is of concern primarily when considering their solubility for agricultural uses or boiler feed water. The concentration ranges from very low in the surface waters and relatively high in deep ground waters and highest in the marine waters. At room temperature, the average taste threshold for sodium is about 200 mg/L.
Potassium is found in low concentrations (<10 mg/L) in natural waters since rocks, which contain potassium, are relatively resistant to weathering. It is usually found in ionic form and the salts are highly soluble. Though found in small quantities it plays a vital role in the metabolism of fresh water environment. At room temperature the various threshold values were found to be about 20 mg/L for Na2CO3, 150 mg/L for NaCl, 190 mg/L for NaNO3, 220 mg/L for Na2SO4 and 400 mg/L for NaHCO3.
Principle: The estimation of sodium and potassium is based on the emission spectroscopy, which deals with the excitation of electrons from ground state to higher energy state and coming back to its original state with the emission of light. An atomiser under controlled conditions sucks the solution. The radiation from the flame enters a dispersing device in order to isolate the desire region of spectrum. The intensity of isolated radiation can be measured by a phototube. After carefully calibrating the photometer with solutions of known strength, it is possible to co-relate the intensity of a given spectral line of unknown with the amount of an element present that emits the particular radiation.
Apparatus Required: Flame photometer (Systronics ), lab glassware and Whatman filter paper.
Reagents:
- Deionised distilled water.
- Stock sodium solution: 2.542 g of sodium chloride dried (at 140o C) is dissolved in 1000 mL distilled water to give 1 mL = 1 mg of sodium.
- Working sodium solution: Dilute 10.0 mL stock solution to 1 L.
- Stock potassium solution:1.907 g of dried potassium chloride is dissolved in 1000 mL of distilled water, to give 1 mL = 1 mg of potassium.
- Working potassium solution: Dilute 10 mL of the stock solution to 1 L to get 1 mL= 0.01 mg K.
Procedure:
- Follow the instructions given by the manufacturer.
- Start the electrical supply and switch on the air supply. Stabilize the air. The needle should be steady at the mark.
- Switch on the gas and maintain the gas fuel mixture so that the blue flame is seen through viewing window.
- Aspirate distilled water and adjust the galvanometer reading to zero.
- Calibrate the instrument by aspirating the standard and adjusting the galvanometric reading to desired mark.
- Aspired distilled water to bring the reading to zero mark.
- Aspirate sample and note down the galvanometric reading.
- Put off the fuel supply first followed by air and then main switch.
From stock solutions working standards are prepared for sodium and potassium as mentioned in the reagents above. From working standards a series of standards of known concentration are prepared. These standards are aspirated into the flame photometer and the emission values are recorded. Then in a similar way the unknown samples are directly aspirated and corresponding emission values are recorded. Then the emission values obtained for unknown samples are multiplied with the slope and the dilution factor. The slope is the sum of the concentrations of the standards prepared divided by sum of their emission values. This gives the concentration of sodium and potassium in mg/L.
Calculation:
The emission of standard solution of sodium and potassium is taken and the sum of concentration is estimated.
The emission setting in flame photometer is as follows
| Concentration of Na (mg/L) |
Absorbance (Na) |
Concentration of K
(mg/L) |
Absorbance
(K) |
| 0.0 |
0 |
0.0 |
0 |
| 4 |
40 |
10 |
25 |
| 6 |
60 |
20 |
50 |
| 8 |
80 |
30 |
75 |
| 10 |
100 |
40 |
100 |
Sulphates
Sulphates are commonly found in all natural waters, particularly those with high salt content. Besides industrial pollution and domestic sewage, biological oxidation of reduced sulphur also adds to sulphate content. It is soluble in water and imparts hardness with other cations. Sulphate causes scaling in industrial water supplies, and odour and corrosion in wastewater treatment processes due to its reduction to H2S. Its main source is industrial discharge that contains sulphate salts and domestic wastes (heavy use of detergents). When water containing magnesium sulphate at levels about 1000 mg/L acts as a purgative in human adults, lower concentration (below 150 mg/L) may still affect new users and children. Taste threshold concentration for the most prevalent sulphate salts are 200 to 500 mg/L for sodium sulphate, and 400 to 600 mg/L for magnesium sulphate. On the basis of above values, allied to the cathartic effect of sulphate, a guideline value of 400 mg/L is proposed. It can be calculated by turbidometric method.
Principle: Sulphate ions are precipitated as BaSO4 in acidic media (HCl) with barium chloride. The absorption of light by this precipitated suspension is measured by spectrophotometer at 420 nm or scattering of light by Nephelometer.
Apparatus Required: Colorimeter for use at 420 nm, magnetic stirrer, Nessler's tubes and lab glassware.
Reagents:
- Conditioning reagent: 50 mL of glycerol is mixed in a solution containing 30 mL of conc. hydrochloric acid, in 300 mL distilled water (10% HCl), 100 mL of 95% ethyl alcohol or isopropyl alcohol and 75 g NaCl.
- Barium Chloride. Crystals, 20 to 30 mesh.
- Standard sulphate solution:147.9 mg of AR grade sodium sulphate is dissolved in distilled water and made up to 1000 mL, to give 1 mL = 100 mg sulphate.
Procedure:
- Take a suitable volume of sample in 250 mL conical flask and dilute to 100 mL.
- Add 5.0 mL conditioning reagent and mix well.
- Keep the flask constantly stirred with the help of a stirrer. Add BaCl2 crystals while stirring. Continue stirring for 1 min. after addition of BaCl2.
- Measure the turbidity developed after the 30 sec. for 4 min. on spectrophotometer at 420 nm. After 2 min. reading will remain constant and use this for calculation.
- Prepare a standard curve by carrying standard sulphate solution through entire process. Space standard solution at 5 mg/L increment in the 0 to 40 mg/L range.
- Read the SO4 present in the sample from the standard curve.
Preparation of standard solutions:
Prepare standards at 5 mg/L increment in the 0 – 40 mg/L range from the reagents above. The absorbance of these standards is recorded from a spectrophotometer at 420 nm. Similarly, absorbance of unknown samples is also recorded. The sum of the concentrations of the various standards divided by the sum of their absorbance values gives the slope. The absorbance of unknown samples is multiplied with the slope and the dilution factor, which gives the concentration of sulphate in mg/L.
Calculation:

Where, C = total concentrations of standards and A = sum of absorbance of all standards.
Iron
Iron is the fourth most abundant element by weight in the earth's crust. In water it occurs mainly in the divalent and trivalent state. Iron in surface water is generally present in the ferric state. The concentration of iron in well-aerated water is seldom high, but under reducing condition, which may exist in some groundwater, lake and reservoir and in the absence of sulphate and carbonate, high concentration of soluble ferrous iron may be found. The presence of iron in natural water can be attributed to the dissolution of rocks and minerals, acid mine drainage, landfill leachates, sewage or engineering industries. Iron is an essential element in human nutrition. It is contained in a number of biologically significant proteins, but ingestion in large quantity results in hemochromatosis where in tissue damage results from iron accumulation. It is determined by colorimeter with an operating range of 400 to 700 nm.
Principle: The ferric form of iron is reduced to ferrous form by boiling with hydrochloric acid and hydroxylamine hydrochloride. Later phenanthroline is added at pH 3.2 to 3.3 to form soluble chelated complex of orange red colour with iron. Three moles of 1, 10 phenanthroline are required to form a complex iron with each Fe++. The colour obeys Beer's law and the intensity of colour is independent of pH from 3 to 9. Total dissolved and suspended iron can be measured with unfiltered samples. For study of ferrous ferric equilibria it is sometimes desirable to determine the ferrous content of the water sample. For each determination add 10 mL of 1 % 1, 10 phenanthroline and 1 mL of glacial acetic acid to the sample bottle before sample collection for iron. It will complex soluble ferrous iron before it is oxidised to ferric state. The addition of nitrilotriacitic acid to the system further helps to stabilise the ferrous ferric system.
Method Used: Tara Water Testing Kit.
Principle: Iron is brought into ferrous state by boiling with acid and hydroxylamine and treated with 1, 10 phenanthroline at pH 3.2 to 3.3. Three molecules of phenanthroline react with each atom of ferrous iron to form an orange-red colour complex. A pH between 2.9 and 3.5 ensures rapid colour development in the presence of excess of phenanthroline.
Reagents: Hydroxyl amine hydrochloride, Ammonium acetate buffer, 1, 10 phenanthroline, HCl.
Procedure: Take 5 mL of sample, add 0.4 mL of HCl and 4 drops of Hydroxylamine hydrochloride, and heat the sample on a sprit lamp till the liquid reduces to 1/3 of its initial volume. Allow it to cool and add 1mL of Ammonium acetate buffer and 0.4 mL of 1, 10 phenanthroline and wait for 10 or 15 minutes for colour development and compare the colour with the standard colour chart given by Tara Water Testing Kit and record the volume in mg/L.
Nitrates
The nitrate ion is the common form of combined nitrogen found in surface waters. By denitrification process, it may be bio-chemically reduced to nitrite under anaerobic conditions. The significant sources of nitrates are chemical fertilisers from cultivated lands, drainage from livestock feeds, as well as domestic and industrial sources. Natural waters in their unpolluted state contain only minute quantities of nitrates. The stimulation of plant growth by nitrates may result in eutrophication, especially due to algae. The subsequent death and decay of plants produce secondary pollution. Nitrates are most important for biological oxidation of nitrogenous organic matter. Certain nitrogen fixing bacteria and algae have the capacity to fix molecular nitrogen in nitrates. The main source of polluting nitrates is the domestic sewage let into waterbodies. Nitrates may find their way into groundwater through leaching from soil and at times by contamination. Waters with high concentrations (>45mg/L) can represent a significant health risk. Beyond this value methemoglobinemia takes place. They can be measured by the phenoldisulphonic method.
Principle: Nitrates react with phenoldisulphonic acid and produce a nitrate derivative, which in alkaline solution develops yellow colour due to rearrangement of its structure. The colour produced is directly proportional to the concentration of nitrates present in the sample.
Apparatus Required: Nessler's tube, pipettes, beakers, spectrophotometer, Cuvettes, measuring jar and hot water bath.
Reagents:
- Phenol disulphonic acid:25 g of phenol is dissolved in 150 mL of concentrated sulphuric acid, 85 mL of sulphuric acid is further added and heated for about 90 min on a water bath and stored in dark bottles upon cooling.
- Sodium hydroxide:About 50 g of sodium hydroxide is dissolved in 150-200 mL of water and cooled.
- Conc. Ammonium hydroxide
- Stock nitrate solution:721.8 mg (0.722 g) of AR potassium nitrate is dissolved in distilled water and made up to 100 mL for stock solution.
- Standard nitrate solution:Standard nitrate solution is prepared by evaporating 50 mL of the stock solution to dryness in the water bath. The obtained residue is dissolved in 2 mL of phenol disulfonic acid and diluted to 500 mL, to give 1 mL = 10 mg. The solution of various strengths ranging from 0.0 (blank) to 1.0 mg/L at intervals of 0.2 mg/L is prepared by diluting stock solution with distilled water.
Procedure: A known volume (50 mL) of the sample is pipetted into a porcelain dish and evaporated to dryness on a hot water bath. 2 mL of phenol disulphonic acid is added to dissolve the residue by constant stirring with a glass rod. Concentrated solution of sodium hydroxide or conc. ammonium hydroxide and distilled water is added with constant stirring to make it alkaline. This is filtered into a Nessler's tube and made upto 50 mL with distilled water. The absorbance is read at 410 nm using a spectrophotometer after the development of colour. Taking concentration along X-axis and the spectrophotometric readings (absorbance) along Y-axis the standard graph is plotted. The value of nitrate is found by comparing absorbance of sample with the standard curve and expressed in mg/L.
Preparation of Standard solutions:
From stock solutions working standards are prepared. From working standards a series of standards of known concentration are prepared and diluted to 50 mL using distilled water. The absorbance of these standards is recorded from spectrophotometer at 410 nm. Similarly, absorbance of unknown samples is also recorded. The sum of the concentrations of the various standards divided by the sum of their absorbance values gives the slope. The absorbance of unknown samples is multiplied with the slope and the dilution factor, which gives the concentration of nitrates in mg/L.
Calculation:

where, C = sum of concentrations of the standard nitrate solution used.
A = sum of absorbance of the standard nitrate solution used.
Phosphates
Phosphate’s role in promoting plant growth actually makes it a dangerous pollutant when dumped in excessive quantities into aquatic ecosystems. In fact, plants have so much difficulty that the chemical is a limiting nutrient. The rate at which plants can grow and reproduce is limited by the amount of usable phosphate in the soil or water (for aquatic plants). When extra phosphorous was added to water due to anthropogenic activities, it creates a condition called eutrophication that can wipe out aquatic ecosystems. Eutrophication is characterised by a rapid growth in the plant population (an algal bloom). The bacteria that decompose the dead plants use oxygen, and eventually burn up so much that not enough remains to support fish, insects, mussels, and other animals, leading to a massive die-off. The presence of phosphates in virtually every detergent, including household cleaners and laundry soap, fertiliser run-off from agriculture and landscaping, decomposition of organic matter continues to be a major source of phosphate pollution. Animal wastes can also add significant amounts of phosphate to water. In most surface waters, concentration of phosphorus ranges from 0.005 to 0.020 mg/L PO4- P.
Principle: In acidic conditions orthophosphate reacts with ammonium molybdate forming Molybdophosphoric acid, reduced further to molybdenum blue by stannous chloride. The intensity of the blue colour is directly proportional to the concentration of phosphate. The absorbance is noted at 690nm using spectrophotometer.
Apparatus Required: Spectrophotometer, lab glassware, hot plate and Nessler's tube.
Reagents:
- Ammonium molybdate reagent:25 g ammonium molybdate is dissolved in 175 mL distilled water. 280 mL concentrated sulphuric acid is added to 400 mL distilled water and cooled. Molybdate solution is added and the mixture diluted to 1000 mL.
- Stannous chloride reagent:2.5 g fresh stannous chloride is dissolved in 100 mL glycerol, heated on water bath and stirred with the glass rod to hasten dissolution.
- Standard phosphate solution:219.5 mg of dried AR potassium hydrogen phosphate is dissolved in distilled water and made up to 1000 mL, where 1 mL = 50.0 mg. of phosphate. 10 mL of the stock solution is made up to 1000 mL to give 1 mL = 0.05 mg. Standards of strength ranging from 0 (blank) to 0.05 mg/L at intervals of 0.01 mg is prepared by diluting the stock with distilled water.
Procedure: To 50 mL of the filtered sample, 4 mL of ammonium molybdate reagent and about 4-5 drops of stannous chloride reagent is added. After about 10 min but before 12 min, the colour developed is measured photometrically at 690 nm and calibration curve is prepared. A reagent blank is always run with same treatment with distilled water as sample. The value of phosphate is obtained by comparing absorbance of sample with the standard curve and expressed as mg/L.
Preparation of standard solutions:
From stock solutions working standards are prepared. From working standards a series of standards of known concentration are prepared and diluted to 50 mL using distilled water. The absorbance of these standards [known concentration] is recorded from spectrophotometer at 690 nm. Similarly absorbance of unknown samples is also recorded. The sum of the concentrations of the various standards divided by the sum of their absorbance values gives the slope. The absorbance of unknown samples is multiplied with the slope and the dilution factor, which gives the concentration of phosphate in mg/L.
Calculation:

where, C = sum of concentrations of the standard nitrate solution used.
A = sum of absorbance of the standard nitrate solution used.
High phosphorus content causes increased algal growth till nitrogen becomes limiting, although blue green algae continue to dominate because of its ability to utilise molecular nitrogen. Besides sedimentation, high uptake by phytoplankton is one of the reasons for fast depletion of phosphorus in water.
Biological Parameter
Biological Coliform
Storm water combined with sanitary sewers can flush bacteria laden water into streams. Total coliform bacteria are a collection of relatively harmless microorganisms that live in large number in the intestine of man, and warm and cold blooded animals. They aid in the digestion of food. A specific sub-group of this collection is the faecal coliform bacteria, the most common member being Escherichia coli (E. Coli). These organisms may be separated from the total coliform group by their ability to grow at elevated temperatures and are associated with the faecal material of warm-blooded animals. The presence of faecal coliform bacteria in aquatic environment indicates that the water has been contaminated with the faecal material. At the same time the pathogens or diseases producing bacteria or virus that are co-existing with faecal material might also contaminate the water. This results in the outbreak of water born diseases like typhoid, dysentery, diarrhoea, viral and bacterial gastroenteritis and hepatitis A.
The presence of coliform in drinking water is consistently associated with organisms that produce hydrogen sulphide (H2S). Furthermore, enteric bacteria such as Salmonella, Proteus, Citrobactor and some strain of Klebsiella also produce H2S. This is a very simple method for the assessment of contamination in drinking water based on the detection of H2S- producing organisms. It is estimated using the coliform media.
Procedure:
- Take a coliform media bottle.
- Fill the bottle with approximately 20 mL sample and place the lid immediately.
- Allow the bottle to stand at an ambient temperature of 35°C for 48 hours.
- If the water turns black, it is graded as unfit for consumption due to presence of coliform.
- Record the presence or absence of faecal pollution due to coliform.

