SAMPLING AND ANALYSIS OF SOIL SAMPLES
1. Soil Sampling
Soils are highly heterogeneous, hence it has to be analysed for various physico-chemical and biological variables. This also would help in assessing the amount of nutrients or amendments required for a particular soil to increase its productivity. Hence, a soil test constitutes an important component while developing an efficient soil fertility program, as well as monitoring a field for potential soil and water management problems.
Soil sampling is a technique by which a true representative sample of a given area is collected. Collection of representative samples is most important in an effective soil-testing programme as the entire analysis and recommendation depends on the sample collected.
A one-time sampling of soil representative of the entire catchment area was undertaken and analysed using standard methods.
The soil samples were collected in the Sharavathi River Basin area at the following sampling sites along with their representative habitats given in the Table 9.1, 9.2 and 9.3. Soils were collected and analysed in batches of 24 and 59 samples in upstream and 35samples in downstream during the study period.
Table 9.1. Sub-basinwise soil sampling sites in upstream catchment (Batch I)
| Sub-basin |
Habitat |
Sampling Sites |
Longitude(°E) |
Latitude (°N) |
| Yenneholé |
Built up area |
Agricultural field [1] |
74.8006 |
14.01117 |
| Hilkunji |
MDF |
Tumri [2] |
74.836 |
14.018 |
| Sharavathi |
MDF |
Yenneholé catchment [3] |
74.863 |
14.0606 |
| Linganamakki |
Open field |
Hosanagara [4] |
75.064 |
13.9035 |
| Sharavathi |
Open field |
Haridravathi [5] |
75.1058 |
13.973 |
| Hurliholé |
MDF |
Agricultural field (Adagale) [6] |
74.8174 |
13.945 |
| Linganamakki |
MDF |
Catchment (near Holébagilu) [7] |
74.963 |
14.0449 |
| Linganamakki |
Plantations |
Muppane Forest [8] |
74.7923 |
14.1082 |
| Haridravathi |
Open field |
Evergreen Forest near Dam [9] |
74.908 |
14.0789 |
| Haridravathi |
Plantation |
Island near Holébagilu [10] |
74.9031 |
14.0811 |
| Linganamakki |
SEF |
Thirumoorthimane [11] |
74.7632 |
14.043 |
| Linganamakki |
|
Way to Dam outlet [12] |
74.793 |
14.1787 |
| Linganamakki |
|
Sharavathi (Nagara) [13] |
75.099 |
14.3795 |
| Sharavathi |
MDF |
Sharavathi (I) [14] |
75.0619 |
13.8799 |
| Linganamakki |
Built up area |
Sharavathi (II) [15] |
75.0619 |
13.9018 |
| Mavinaholé |
Open land |
Sharmanavathi [16] |
75.1028 |
13.9749 |
| Haridravathi |
MDF |
Haridravathi [17] |
75.1379 |
14.0046 |
| Hilkunji |
SEF |
Hurliholé [18] |
74.8555 |
13.9913 |
| Linganamakki |
SEF |
Yenneholé [19] |
74.7606 |
14.0332 |
| Sharavathi |
MDS |
Valagere [20] |
74.8369 |
14.059 |
| Linganamakki |
Open field |
Nittur [21] |
74.9089 |
13.9437 |
| Haridravathi |
Open field |
Nandiholé [22] |
75.1425 |
14.0037 |
| Haridravathi |
Agriculture |
Keshawapura [23] |
75.1425 |
14.0087 |
| Linganamakki |
E & SEF |
Sampekai [24] |
75.0373 |
14.0575 |
Note: Numbers in the parenthesis denotes the sampling sites.
Table 9.2. Sub-basinwise soil sampling sites in upstream catchment (Batch II)
| Sub-basin |
Habitat |
Longitude
(°E) |
Latitude
(°N) |
| Nandiholé (US1) |
Teak Plantation [1] |
75.12023 |
14.1307 |
| US 1 |
Moist Deciduous [2] |
75.12087 |
14.13017 |
| US 1 |
Acacia Plantation [3] |
75.18827 |
14.09052 |
| Haridravathi (US 2) |
Acacia Plantation [4] |
75.2407 |
14.04131 |
| US 2 |
Barren Land [5] |
75.24131 |
14.04175 |
| US 2 |
Moist Deciduous [6] |
75.23309 |
13.97649 |
| US 2 |
Teak Plantation [7] |
75.20615 |
13.96308 |
| US 2 |
Paddy Field [8] |
75.20648 |
13.96277 |
| Mavinaholé (US 3) |
Teak Plantation [9] |
75.13208 |
13.92461 |
| US 3 |
Moist Deciduous [10] |
75.10901 |
13.97838 |
| Nandiholé (US 1) |
Acacia Plantation [11] |
75.14449 |
14.02441 |
| Haridravathi (US 2) |
Paddy Field [12] |
75.1248 |
14.039 |
| Linganamakki (US 9) |
Moist Deciduous [13] |
75.12484 |
14.04435 |
| US 9 |
Acacia Plantation [14] |
75.11692 |
14.05869 |
| US 9 |
Teak Plantation [15] |
75.01513 |
14.09831 |
| US 9 |
Semievergreen [16] |
74.96452 |
14.03706 |
| US 9 |
Acacia Plantation [17] |
74.9007 |
14.09993 |
| US 9 |
Pinus plantation [18] |
74.91106 |
14.09943 |
| US 9 |
Semievergreen [19] |
74.9304 |
14.07058 |
| US 9 |
Semievergreen [20] |
74.81644 |
14.15753 |
| Yenneholé (US 5) |
Barren Land [21] |
74.80147 |
14.13318 |
| US 5 |
Semievergreen [23] |
74.73947 |
14.07012 |
| US 5 |
Grassland [24] |
74.72345 |
14.03604 |
| US 5 |
Grassland [25] |
74.70749 |
14.01658 |
| US 5 |
Semievergreen [26] |
74.72285 |
13.97554 |
| US 5 |
Scrub Land [27] |
74.74624 |
13.94604 |
| US 5 |
Semievergreen [28] |
74.77741 |
13.94375 |
| Hurliholé (US 6) |
Barren Land [29] |
74.79629 |
13.96586 |
| US 6 |
Barren Land [30] |
74.85018 |
14.02186 |
| Linganamakki (US 9) |
Acacia Plantation [35] |
74.92303 |
13.91023 |
| US 9 |
Semievergreen [36] |
74.95604 |
13.89515 |
| US 9 |
Semievergreen [37] |
74.99492 |
13.85682 |
| Sharavathi (US 4) |
Barren Land [39] |
75.0661 |
13.87612 |
| Linganamakki (US 9) |
Pinus plantation [40] |
75.07997 |
13.92404 |
| Mavinaholé (US 3) |
Deciduous [41] |
75.10078 |
13.96909 |
| Sharavathi (US 4) |
Acacia Plantation [42] |
75.08728 |
13.85926 |
| Sharavathi (US 4) |
Pinus plantation [43] |
75.12433 |
13.84291 |
| Haridravathi (US 2) |
Deciduous [44] |
75.24509 |
13.90966 |
Table 9.3. Sub-basinwise soil sampling sites in downstream catchment (Batch III)
| Sub basin |
Location |
Habitat |
Longitude
(°E) |
Latitude
(°N) |
| Haddinabal (DS 2) |
Chikoli [1] |
Disturbed evergreen |
74.57969 |
14.32705 |
| Magod (DS 3) |
Hossagadde [2] |
Areca plantation |
74.54848 |
14.17009 |
| Haddinabal (DS 2) |
Mahasati [3] |
Newly grown acacia |
74.6808 |
14.26329 |
| Dabbe fall (DS 4) |
Hebbenkere [4] |
Unploughed paddy field |
74.67478 |
14.15489 |
| Dabbe fall (DS 4) |
Hallappa [5] |
Areca plantation |
74.69537 |
14.14615 |
| Dabbe fall (DS 4) |
Hebbenkere [6] |
Dist semi to evergreen |
74.67298 |
14.15785 |
| Gudankateholé (DS 3) |
Upponi village loc. 2 [7] |
Areca plantation |
74.58924 |
14.23176 |
| Dabbe fall (DS 4) |
Hebbenkere [8] |
Ploughed paddy field |
74.67408 |
14.15559 |
| DS 4 |
Dabbe [9] |
Riparian vegetation |
|
|
| DS 4 |
Hebbenkere [10] |
Riparian vegetation |
74.67298 |
14.15785 |
| Haddinabal (DS 2) |
Chandubanu [11] |
Areca plantation |
74.58376 |
14.32563 |
| DS 2 |
Mavinaholé [12] |
Areca plantation |
74.61647 |
14.24541 |
| DS 2 |
Chikoli [N] [13] |
Disturbed evergreen |
74.57969 |
14.32705 |
| Dabbe fall (DS 4) |
Hallappa [14] |
Mixed areca,pepper |
74.6955 |
14.14596 |
| DS 2 |
Chandubanu [15] |
Teak sloppy terrain |
74.58471 |
14.33088 |
| Kathalekan (DS 6) |
Kathalekan [16] |
Swamp |
|
|
| DS 2 |
Chandubanu route [17] |
Teak plain terrain |
74.56811 |
14.31705 |
| Kathalekan (DS 6) |
Kathalekan [18] |
Disturbed evergreen |
|
|
| DS 2 |
Near Chandubanu [19] |
Disturbed evergreen |
|
|
| DS 6 |
Kathalekan [20] |
Swamp |
|
|
| DS 6 |
Kathalekan [21] |
Swamp |
|
|
| DS 6 |
Kathalekan [22] |
Disturbed evergreen |
|
|
| DS 6 |
Kathalekan [23] |
Evergreen |
|
|
| DS 6 |
Sharavathi view point [24] |
Evergreen |
|
|
| Haddinbal (DS 2) |
Near Chandubanu [25] |
Disturbed evergreen |
|
|
| DS 2 |
Near Chandubanu [26] |
Disturbed evergreen |
|
|
| DS 6 |
Sharavathi view point [27] |
Evergreen[ stony] |
|
|
| Magod (DS 3) |
Near Idagunji [28] |
Acacia plantation |
|
|
| DS 6 |
Kathalekan [29] |
Evergreen |
|
|
| Dabbe fall (DS 4) |
Totaduru [Dabbe falls] [30] |
Semi to evergreen |
74.7369 |
14.14993 |
| DS 4 |
Malakanta [Hebbenkere] [31] |
Evergreen |
74.68518 |
14.14994 |
| DS 4 |
Kanur [swamp][32] |
Swamp |
74.71044 |
14.12815 |
| DS 4 |
Hebbenkere [33] |
Evergreen |
74.67621 |
14.15331 |
| Kathalekan (DS 6) |
Malemane [34] |
Evergreen |
74.73668 |
14.27731 |
| DS 6 |
Malemane [35] |
Evergreen |
74.7284 |
14.27382 |
2. Sample Collection Method
Soil samples were collected using spades, shovels and core sampler of size 15 cm X 9 cm.
3. Depth and the Number of Samples
Recommended depths for soil sampling can be in the range of 0-15 cm, 15–30 cm and 30–60 cm. Based on the type of nutrients to be analysed, sampling depths have to be selected. For immobile elements like P, K+, Ca2+ and Mg2+, sampling depth is upto 15 cm (tillage depth). But for mobile elements (NO-3 and SO2-4), it can be upto a depth of 60 cm. For general characterisation of soil, random samplings can be made at a depth of 15 cm.
The recommended number of samples can be 10–30 cores to make one good composite sample. In this study composite samples were taken randomly over an area having the size, shape and orientation of the prospective plot. Large uniform fields were divided into smaller units, not exceeding 5 ha, and a composite sample was collected from each unit. (Note: Soil samples from near the root of large trees and foundations of civil constructions were avoided, as they do not represent their natural make up).
4. Storage Technique
Samples were collected in thick quality polyethylene bags and immediately transported to the laboratory. They were shade dried (except for the analysis of moisture content) and stored. The dried soils were ground using mortar and pestle (taking care to break only the aggregate but not the sand and gravel particles) and sieved through a 2-mm mesh sieve.
5. Physico-Chemical Analyses
The main objective of physico-chemical analyses is to assess the general characterisation of soils in the Sharavathi catchment area. The physical parameters analysed were bulk density, moisture content, pH and electrical conductivity. Chemical parameters analysed were alkalinity, acidity, chloride, sulphate, phosphate, nitrate, sodium, potassium, calcium, magnesium, organic matter, organic carbon and lime requirement.
The analyses of the soil qualities were done as per the standard methods provided by Encyclopaedia of Environmental sciences-15 and Methods manual for forest soil and plant analysis.
Table 10. Soil quality parameters and its method of analysis.
| Physical Parameter |
Method of Analysis |
| Moisture Content (%) |
Gravimetric |
| Bulk Density (g/cm3) |
Gravimetric |
| Water Holding Capacity (%) |
Gravimetric |
| Colour |
Visual Comparison |
| Chemical Parameter |
|
| pH |
Electrometric |
| EC (mS/cm) |
Electrometric |
| Acidity (mg/g) |
Titrimetric |
| Alkalinity (mg/g) |
Titrimetric |
| Chlorides (mg/g) |
Titrimetric |
| Calcium (M.eq/100g) |
Titrimetric |
| Magnesium (M.eq/100g) |
Titrimetric |
| Sodium (mg/g) |
Flame Photometer |
| Potassium (mg/g) |
Flame Photometer |
| Available Potassium (mg/g) |
Flame Photometer |
| Sulphate (mg/g) |
Spectrophotometer |
| Nitrate (mg/g) |
Kjeldahl |
| Phosphate (mg/g) |
Bray's Extractant |
| Available Phosphorus (mg/g) |
Spectrophotometer |
| Organic Carbon (%) |
Wet Digestion |
| Organic Matter (%) |
Wet Digestion |
| Lime Requirement |
Electrometric |
Physical Parameters
Moisture Content
Water present in the soil acts as a solvent, transporting agent and maintains the compactness of soil, thereby making it habitable for plant and microorganisms. Soil gets moisture from infiltration of precipitated water and irrigation. It is directly proportional to the water holding capacity. It more or less depends on water holding capacity of soil. However, it drains through percolation, evaporation and uptake by plants and helps in maintaining the soil texture and compactness.
Materials Required: Oven and chemical balance.
Procedure: Weigh a fresh soil sample (X1) (this is done prior to shade drying of soil samples) allow it to dry in an oven at 105°C until a constant weight is obtained . Cool in a desiccator and record the final weight of the sample (X2).
Calculation:
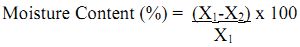
where, X1 = Initial weight of sample (g)
X2 = Final weight of oven dried sample (g).
Bulk Density
It is determined as the oven dry weight of a unit volume of soil, expressed in g/cm3. Bulk density is inversely proportional to the pore space of the soil i.e., Soils with high bulk density are less porous and hence compact in nature and soils with low bulk density are highly porous and loose in nature. Soils exhibiting high bulk density have low permeability and infiltration and are inhibitive to root penetration. The bulk density of soil generally varies from 1.1 to 1.5 g/cm3 for fine textured soils and 1.2 to 1.65 g/cm3 for coarse textured soil. It is slightly higher in case of alkaline saline soil. The bulk density of soil generally increases with depth due to the low organic matter content of the lower layer and due to compaction from the pressure of the upper layer, because of the use of implements and machinery. The soil having high bulk densities are found to be inhibitive to root penetration and have low permeability and infiltration. The bulk density has been inversely related to pore space of soil.
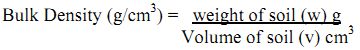
Materials Required: Oven, measuring cylinder, and balance.
Procedure: Collected sample is dried in an oven at 105°C until the constant weight is attained. Place a known amount of this soil (w) in a measuring cylinder and record the volume (v).
Calculation:
Water Holding Capacity
Water holding capacity of the soil is defined as the point at which the soil is completely saturated with water with no pore spaces to hold the water. It mainly depends on the physical and chemical nature of the soil. Water holding capacity is influenced by the hydrological cycle and it varies with time and season.
Method: Gravimetric method
Procedure: Weigh the funnel and filter paper [W
1]. Then pipette 10 mL distilled water to moisten the filter paper. Observe till no water drops and then weigh the moist filter paper and funnel [W
2]. Then add 5 g dried soil sample to W
2 and record the weight [W
3]. Pipette 25 mL distilled water to W
3 so that the soil is completely soaked in water and again add 10 mL distilled water subsequently (twice) and observe till no water drops from the funnel and weigh this set up (W
4).
Calculations:
Water Holding Capacity = [W4 -W3] – [W2 – W1]/ [W3 – W2] x 100 = ___ %
Weight of the funnel and filter paper = W1 g
Weight of the funnel and wet filter paper = W2 g
Weight of the funnel, wet filter paper and soil = W3 g
Weight of the funnel, wet filter paper and wet soil = W4 g
Unit: Percentage [%]
Colour
Based on the dominant colouration, soil colour is determined.
Chemical Parameters
pH of Soil and Sediment
The pH of soil is an important physico-chemical property that influences the suitability of a soil for a crop, availability of nutrients, microbial activity and physical property of soil. It also indicates the need of lime and gypsum application. It also shows the bottom decomposition condition of aquatic ecosystem.
Method: Using pH meter with glass-calomel electrode.
Materials required: pH meter, pH-4, 7.2 and 9.2 solutions.
Procedure: Weigh 10 g of air dried soil or sediment and add 100 mL distilled water to make the suspension of 1:10 w/v dilution. The pH meter is calibrated using the standard solution and the reading of suspension is found out. The categories of soil based on the pH are given in Table 11.
Table 11. Soil categories based on the pH.
| pH |
Nature |
Interpretation |
| Less than 6.5 |
Acidic |
Requires liming. |
| 6.5 to 8.5 |
Neutral |
No amendment, optimum for crops |
| Greater than 8.5 |
Alkaline |
Require gypsum for reclamation |
Electrical Conductivity
Conductivity is a measure of the current carrying capacity, thus, gives a clear idea of soluble salt present in the soil. Conductivity values depend on the dilution of the soil suspension, and if left for few hours microbial activity can affect the result. Conductivity is determined using conductivity meter which has conductivity cell consisting of two platinum electrodes in the form of rectangular pieces fused on one side and covered with black spongy platinum on the other. Two wire heads connect it to proper terminals on the solute bridge. Cell constant is given with the equipment.
The properties of soil based on the electrical conductivity values are categorised in four classes, which are given in Table 12.
Table 12. Soil properties based on the EC values.
| EC (mS/cm) |
Nature of soil |
| < 0.8 |
Normal. |
| 0.8 to 1.6 |
Critical for sensitive crops. |
| 1.6 to 2.5 |
Critical for salt tolerant crops. |
| > 2.5 |
Injurious for many crops. |
Method: Conductivity meter
Materials Required: Conductivity meter, glassware to prepare soil suspension.
Procedure: Prepare soil suspension using 10 g soil and 25 mL distilled water and dip the electrode of conductivity meter into the soil suspension and record the readings.
Calculation:
Electrical Conductivity = X * Y mS/cm.
where, X = cell constant of the conductivity cell, Y = solute bridge reading
Acidity
Generally, soil becomes acidic in high rainfall areas through the process of leaching (organic acids). Considerable portion of the exchangeable cations in acidic soils are various forms of hydrated aluminium and some lesser amounts of H+ ions. The sources of H+ ions, which are the initial source of solution acidity, are as follows;
- Carbon dioxide from humus decomposition and root respiration.
- Oxidation of NH4+ from fertilisers.
- Oxidation of added elemental sulphur.
- Excreted H+ ions by plant root.
- Acid rain (sulphur and nitrogen oxides pollutants).
- Crop removal of the basic cations (Ca, Mg, K, Na) and excretion of H+ by root.
Method: Titrimetric method.
Reagents used:
- Standard sodium hydroxide 0.02N: Dissolve 0.8 g NaOH and dilute to 1000 mL using CO2 free distilled water. Store in an airtight, rubber stoppered glass bottle to protect from atmospheric CO2. Standardise against 0.02N potassium biphthalate.
- Phenolphthalein indicator: Dissolve 0.5 g in 500 mL 95% ethyl alcohol and add 500 mL distilled water. Add drop-wise 0.02N NaOH till faint colour appears.
- Methyl orange indicator: Dissolve 0.5 g methyl orange and dilute to 1000 mL with CO2 free distilled water.
Procedure:
- Weigh 5-10 g of dried soil and make 1:10 w/v suspension and filter the sample using a filter paper Whatman no.44.
- Take the 10 or 25mL suspension and add 2 drops of methyl orange and titrate against standard 0.02N NaOH till the colour changes to faint orange and note down the volume of NaOH consumed.
Calculation:
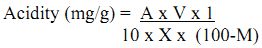
Where A= Alkalinity of filtrate (mg/L).
V= Total volume of suspension.
X= Weight of soil (g).
M= Moisture content of soil (%).
Alkalinity
Soils are alkaline due to free calcium and magnesium carbonate. It increases due to irrigation water containing higher quantity of sodium, calcium and magnesium. Theoretically, if sodium is not the factor, even if large quantities of calcium and magnesium carbonate are applied, the soil pH will not increase from 8.2 because at pH 8.2 the soil carbonate reaches equilibrium with atmospheric CO2.
Method: Titrimetric method.
Reagents Used:
- Standard H2SO4 (0.02N): prepare the reagent from the supplied sulphuric acid using the formula V1N1 = V2N2 .
- Phenolphthalein indicator: Dissolve 0.5 g phenolphthalein in 50 mL 95% ethyl alcohol. Add 50mL distilled water and add 0.05N CO2 free NaOH solution drop wise, until the solution turns faintly pink.
- Methyl orange indicator: Dissolve 0.5 g of methyl orange in 100 mL distilled water.
Procedure: Prepare soil suspension of 1:10 ratio and take 5 or 10 mL of this suspension in a conical flask, add 2 or 3 drops of phenolphthalein indicator. If the solution remains colourless, the PA is zero and if the solution turns pink then titrate against 0.02N H2SO4 until the colour disappears and note the volume consumed (H2SO4). Now add 2 or 3 drops of methyl orange indicator in the same sample and continue the titration until the yellow changes to pink at the end point. This gives the total alkalinity.
Calculation:
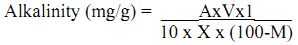
where, A = alkalinity of filtrate (mg/L)
V = total volume of suspension (mL)
X = weight of soil/ sediment used in suspension (g)
M = moisture content of soil or sediment (%).
Chloride
Most of the chlorides in the soil and sediment are soluble in water and determined directly in soil solution or suspension. Silver nitrate reacts with chloride to form very slightly soluble white precipitate of silver chloride and at the end point when all the chloride gets precipitated, free silver ions react with chromate to form silver chromate of reddish brown colour.
Method: Titrimetric method:
Reagents:
- Silver Nitrate (0.014N) Dissolve 2.395 gof AgNO3 in distilled water and dilute upto 1000 mL, and standardise against NaCl (0.014N).
- Potassium chromate indicator: Dissolve 50 g of K2CrO4 in distilled water and add AgNO3 till red precipitate is formed. Allow standing for at least 12 hours.
Procedure: Prepare 1:10 (w/v) soil / sediment suspension and take 5 or 10 mL in conical flask and add 1 mL of potassium chromate. Now titrate against silver nitrate which at the end point colour changes from yellow to brick red.
Calculation:
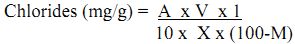
where, A = chloride estimated in filtrate (mg/g)
V= total volume of suspension (mL)
X= weight of soil or sediment used in suspension (g) and
M = moisture content of soil or sediment (%).
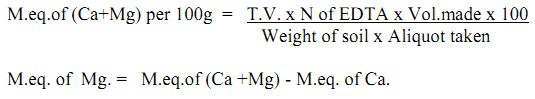
Calcium and Magnesium
Calcium is a very important cation in soil, soil water sediment and waters in lakes and streams. The average Ca content in soil is estimated to be 1.4%. It may vary from soil to soil depending upon the climatic conditions. Soil in desert climate may be high in Ca, often containing CaCO3 in horizons. In humid region, drastic leaching has removed most of the Ca minerals from the soil. The average Mg content in soil is estimated to be approximately 0.5%, whereas its concentration in soil water is estimated to be 10 mg/L.
Method: Titrimetric method:
Principle: In alkaline condition, EDTA reacts with Ca and Mg to form a soluble chelated complex. Ca and Mg, ions develop wine red colour with Eriochrome black-T under alkaline condition, which is the end point of titration.
Reagents used:
- Buffer solution: Dissolve 67.5 g of NH4Cl in 200 mL of distilled water and add 570 mL conc. NH4OH further diluted to 1000 mL with distilled water.
- Std. EDTA solution: Dissolve 1.86 g of disodium salt of EDTA in distilled water and make upto 1 L to get 0.01N solution.
- Eriochrome Black - T (EBT) indicator: 0.5 g of Eriochrome black-T indicator is dissolved in 100 g of triethanolamine.
- Murexide indicator: Mix 0.2 g of ammonium purpurate with 40 g of finely grounded potassium sulphate and grind again in agate/glass pestle and mortar.
- 10% NaOH solution: Dissolve 10 g of NaOH in distilled water and make upto 100 mL.
- Buffer complex solution: Mix 50 mL of each of KCN solution, hydroxyl amine hydrochloride solution, potassium ferrocyanide solution and triethanolamine with 800 mL of buffer solution (should not be kept for more than a week).
- Ammonium acetate soil extract: Weigh 5 or 10 g of air dry soil or sediment and add 100 mL ammonium acetate solution to get 1:10 w/v suspension. Now filter it with the filter paper (Whatman No. 44).
Procedure:
- Calcium and Magnesium: Transfer 5 or 10 mL ammonium acetate extract in to a conical flask and add 5 to 10 mL buffer complex to get pH of about 10, add EBT indicator and titrate the content with std. EDTA till colour changes from pink to blue.
- Calcium: Transfer 5 or 10 mL of ammonium acetate extract into a conical flask and add sufficient quantity of 10% NaOH solution to attain a pH of 12 or more. Now add a pinch of Murexide indicator and titrate it against std. EDTA solution till the colour changes from pink to violet.
Calculation:
Sodium and Potassium
Sodium and Potassium compounds are widely distributed in nature. The sodium content of normal soil is on the average 0.63%, whereas that of potassium is approximately 0.83%. The mineral source of Na and K are sodium aluminium silicate and potassium aluminium silicate. This can also occur in nature as chloride, sulphate and borate. The concentration of Na+ and K+ ions in soil water are relatively low if compared with their content in soil. On the average, the K concentration in soil solution is 5 mg/L, whereas that of Na is 10 mg /L or larger. Both ions are stable in soil water and very difficult to precipitate. Only by complex formation can K+ ion be precipitated. In soil and sediment these ions exist mostly as exchangeable cations.
Method: Flame Photometer
Principle: An atomiser under controlled condition sucks the solution. The radiation from the flame enters a dispersing device in order to isolate the desired region of spectrum. The intensity of isolated radiation can be measured by a phototube. It is possible to co-relate the intensity of given spectral line of the unknown with the amount of element present that emits the particular radiation.
Reagents Used:
- Stock sodium solution: Dissolve 2.254 g (dried at 140°C) sodium chloride in 1000 mL of distilled water (1 mL = 1 mg Na).
- Working sodium solution: Dilute 10 mL of stock solution to 1 litre (1mL= 0.10 mg Na).
- Stock potassium solution: Dissolve 1.907 g (dried at 110°C) KCl in 1000 mL distilled water to get 1 mL = 1 mg K.
- Working potassium solution: Dilute 10.0 mL of the stock solution to 1 litre to get 1mL = 0.10 mg K.
- Soil Extract: Weigh 5 or 10 g soil or sediment sample and add 100 mL ammonium acetate solution to get a suspension of 1:10 w/v ratio. Now, filter the sample using the filter paper Whatman no.44.
Procedure:
- Calibrate the flame photometer using the standard solution of sodium and potassium.
- Now feed the soil extract to the flame photometer and write the reading.
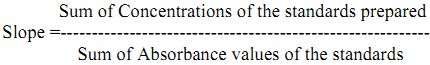
Calculation:

where, C = Sum of concentrations of standard solution
A = Sum of the absorbance of the corresponding standard solution
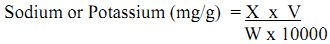
where, X= sodium or potassium content of soil extract (mg/L)
V = total volume of soil extract (mL)
W= weight of air-dry soil/sediment which is taken for extraction.
Available Potassium
Potassium is present in all parts of plants in fairly large amounts. It is more important for the leaves and the growing parts. Potassium helps in the formation of proteins and sugars in the plant and in the transport of these from one part of the plant to the other. It also regulates the water conditions within the plant and helps in the formation of complex substances required for the plant body. In cereals with a mild potassium deficiency, the shoots become very thin and in case of acute deficiency the plants may be thin and stunted, the shoots may die and many tillers may form without any flowering stems. Due to potassium deficiency, the leaves of most plants show a dull bluish green colour with some whitish spots in the beginning. The tips of the older leaves become brown and the margins of the leaves show a scorching effect. In addition, brown spots develop on the leaves, which are most numerous near the margins. The leaves of many of the broad-leaved plants show a curling effect. The plants become very stunted, internodes of the stems are short, the root development is poor, the production of the grains and fruits is very restricted and the size of the individual grains become small. The available K in soils is generally the sum of water soluble and exchangeable potassium. It gives an idea about the nutrient status of the soils under study.
Range and interpretations
| Available K2O [Kg/ha] |
Rating |
| < 141 |
Low |
| 141 – 336 |
Medium |
| > 336 |
High |
Reagents
- Neutral N Ammonium acetate solution: Dissolve 77.09 g of ammonium acetate in distilled water and make up the volume to 1 L. Adjust the solution pH to 7.0 using acetic acid or ammonium hydroxide solution as required.
- Potassium chloride solution: Dissolve 1.908 g of AR grade potassium chloride (dried at 60°C for 1 hour) in distilled water, and make up the volume to 1 L. It gives 1000 mg/L K solution and is treated as stock solution of potassium.
Standard curve for K (working K standards): From the stock solution take measured aliquots and dilute with ammonium acetate solution to give 10 – 40 ppm of potassium.
Procedure: Take 5 g of soil and add 25 ml of neutral normal ammonium acetate solution in a conical flask. Shake the contents of the flask on an electric shaker for 5 minutes and filter. Use the filtrate for analysis using flame photometer.
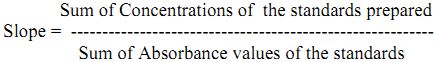
Preparation of standard curve: Dissolve 1.91 g of potassium chloride in distilled water and make up the volume to 1000 mL to give 1000 mg/L solution of potassium. From this prepare the 100 mg/L working solution from which pipette out 10, 15, 20, 30, 40 mg/L of the standard solution in different volumetric flasks and record the absorbance/emission values. From the absorbance/emission values of standards and corresponding concentrations slope is obtained.
Sum of Concentrations of the standards prepared
The absorbance/emission values obtained for samples are multiplied with slope and dilution factor which gives concentration of samples in mg/L. To convert mg/L to kg/ha multiply with 2.24.
Sulphate
Sulphur exists in soil and soil water or sediment as SO42- ions in combination with the cations, Ca, Mg, K, Na, or NH4+. Present in the form of elemental sulphur, it oxidises in aerobic condition and converts quickly into SO42-. Under anaerobic conditions, SO42-, may be reduced by microorganism into SO32- or H2S. Since, most of the sulphur salt is soluble, sulphate is expected to be lost rapidly by leaching. The anionic nature of the sulphate ion prevents its attraction by clay colloids. However, soils containing hydrous oxide clays or sesquioxide have been reported to absorb considerable amount of sulfate (Tisdale and Nelson, 1975,1993). The positively charged surface of this sesquioxide clay may cause electrostatic attraction of the negatively charged sulphate ions. Despite the fact that plant absorbs S almost exclusively as SO42-, mobility of SO42- in soil may not always yield satisfactory results in accordance with the time of sampling, while assessing SO42- availability.
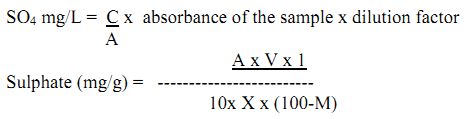
Method: Using Spectrophotometer at wavelength 420 nm.
Reagents Used:
- Conditioning reagent: Mix 50 mL glycerol with a solution containing 30 mL concentrated HCl, 300 mL distilled water, 100 mL 95% ethyl alcohol or isopropyl alcohol and 75 g NaCl.
- Barium Chloride: Crystals 20 or 30 mesh.
- Standard sulphate solution: Dissolve 147.9 mg anhydrous Na2SO4 and dilute to 1000 mL. (1mL = 100mg SO4 )
Procedure: Weigh 10 g of dry soil or sediment and by adding distilled water (100 mL) prepare the suspension of 1:10 w/v ratio and filter the suspension using filter paper Whatman No. 44. Take 25mL of this suspension in a conical flask and add 2.5 mL conditioning reagent followed by pinch of BaCl2. Now, take the reading on the spectrophotometer at wavelength 420 nm. At the same time take the reading of standard solution of sulphate (1 mL for 2 ppm, 2 mL for 4 ppm, 3mL for 6 ppm, 4 mL for 8 ppm).
Calculation: Find out the value of C/A for the standard solution and then multiply the absorbance and dilution factor with the found value of C/A.
Nitrate
Nitrogen exists in soil in organic and inorganic forms and it is also present in several oxidations states e.g. -3 to +6. The total present soil nitrogen content varies considerably from 0.05% in the desert soil and 0.3% in warm humid region soil or higher in the soil of semi-humid like mollisols. In soil-water the concentration of nitrogen is even lower, constituting only a small fraction of the amount present in soil. Under normal conditions, 2.4 mL nitrogen will dissolve in 100 mL water. Most of the nitrogen in soil (98%) is in the form of organic compound. It is also present in plant residue, barnyard manure and industrial and domestic waste. Some of these organic nitrogen compounds such as amino acids are soluble in soil water. However, most of the nitrogen in soil water is in inorganic form like NH4+, NO3- and NO2-. The latter is released in soil water by decomposition of soil organic matter. Inorganic nitrogen can also be added to soil by the application of fertilizers.
The inorganic nitrogen compounds NO2- (nitrite) and NO3- (nitrate) are the products of nitrification NH4+. Nitrate is used in industry for the manufacture of drugs, plastics, rayon, dyes and for curing meat products. Ham and bacon are cured with NaNO3. Nitrate is also an important ingredient for the production of explosives like TNT (trinitrotoluene) and gunpowder. In soil-water nitrate is stable in the absence of organic compounds.
Method:
Phenol Disulphonic Acid Method: This method of estimation of nitrates depends on the nitration of 2,4 - disulphonic acid in fuming sulphuric acid.
C6H3OH(HSO3)2 + 2HNO3 = C6H2(OH)(NO2)3 + 2H2SO4 + H2O
The product trinitrophenol behaves as a nitrophenolic type indicator and is colourless in acid medium and yellow when neutralised or in alkaline solution. A hydroxide such as KOH or NH4OH is employed to shift the pH to the yellow colour range.
C6H2(OH)(NO2)3 + 2 KOH = C6H2(OK)(NO2)3 + H2O
The nitrate solution is dried prior to determination, as the reaction is effected in the presence of water.
Reagents:
- Extractant solution: Mix 20mL of 1N CuSO4 and 100mL of 0.6% Ag2SO4 solution and dilute to 1 L.
- Phenol 2,4 disulphonic acid: Dissolve 25g of pure phenol (white in colour) in 150 mL of conc.H2SO4. Then add 75 mL fuming H2SO4 (15% free SO3), stir well and heat for 2 hours on water bath. If fuming sulphuric acid is not available, add additional 85mL of conc. H2SO4 to the 150 mL H2SO4 stir well and heat for 2 hr.
- 6N NH4OH solution: Mix one part of strong ammonia in one part of water.
- Std. Solution: Dissolve exactly 0.1629 g of pure KNO3 in water and dilute to 1L to give 100 ppm of NO3. Prepare a dilute NO3 standard having 10 ppm concentration.
Extraction of NO3 from soil:
- Weigh 50g of soil into a 500 mL conical flask, add 250 mL of extraction reagent and shake for 10 minutes and add 0.5 g of Ca(OH)2 . Continue shaking for 5 minutes and add 1 g of MgCO3 (to precipitate Ag and Cu and clarify the solution).
- Collect the filtrate by filtering through a dry Whatman No. 42 filter paper.
Estimation:
- Take 20 mL of aliquot in a porcelain dish and evaporate to dryness.
- Cool and add 3 mL of PDA directly into the centre of the basin.
- Swirl the content so that all the residual salts come in contact with PDA and allow the reagent to act for 10 minutes.
- Add 15 mL of cold water and stir the solution with a glass rod.
- Add 6N NH4OH slowly till the solution turns yellow (by alkaline condition) and add 3 mL excess (total volume should not exceed 100 mL).
- Transfer all the contents of the basin to 100 mL volumetric flask.
- Read the intensity of yellow colour at 420 nm using a spectrophotometer.
Preparation of Std. Graph:
- Pipette out std. Solution to get 1,2,3,4 and 5 ppm of NO3 into porcelain dish and evaporate to dryness. Follow the same steps (b) to (g) indicated above.
- Plot the absorbance against concentration and obtain a standard graph.
Calculation:

lbs = pounds, ac = acre
Phosphate
The inorganic phosphorus content in soil is higher than organic P content (Tisdale and Nelson 1975, 1993). In solution the phosphorus is present in the form of H
3PO
4 or the secondary HPO
42- orthophosphate ion. The concentration of these ions in the soil solution depends on the pH. In acidic soil, H
2PO
4- will dominate than HPO
42-. At pH 6 to 7 both forms are equally represented in the soil solution whereas at pH greater than 7.0, HPO
42- will be dominant together with some PO
43- ions. Maximum availability of these phosphate ions for plant growth occurs within the pH range of 5.5 to 6.5 (Tisdale and Nelson, 1975, 1993). Large amounts of phosphorus ions are detrimental to the environment. Phosphate reacts readily with metals present in soil. Acid soils contain large amounts of Al, Fe, and Mn, which form complexes or insoluble metal-phosphate compounds. The reaction is phosphate fixation
.
Method: Ammonium molybdate method Using Spectrophotometer at 690 nm.
Principle: In acidic condition, orthophosphate reacts with ammonium molybdate to form Molybdophosphoric acid. It is further reduced to molybdenum blue by adding reducing agent stannous chloride. The intensity of the blue coloured complex is measured which is directly proportional to the concentration of phosphate present in the sample.
Reagents Used:
- Stock phosphate solution: It is prepared by dissolving 4.388 g of dried anhydrous potassium hydrogen phosphate in distilled water to make 1000 mL. Now take 10 mL of this solution and prepare 1 litre using distilled water having 1 mg P/L.
- Working phosphate solution: Take different volume from this stock solution to prepare standard working solution like 0.5 mL for 0.01 ppm, 1.0 mL for 0.02 ppm, 1.5 mL for 0.03 ppm, 2.0 mL for 0.04 ppm and so on.
- Ammonium molybdate solution: Dissolve 31.4 g in about 200 mL distilled water. Add carefully 252 mL conc. H2SO4 to 400 mL distilled water. Cool and add 3.4 mL conc. HNO3. To this solution add ammonium molybdate solution and dilute to 1000 mL.
- Sulphuric acid (0.002N): Take 16.66 mL of concentrated sulphuric acid and dilute it to 100mL to get the bench solution of strength 2N. Further, dilute it taking 1mL to 1000 mL to prepare solution of strength 0.002N.
Method: Take 1 g air-dried soil or sediment sample in 500mL flask and add 200mL H2SO4 (0.002N). Shake for about half an hour and filter the suspension through the filter paper (Whatman No.50). Now take 5 or 10 mL of this suspension and add 1 mL ammonium molybdate solution followed by 3 drops of stannous chloride to get a blue colour and measure the absorption using a spectrophotometer. At the same time the absorption for the standard is also estimated.
Calculation:
Calculate the C/A and multiply with the absorbance and dilution factor.

where, C = sum of concentration of all standard solution used.
A = sum of absorption of all standard.
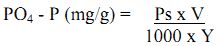
where, Ps = PO4 - P estimated in the suspension (mg/L). V = total volume of suspension (mL), Y= weight of air dry soil or sediment taken.
Available Phosphorus
Phosphorous is also one of the most important constituents of all living cells and is very important for the formation of roots, tillers, seeds and fruits. This element also helps in the proper absorption of nitrogen by the plant and helps the crops to mature early. Due to the deficiency of phosphorous, the leaves develop a dull bluish green colour, with shades of purple and sometimes showing brown spots. Apart from this, the effects of phosphorous deficiency are similar to those due to nitrogen deficiency. The maturity of the crops is delayed due to the deficiency of phosphorous. In cereals phosphorous deficiency causes a dark bluish green colour of the leaves and the stems, which later on show a purple colour. Available phosphorus in soils represents a fraction of the total phosphorous which is susceptible to plant uptake during their growth. It gives an idea about the nutrient status of soil under study.
Range and interpretations
| Amount of P2O5 [kg/ha] |
Rating |
| <22.9 |
Low |
| 22.9 – 56.33 |
Medium |
| > 56.33 |
High |
Reagents
- Bray’s extractant No 1 [0.03 N NH4F in 0.025 N HCL] : Dissolve 1.11 g NH4F in 250 ml distilled water and then add 2 ml of concentrated hydrochloric acid and make up the volume to 1 L.
- 1.5 % Ammonium Molybdate : Dissolve 15 g of ammonium molybdate in 300 ml hot distilled water [50 – 60 oC]. Filter if necessary. Cool and add 350 ml 10 N HCl slowly with rapid stirring. Cool and make upto 1 L and store in an amber coloured bottle. If hydrochloric acid is concentrated add calculated amount of hydrochloric acid equivalent to 350 ml of 10 N HCl.
- Stannous chloride stock solution 40 % : Dissolve 10 g of stannous chloride in 25 ml of concentrated hydrochloric acid. Add a piece of pure metallic tin and store in an amber coloured glass stopper bottle. Its working solution is prepared by diluting 0.5 ml stock solution to 66 ml distilled water just before use.
- Darco G 60 [P free activated charcoal powder]
Procedure:
Take 5 g and add 50 ml Bray’s extractant in a 250 mL conical flask. Mix and shake on end-to-end shaker for 30 minutes and filter. Prepare blank using water instead of sample and adding all other reagents in a similar fashion. Take 5 mL of the filtrate and add 5 mL ammonium molybdate solution in 25 mL volumetric or Nessler’s tube. Mix well until the evolution of CO2 ceases. If more aliquot has to be taken for analysis as in case of low P soils fluoride interference has to be eliminated by adding 75 mL of boric acid [5% solution] to 5 mL extract. Add about 10 mL of distilled water washing the neck of the flask to remove the adhering molybdate. Add about 1 mL of working stannous chloride solution and make up the volume to the mark with distilled water.
For analysis of various samples, first prepare standard solution of P by dissolving 0.02195 g of KH2PO4 in I L of water [5 ppm of P solution]. Pipette out 0.5, 1, 2, 3, 4 and 5 ml of this solution in different volumetric flasks and then proceed to develop colour as done for the test sample and record the absorbance values. From the absorbance values of standards and corresponding concentrations slope is obtained.
Sum of Concentrations of the standards prepared
Organic Carbon
Soil organic matter consists of a variety of components including varying proportions and many intermediate stages of raw plant residues and microorganisms (1 to 10 %), active organic traction (10 to 40%) and resistant or stable organic matter or humus (40 to 60 %). The raw plant residues, on surface, help reduce surface wind speed and water runoff. Removal, incorporation or burning of residues predisposes the soil to serious erosion. The active and some of the resistant soil organic component, together with microorganisms (especially fungi) are involved in binding small soil particles into larger aggregates. Aggregation is important for good soil structure, aeration, water, infiltration and resistant to erosion and crusting. The resistant or stable fraction of soil organic matter contributes mainly to nutrient holding capacity (cation exchange capacity) and soil colour. This fraction of organic matter decomposes very slowly and therefore has less influence on soil fertility than the active organic fraction. The amount of soil organic matter characteristic of virgin and cultivated soil in the various zone represent 30 to 50% loss of organic matter in cultivated soil than virgin soil.
The soil organic matter (SOM) includes only those organic materials that accompany soil particles through 2 mm sieve. Its content is an index of the soil productivity. SOM is the source and sink of nutrients (Nitrogen, Phosphorus and Sulphur), it has charge properties which make it a site of ion exchange (generally 1, and OM increase contribute 2 meq).
Method: The Wet Digestion Method
Principle: A known weight of soil or sediment is treated with an excess volume of standard potassium dichromate (K2Cr2O7) solution in the presence of concentrated H2SO4. The soil is digested by the heat of dilution of H2SO4 and organic carbon, which is oxidised to carbon dioxide (CO2). The excess of potassium dichromate unused in oxidation is titrated back against a standard solution of ferrous ammonium sulphate (FAS, FeSO42(NH4)2SO4) in the presence of sodium fluoride or phosphoric acid (NaF or H3PO4)and diphenylamine solution as indicator.
Reagents Used:
- 1N K2Cr2O7 solution: Dissolve 49.04 g of potassium dichromate in distilled water and make upto 1000 mL.
- 0.5N FAS (Mohr's Salt): Dissolve 196g of FAS in distilled water, add 50mL conc. H2SO4 and make the volume upto 1000 mL.
- Diphenylamine indicator: Dissolve 0.5g of diphenylamine in a mixture of 100mL conc. H2SO4 and 20 mL distilled water.
- Concentrated H2SO4.
- Sodium fluoride or Orthophosphoric acid (85%).
Apparatus required: 500 mL conical flask, pipettes, burettes and measuring cylinders 25mL.
Procedure:
- Weigh 5 g of 2 mm sieved soil or sediments into 500 mL conical flask.
- Add 10 mL 1N K2Cr2O7 solution and shake to mix.
- Add 20 mL conc. H2S04 from side of the flask.
- Keep the content for 30 minutes undisturbed.
- Now add 3 g NaF or 10mL H3PO4 and 100 mL distilled water and shake vigorously.
- Add 10 drops of diphenylamine indicator that gives violet colour.
- Titrate against 0.5N FAS solution till the colour changes from violet to bright green via blue. Note down the volume of the solution used.
- Carry out a blank titration in a similar manner without soil.
Calculation:
Weight of sample = S g
Vol. of FAS used in blank = X mL.
Vol. of FAS used to oxidize SOC = Y mL.
Normality of FAS = N.
Volume of 1N K2Cr2O7 used for the oxidation of carbon = (X-Y)/ 2
1 mL of 1N K2Cr2O7 = 0.003g of organic carbon.

Organic Matter (%) = soil carbon (%) x 1.724.
Interpretation:
| % Organic Carbon |
Rating |
| < 0.40 |
Low |
| 0.4o to 0.75 |
Medium |
| > 0.75 |
High |
Method Used: Modified Walkley-Black Method
Equipment required: Scoop, Calibrated glass tubes with 25mL mark, Tube rack.
Reagents:
- 1N Potassium dichromate ( K2Cr2O7, 49.0 g/L)
- Conc. H2SO4 (5mL delivery)
Procedure: Place 5 g soil or sediment sample in a tube. Add 2.5 mL of K2Cr2O7 and 5mL H2SO4. Mix well and allow for 15 minutes to react, now add distilled water to make volume 25 mL. Now compare the colours with the given colour chart.
Lime Requirement of Soils
Acidity in soil is associated with climate and vegetation. Acid soils are formed mainly because of leaching of bases due to high rainfall and quick weathering of acidic rocks. Soil acidity is mainly due to activity of aluminium and hydrogen ions. Aluminium ions on hydrolysis give rise to 3 hydrogen ions. Due to heterogeneous nature of soil, it acts as a buffer. There are two types of acidity in soil viz. Active acidity (pH of the soil solution) and potential acidity (exchangeable).
Liming neutralises the soil acidity and increases base saturation of soil, when a liming material is added to soil the H+ ion in solution is neutralised, but due to hydrolysis of Al, H+ will come from exchangeable complex. Hence, to know the lime requirement of soil, the potential acidity of soil should be taken into consideration. For effective liming programme, one should take into consideration (a) lime requirement of the crop to be grown (b) buffering capacity of soil, (c) time and frequency of lime application and (d) type of liming material.
Method: Buffer method
Reagents:
- Buffer solution: Dissolve 1 to 2g of paranitrophenol, 2.0mL Triethalomine, 3.0g of potassium chromate, 2.0g of calcium acetate and 40g of calcium chloride and approximately 800 mL distilled water. Adjust the pH to 7.5 using dilute HCl or NaOH solution and dilute to 1L.
- pH buffer solution ( pH 4.0 to 7.0 ).
Procedure:
- Weigh 10g of soil into 50mL beaker and add 20 mL buffer solution and shake for 10 minutes.
- Determine pH value, after adjusting the pH meter using appropriate buffer.
- The Lime requirement (LR) is proportional to the depression in pH of the buffer. From Table 13, the LR of soil can be determined.
Table 13. Lime requirement scale for buffer method
| Buffer pH |
Lime requirement
(Tonnes of CaCO3*/acre) |
| 6.7 |
1.6 |
| 6.6 |
2.2 |
| 6.5 |
2.8 |
| 6.4 |
3.4 |
| 6.3 |
4.0 |
| 6.2 |
4.5 |
| 6.1 |
5.2 |
| 6.0 |
5.8 |
| 5.9 |
6.4 |
| 5.8 |
7.0 |
| 5.7 |
7.6 |
| 5.6 |
8.2 |
| 5.5 |
8.6 |
| 5.4 |
9.5 |
| 5.3 |
10.1 |
(* Tonnes of pure CaCO
3 per 2 x 10
6 lbs. of soil)

