RESULTS AND DISCUSSION OF THE ANALYSIS OF SOIL
Soils representative of different habitats of entire catchment area like evergreen forests, disturbed evergreen forests, semi evergreen forests, swamps, Areca plantations, Acacia plantations, paddy fields, teak plantation, Pinus plantations, barren lands and riparian habitats were analysed for physical and chemical characteristics.
The results of the upstream (Batch I and II) and downstream (Batch III) soil samples are detailed in Tables 51, 52 and 53 respectively.
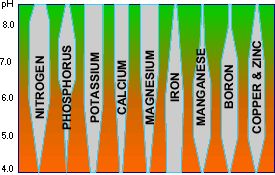
The soils of the upper catchment ranged from moderately acidic (pH 5.3 in sub-basin Linganamakki) in a semi-evergreen forest to neutral (7.8 in sub-basin Yenneholé) in the soils obtained from a degraded area (i.e., area with less vegetation cover). The slightly acidic soils found in moist deciduous, deciduous, semi-evergreen patches in sub-basins Nandiholé (US1), Haridravathi (US2), Mavinaholé (US3), Yenneholé (US5), Linganamakki (US9) would be due to the high organic content in the soils. The soils generally found in these areas are optimal for plant growth and microbial activity.
The bulk densities of Acacia plantations, barren lands, teak plantations, moist deciduous forests in all the sub-basins (0.69 – 1.175 g/cm3) were slightly higher than the evergreen and semi-evergreen patches (0.70 – 0.97 g/cm3) in the same basins. These results are supported by high moisture content (19.82 – 27.84 %) in the semi-evergreen patches found in sub-basins Yenneholé (US5) and Linganamakki (US9). The increased moisture content in sub-basin 9 would be due to the fact that this is the main reservoir bed. The deciduous, moist deciduous and Acacia plantations (6.96 – 22.55%) in sub-basins Nandiholé (US1), Haridravathi (US2), Sharavathi (US4), Linganamakki (US9), Mavinaholé (US3), Nagodiholé (US7) have high moisture content than the barren lands found in Haridravathi (US2), Sharavathi (US4), Yenneholé (US5) and Hurliholé (US6).
The soils in the upper-catchment are generally rich in organic carbon. The relative richness of organic carbon concentrations for various habitats (Tables 51 and 52) are semi-evergreen > deciduous, moist deciduous and Acacia plantations > teak plantations. The high organic carbon content in semi-evergreen, deciduous and Acacia habitats was due to heavy leaf litter. The organic carbon varied among the similar habitats in different sub-basins: semi evergreen forests [Linganamakki (US9) > Yenneholé (US5)], Moist deciduous forests [Nandiholé (US1) > Mavinaholé (US3) > Haridravathi (US2)], Pinus plantation [Linganamakki (US9) > Sharavathi (US4)], Deciduous forests [Mavinaholé (US3) > Haridravathi (US2)], Teak plantation [Nandiholé (US1) > Haridravathi (US2), Mavinaholé (US3), Linganamakki (US9)], Acacia plantation [Nandiholé (US1) > Sharavathi (US4) > Linganamakki (US9) > Haridravathi (US2)] and barren land [Hurliholé (US6) > Sharavathi (US4) > Haridravathi (US2)].
The relative concentrations of various elements are as follows Sulphates > Chlorides > Calcium > Magnesium and Nitrates > Phosphates (Table 51).
From the results it can be concluded that soils of the sub-basins Linganamakki (US9), Yenneholé (US5), Nagodiholé (US7), Nandiholé (US1), Haridravathi (US2), Mavinaholé (US3) of the upstream catchment (reflected by high organic content and low bulk density values) were fertile compared to the sub-basins Sharavathi (US4) and Hurliholé (US6).
Table 51. Soil analysis in the Sharavathi upstream (Batch I).
| Parameters |
Sampling sites |
| 1 |
2 |
3 |
4 |
5 |
6 |
7 |
8 |
9 |
10 |
11 |
12 |
| Physical |
| Moisture Content (%) |
7.62 |
5.12 |
4.1 |
6.7 |
11.4 |
1.2 |
5.9 |
5.3 |
7.64 |
6.27 |
7.2 |
6.16 |
| Bulk Density (g/cm3) |
0.87 |
1.005 |
0.944 |
0.991 |
1.267 |
0.876 |
1.045 |
0.975 |
1.09 |
1.027 |
1.359 |
1.037 |
| Colour # |
YB |
BR |
BR |
DB |
SBY |
YB |
B |
DB |
GB |
DB |
B |
RB |
| Chemical |
| pH |
7.8 |
7.65 |
7.34 |
7.2 |
7.1 |
7.01 |
7.3 |
7.45 |
7.1 |
7.2 |
7.28 |
6.8 |
| EC (mS/cm) |
0.026 |
0.018 |
0.02 |
0.042 |
0.035 |
0.026 |
0.022 |
0.049 |
0.12 |
0.06 |
0.020 |
0.029 |
| Acidity (mg/g) |
3 |
4 |
2 |
1 |
2 |
3 |
2 |
2 |
4 |
4 |
2 |
1 |
| Alkalinity (mg/g) |
3 |
3 |
2 |
4 |
3 |
4 |
3 |
5 |
5 |
2 |
2 |
3 |
| Chloride (mg/g) |
0.497 |
0.426 |
0.426 |
0.497 |
0.426 |
0.426 |
0.497 |
0.568 |
0.497 |
0.568 |
0.781 |
1.704 |
| Calcium (Meq/100 g) |
4 |
5.4 |
4 |
6 |
3.2 |
4.1 |
2.6 |
14 |
10.8 |
17.2 |
1.8 |
3.8 |
| Magnesium (Meq/100 g) |
2 |
3.6 |
2 |
2 |
7.8 |
3.1 |
0.8 |
0.8 |
1.6 |
1 |
0.4 |
1 |
| Sodium (mg/g) |
0.182 |
0.018 |
0.018 |
0.024 |
0.004 |
0.018 |
0.026 |
0.018 |
0.016 |
0.02 |
0.095 |
0.012 |
| Potassium (mg/g) |
0.013 |
0.027 |
0.021 |
0.045 |
0.066 |
0.022 |
0.022 |
0.082 |
0.071 |
0.057 |
0.017 |
0.027 |
| Sulphate (mg/g) |
0.01 |
0.073 |
0.206 |
0.266 |
0.222 |
0.198 |
0.213 |
0.259 |
0.246 |
0.317 |
0.246 |
0.164 |
| Phosphate (10-4mg/g) |
4.9 |
6.2 |
3.6 |
4.2 |
7.4 |
4.1 |
5.9 |
7.0 |
0.6 |
3.4 |
0.4 |
7.74 |
| Nitrate (mg/g) |
ND† |
ND |
ND |
ND |
ND |
ND |
0.0001 |
ND |
ND |
ND |
ND |
ND |
| Organic Matter (%) |
>4 |
>4 |
>4 |
>4 |
>4 |
3 |
3 |
>4 |
>4 |
>4 |
>4 |
<1 |
| Organic Carbon (%) |
2.32 |
2.32 |
2.32 |
2.32 |
2.32 |
1.74 |
1.74 |
2.32 |
2.32 |
2.32 |
2.32 |
ND |
| Lime Requirement * |
7 |
7 |
1.6 |
5.2 |
1.6 |
8.2 |
3.4 |
7 |
4 |
4.5 |
3.4 |
1.6 |
Table 51. Soil analysis in the Sharavathi upstream (Batch I) (cont…).
| Parameters |
Sampling sites |
| 13 |
14 |
15 |
16 |
17 |
18 |
19 |
20 |
21 |
22 |
23 |
24 |
| Physical |
| Moisture Content (%) |
3.214 |
5.8 |
5.2 |
10.4 |
4.3 |
5.5 |
5.6 |
1.8 |
9.61 |
3.85 |
1.56 |
1.2 |
| Bulk Density (g/cm3) |
0.971 |
1.207 |
1.111 |
1.209 |
1.144 |
1.024 |
1.174 |
1.175 |
0.786 |
1.125 |
1.725 |
0.701 |
| Colour # |
YB |
GB |
GB |
DEB |
DEB |
RB |
YB |
BY |
RB |
B |
BYE |
BYE |
| Chemical |
| pH |
7.24 |
6.62 |
7.05 |
6.1 |
6.68 |
6.9 |
6.7 |
6.45 |
6.57 |
6.59 |
6.82 |
6.74 |
| EC (mS/cm) |
0.027 |
0.141 |
0.032 |
0.026 |
0.045 |
0.044 |
0.020 |
0.024 |
0.051 |
0.05 |
0.05 |
0.05 |
| Acidity (mg/g) |
1 |
3 |
3 |
5 |
3 |
4 |
2 |
3 |
3 |
3 |
2 |
4 |
| Alkalinity (mg/g) |
3 |
2 |
2 |
1 |
2 |
3 |
3 |
2 |
2 |
3 |
2 |
3 |
| Chloride (mg/g) |
0.994 |
0.914 |
1.491 |
2.05 |
1.42 |
1.49 |
0.71 |
2.62 |
3.62 |
1.29 |
2.01 |
0.72 |
| Calcium (Meq/100 g) |
2 |
1.2 |
3.2 |
4.6 |
3.4 |
2.6 |
1 |
5.4 |
7.8 |
5.4 |
6.1 |
1.25 |
| Magnesium (Meq/100 g) |
0.8 |
0.8 |
1 |
1.2 |
0.6 |
1.6 |
1 |
2 |
2.4 |
2.2 |
2.8 |
0.9 |
| Sodium (mg/g) |
0.03 |
0.012 |
0.022 |
0.009 |
0.014 |
0.009 |
0.013 |
0.014 |
0.018 |
0.018 |
0.016 |
0.006 |
| Potassium (mg/g) |
0.085 |
0.28 |
0.005 |
0.039 |
0.046 |
0.015 |
0.09 |
0.029 |
0.035 |
0.029 |
0.3 |
0.012 |
| Sulphate (mg/g) |
0.16 |
0.201 |
0.17 |
0.218 |
0.157 |
0.232 |
0.311 |
0.495 |
0.847 |
0.752 |
0.812 |
0.355 |
| Phosphate (10-4mg/g) |
5.0 |
1.2 |
1.5 |
1.2 |
7.8 |
8.0 |
8.5 |
4.3 |
4.4 |
7.1 |
4.8 |
2.2 |
| Nitrate (mg/g) |
ND† |
ND |
ND |
ND |
ND |
ND |
ND |
ND |
ND |
ND |
ND |
ND |
| Organic Matter (%) |
2 |
>4 |
>4 |
>4 |
>4 |
>4 |
>4 |
3 |
<1 |
3 |
3 |
<1 |
| Organic Carbon (%) |
1.16 |
2.32 |
2.32 |
2.32 |
2.32 |
2.32 |
2.32 |
1.74 |
Nil |
1.74 |
1.74 |
Nil |
| Lime Requirement * |
7.6 |
4.5 |
2.2 |
3.4 |
4 |
6.4 |
4.5 |
2.8 |
2.2 |
8.2 |
4 |
8.2 |
Note: # Colour abbreviation used YB: Yellowish brown, BR: Brownish red, DB: Dark brown, SBY: Slightly brownish yellow, RB: Reddish brown, B: Brown, GB: Grayish brown, DEB: Dark earthy brown, BY: Bright yellow, BYE: Brownish yellow.
* in Tonnes of CaCO3/acre; † Not detectable
Table 52. Soil analysis in the Sharavathi upstream (Batch II).
Parameters |
Sampling sites |
| 1 |
2 |
3 |
4 |
5 |
6 |
7 |
8 |
9 |
10 |
| Physical |
| Moisture Content (%) |
12.8 |
15.4 |
8.8 |
6.96 |
8.15 |
10.64 |
14.08 |
16.98 |
6.41 |
14.59 |
| Bulk Density (g/cm3) |
1.01 |
1.02 |
0.99 |
1.07 |
1.13 |
1.11 |
0.98 |
1.03 |
1.11 |
0.98 |
| Chemical |
| pH |
6.58 |
6.28 |
6.1 |
6.63 |
6.07 |
6.44 |
6.43 |
6.18 |
5.97 |
6.12 |
| Conductivity (mS/cm) |
0.048 |
0.045 |
0.055 |
0.03 |
0.046 |
0.055 |
0.033 |
0.114 |
0.038 |
0.032 |
| Acidity (mg/g) |
0.022 |
0.02 |
0.044 |
0.005 |
0.006 |
0.014 |
0.014 |
0.013 |
0.006 |
0.007 |
| Alkalinity (mg/g) |
0.014 |
0.029 |
0.013 |
0.01 |
0.008 |
0.018 |
0.01 |
0.009 |
0.006 |
0.01 |
| Chloride (mg/g) |
0.021 |
0.059 |
0.077 |
0.017 |
- |
0.049 |
0.079 |
0.08 |
0.016 |
0.046 |
| Calcium (M.eq/100g) |
0.002 |
0.002 |
0.0022 |
0.0002 |
- |
0.0007 |
0.0015 |
0.0013 |
- |
0.0032 |
| Magnesium (M.eq/100g) |
0.0002 |
0.0002 |
0.0044 |
0.0001 |
- |
0.0001 |
0.0002 |
0.0005 |
- |
0.001 |
| Nitrates (10-4mg/g) |
8.2 |
9.2 |
12.2 |
8.2 |
7.1 |
1.3 |
- |
20.3 |
7.6 |
10.8 |
| Sulphates (mg/g) |
0.24 |
0.12 |
0.11 |
0.22 |
0.21 |
0.13 |
0.24 |
0.27 |
0.001 |
0.24 |
| Phosphate (10-4mg/g) |
2.5 |
0.1 |
0.4 |
1.1 |
0.5 |
0.8 |
1.2 |
1.5 |
1.1 |
0.8 |
| Organic matter (%) |
5.16 |
5.59 |
6.44 |
2.44 |
1.21 |
3.53 |
3.22 |
3.83 |
3.16 |
4.89 |
| Organic carbon (%) |
2.99 |
3.24 |
3.73 |
1.42 |
0.7 |
2.05 |
1.87 |
2.22 |
1.83 |
2.83 |
Table 52. Soil analysis in the Sharavathi upstream (Batch II) (cont…).
Parameters |
Sampling sites |
| 11 |
12 |
13 |
14 |
15 |
16 |
17 |
18 |
19 |
20 |
| Physical |
| Moisture Content (%) |
14.75 |
9.16 |
13.31 |
11.66 |
10.53 |
19.82 |
13.18 |
16.67 |
20.42 |
27.84 |
| Bulk Density (g/cm3) |
0.98 |
1.11 |
1.08 |
1.03 |
1.04 |
0.97 |
0.99 |
0.93 |
0.87 |
0.73 |
| Chemical |
| pH |
6.16 |
5.69 |
6.42 |
5.69 |
5.68 |
6.36 |
6.36 |
6.01 |
5.87 |
6.88 |
| Conductivity (mS/cm) |
0.044 |
0.04 |
0.051 |
0.045 |
0.032 |
0.066 |
0.056 |
0.047 |
0.056 |
0.049 |
| Acidity (mg/g) |
0.01 |
0.01 |
0.011 |
0.02 |
0.007 |
0.027 |
0.017 |
0.016 |
- |
0.05 |
| Alkalinity (mg/g) |
0.014 |
0.007 |
0.014 |
0.009 |
0.007 |
0.032 |
0.014 |
0.024 |
- |
0.03 |
| Chloride (mg/g) |
0.03 |
0.038 |
0.019 |
0.068 |
0.011 |
0.053 |
0.031 |
0.046 |
0.032 |
0.053 |
| Calcium (M.eq/100g) |
0.0007 |
0.0003 |
0.0024 |
0.0003 |
- |
0.0014 |
- |
0.0011 |
0.001 |
0.1027 |
| Magnesium (M.eq/100g) |
0.0006 |
0.0002 |
0.0002 |
0.0001 |
- |
0.0002 |
- |
0.0011 |
0.0001 |
- |
| Nitrates (10-4mg/g) |
12.7 |
44.8 |
15.4 |
14.3 |
7.4 |
8.9 |
16.5 |
12 |
7.5 |
32.1 |
| Sulphates (mg/g) |
0.163 |
0.045 |
0.129 |
0.159 |
0.026 |
0.199 |
0.051 |
0.153 |
0.095 |
1.319 |
| Phosphate (10-4mg/g) |
0.4 |
0.4 |
0.5 |
0.8 |
2.2 |
0.4 |
1.6 |
1.7 |
1.2 |
4.7 |
| Organic matter (%) |
6.38 |
0.86 |
4.58 |
3.84 |
3.28 |
5.02 |
3.6 |
3.98 |
6.99 |
7.89 |
| Organic carbon (%) |
3.7 |
0.5 |
2.66 |
2.23 |
1.9 |
2.91 |
2.09 |
2.31 |
4.06 |
4.58 |
Table 52. Soil analysis in the Sharavathi upstream (Batch II) (cont…).
Parameters |
Sampling sites |
| 21 |
23 |
24 |
25 |
26 |
27 |
28 |
29 |
30 |
35 |
| Physical |
| Moisture Content (%) |
14.97 |
27.96 |
18.46 |
18.01 |
25.56 |
22.31 |
27.42 |
25.62 |
27.93 |
22.55 |
| Bulk Density (g/cm3) |
0.97 |
0.7 |
- |
0.88 |
0.77 |
0.76 |
0.71 |
0.69 |
0.7 |
0.75 |
| Chemical |
| pH |
6.01 |
6.38 |
5.94 |
5.94 |
6.09 |
5.81 |
6.25 |
5.66 |
6.25 |
5.92 |
| Conductivity (mS/cm) |
0.024 |
0.012 |
0.01 |
0.011 |
0.017 |
0.01 |
0.023 |
0.013 |
0.03 |
0.014 |
| Acidity (mg/g) |
0.011 |
0.025 |
0.022 |
0.015 |
0.016 |
0.036 |
0.03 |
0.024 |
0.026 |
0.093 |
| Alkalinity (mg/g) |
0.026 |
0.013 |
0.027 |
0.036 |
0.039 |
0.028 |
0.039 |
0.025 |
0.028 |
0.022 |
| Chloride (mg/g) |
0.032 |
0.026 |
0.038 |
0.017 |
0.036 |
0.027 |
0.041 |
0.019 |
0.007 |
0.047 |
| Calcium (M.eq/100g) |
- |
0.0324 |
- |
0.0091 |
0.0023 |
- |
0.0321 |
- |
- |
0.0148 |
| Magnesium (M.eq/100g) |
- |
- |
- |
- |
- |
- |
- |
- |
- |
- |
| Nitrates (10-4mg/g) |
47.2 |
48.5 |
104.5 |
16.9 |
40 |
28.1 |
110.4 |
16.4 |
20.4 |
29.6 |
| Sulphates (mg/g) |
- |
0.62557 |
0.59652 |
0.70255 |
0.87482 |
0.94383 |
1.11732 |
0.71729 |
0.9555 |
0.70155 |
| Phosphate (10-4mg/g) |
3.6 |
2.1 |
4.8 |
4.7 |
4.6 |
2.5 |
4.7 |
- |
- |
2.2 |
| Organic matter (%) |
5.27 |
3.4 |
1.46 |
3.04 |
2.64 |
4.11 |
3.88 |
5.3 |
8.28 |
3.95 |
| Organic carbon (%) |
3.05 |
1.97 |
0.85 |
1.77 |
1.53 |
2.38 |
2.25 |
3.08 |
4.8 |
2.29 |
Table 52. Soil analysis in the Sharavathi upstream (Batch II) (cont…).
Parameters |
Sampling sites |
| 36 |
37 |
39 |
40 |
41 |
42 |
43 |
44 |
| Physical |
| Moisture Content (%) |
26.81 |
24.7 |
13.18 |
12.19 |
18.88 |
19 |
13.82 |
17.26 |
| Bulk Density (g/cm3) |
- |
0.73 |
0.88 |
0.77 |
0.81 |
0.76 |
0.78 |
0.74 |
| Chemical |
| pH |
6.13 |
5.43 |
5.52 |
5.88 |
6.02 |
5.93 |
5.99 |
5.8 |
| Conductivity (mS/cm) |
0.02 |
0.022 |
0.017 |
0.016 |
0.032 |
0.029 |
0.014 |
0.009 |
| Acidity (mg/g) |
0.024 |
0.012 |
0.021 |
0.04 |
0.033 |
0.022 |
0.039 |
0.015 |
| Alkalinity (mg/g) |
0.02 |
0.007 |
0.017 |
0.025 |
0.014 |
- |
0.021 |
0.017 |
| Chloride (mg/g) |
0.027 |
0.021 |
0.02 |
0.018 |
0.022 |
0.028 |
0.027 |
0.006 |
| Calcium (M.eq/100g) |
0.0451 |
- |
- |
- |
0.0175 |
0.0343 |
0.0201 |
0.0168 |
| Magnesium (M.eq/100g) |
- |
- |
- |
- |
- |
- |
- |
- |
| Nitrates (10-4mg/g) |
44.4 |
48.1 |
60.1 |
21.4 |
88.6 |
195.6 |
22.7 |
10.5 |
| Sulphates (mg/g) |
0.572 |
0.172 |
0.589 |
0.798 |
0.234 |
0.877 |
0.692 |
1.335 |
| Phosphate (10-4mg/g) |
1.7 |
2.9 |
2.3 |
3.2 |
4.5 |
3.3 |
4.8 |
1.7 |
| Organic matter (%) |
8.68 |
4.52 |
2.41 |
2.18 |
9.2 |
3.88 |
2.28 |
4.48 |
| Organic carbon (%) |
5.04 |
2.62 |
1.4 |
1.27 |
5.34 |
2.25 |
1.32 |
2.6 |
The soil analysis for the Sharavathi downstream catchment reveals that the soils from all the habitats analysed are moderate to slightly acidic in nature (4.9 to 6.07), which is shown in the Table 53. Most of the plants grow optimally in this pH range, as the nutrients are available for their growth (as shown below) and the microbial activity is also optimum at this range.
(http://www.pda.org.uk/leaflets/24/leaflet24-6.html)
Conductivity values for all habitats were within permissible limits for good quality soil. Bulk density (2.02 – 2.25 g/cm3) was high in the areca plantations in the sub-basins Dabbe falls (DS4), Magod (DS3) and Haddinabal (DS2), which could be attributed to the compactness and nonporous nature of the soil. The mulching of soil would be the reason for higher moisture content in these plantations (20.44 –23.68%). Riparian habitat at Dabbe showed a high value of bulk density 2.05 g/cm3, due to clayey skeletal nature of the soil, which is generally compact. These results are supported by low water holding capacity (9.76 – 39.24%) and moderate concentrations of organic carbon (0.44 to 0.84%).
The evergreen patches in Dabbe falls (DS4), Haddinabal (DS2) and Kathalekan (DS6) have lower bulk densities (1.29 – 1.94 g/cm3, Table 53) than Areca and other plantations. Consequently, these patches have high water holding capacity (13.48 -55.31%) and organic carbon (0.66 – 2.59%).
At Idagunji (Magod DS3), Acacia plantations showed organic carbon concentrations of 1.55 % and at Mahasati (Haddinabal DS2) it was 0.20 %. Due to older plantations, in Idagunji leaf litter was high.
Areca plantations near Hossagadde and Mavinaholé in Magod (DS3) and Haddinabal (DS2) respectively are deficient in phosphorous levels with 7.88 and 9.46 kg/ha whereas Chandubanu (Haddinabal DS2) is rich in available phosphorous [165.55 kg/ha], which is due to fertiliser applications. Ploughed paddy field at Hebbenkere (Dabbe fall DS4) is deficient in phosphorous with 7.88 kg/ha compared to moderate concentrations of 25.23 kg/ha in unploughed paddy field (DS4) This is probably due to the disturbances to the topsoil (which is rich in phosphorous) while ploughing.
Compared to paddy fields, the riparian vegetation soils in sub-basin 4 have moderate phosphorous levels (28.38 kg/ha). The teak plantations (Haddinabal DS2) grown on slopes is deficient in phosphorous (12.61 kg/ha) when compared to plantations (34.69 kg/ha) in flat terrain. The low phosphorous levels would be due to soil erosion on the slopes. The evergreen patches in certain areas like Kathalekan (sub-basin 6), Chikoli (sub-basin 2), and Chandubanu (sub-basin 2) are deficient in phosphorous levels - 14.19, 1.58 and 15.77 kg/ha respectively. This can be attributed to the disturbance of the soil surface.
The Areca plantations in Dabbe falls (DS4), Magod (DS3) and Haddinabal (DS2) have low available potassium (69.5 – 142.9 kg/ha) whereas in other habitats like evergreen and semi-evergreen patches in the same sub-basins, it was higher.
Thus, from the results, it can be concluded that the soils in the Areca, Acacia and teak plantations in Dabbe falls (DS4), Magod (DS3) and Haddinabal (DS2) have a low nutrient status (as shown by low water holding capacity, low organic content and high bulk density values) than the soils in the evergreen and semi-evergreen patches in the same sub-basins.
The evergreen patches of sub-basin Haddinabal (DS2) and Kathalekan (DS6) have high available potassium and phosphorous values compared to other habitats and sub-basins.
The soils of Haddinabal (DS2) and Kathalekan (DS6) of the downstream catchment of the Sharavathi river basin are relatively fertile compared to Dabbe falls (DS4) and Magod (DS3). Most of the areas in the DS4 and DS3 come under different plantations and have the maximum anthropogenic activity compared to the other two sub-basins.
Table 53. Soil analysis in the Sharavathi downstream (Batch III).
| Parameters |
Sampling Sites |
| 1 |
2 |
3 |
4 |
5 |
6 |
7 |
8 |
9 |
10 |
| Moisture content (%) |
18.5 |
20.54 |
14.69 |
20.84 |
23.68 |
20.72 |
21.06 |
13 |
21.67 |
12.7 |
| Bulk density (g/cm3 ) |
1.69 |
2.25 |
1.65 |
1.62 |
2.12 |
1.29 |
2.02 |
1.65 |
2.09 |
1.53 |
| Water holding capacity (%) |
13.48 |
9.76 |
20.73 |
46.23 |
13.8 |
25.9 |
26.68 |
47.21 |
31.29 |
37.62 |
| PH |
5.49 |
5.8 |
5.6 |
5.4 |
5.8 |
4.9 |
5.55 |
5.2 |
5.8 |
5.6 |
| Conductivity (mS/cm) |
0.031 |
0.016 |
0.013 |
0.017 |
0.022 |
0.02 |
0.025 |
0.023 |
0.014 |
0.023 |
| Available Phosphorus (kg/ha) |
- |
7.88 |
23.65 |
25.23 |
- |
93.03 |
29.96 |
7.88 |
28.38 |
14.19 |
| Organic carbon (%) |
1.68 |
0.44 |
0.2 |
1.13 |
0.84 |
1.76 |
0.57 |
0.91 |
0.66 |
1.24 |
| Available Potassium (kg/ha) |
230.5 |
113.3 |
252.4 |
76 |
101.7 |
140.3 |
69.5 |
106.9 |
91.4 |
188 |
| Lime requirement * |
7.6 |
3.4 |
2.2 |
7.6 |
5.2 |
10.1 |
4.5 |
6.4 |
4 |
6.4 |
Table 53. Soil analysis in the Sharavathi downstream (Batch III) (cont…).
| Parameters |
Sampling Sites |
| 11 |
12 |
13 |
14 |
15 |
16 |
17 |
18 |
19 |
20 |
| Moisture content (%) |
20.66 |
20.44 |
20.88 |
22.78 |
7.19 |
12.9 |
5.79 |
15.56 |
17.89 |
18.69 |
| Bulk density (g/cm3 ) |
2.19 |
2.05 |
1.33 |
2.35 |
1.65 |
1.49 |
1.56 |
1.48 |
1.52 |
1.72 |
| Water holding capacity (%) |
34.94 |
39.24 |
45.03 |
29.82 |
24.01 |
34.91 |
24.15 |
44.75 |
54.71 |
44.98 |
| PH |
6 |
5.8 |
6.07 |
5.4 |
5.4 |
5.1 |
5.7 |
5.2 |
5.8 |
5.2 |
| Conductivity (mS/cm) |
0.018 |
0.031 |
0.101 |
0.015 |
0.039 |
0.016 |
0.062 |
0.02 |
0.035 |
0.031 |
| Available Phosphorus (kg/ha) |
165.55 |
9.46 |
1.58 |
- |
12.61 |
4.73 |
34.69 |
47.3 |
15.77 |
50.45 |
| Organic carbon (%) |
0.6 |
0.6 |
2.59 |
0.7 |
1.01 |
0.78 |
0.82 |
1.18 |
2.2 |
0.78 |
| Available Potassium (kg/ha) |
123.6 |
142.9 |
419.7 |
91.4 |
164.8 |
114.6 |
177.7 |
292.3 |
243.3 |
128.8 |
| Lime requirement * |
5.2 |
4 |
5.8 |
4.5 |
4 |
6.4 |
5.8 |
7.6 |
6.4 |
5.2 |
Table 53. Soil analysis in the Sharavathi downstream (Batch III) (cont…).
| Parameters |
Sampling Sites |
| 21 |
22 |
23 |
24 |
25 |
26 |
27 |
28 |
29 |
30 |
| Moisture content (%) |
19.02 |
11.46 |
29.84 |
10.83 |
17.38 |
16.33 |
8.88 |
10.74 |
28.09 |
20.79 |
| Bulk density (g/cm3 ) |
1.69 |
1.37 |
1.74 |
1.49 |
1.53 |
1.52 |
1.94 |
1.84 |
1.58 |
1.43 |
| Water holding capacity (%) |
37.92 |
42.45 |
53.17 |
36.94 |
55.31 |
41.67 |
36.85 |
52.09 |
46.11 |
43.41 |
| PH |
5.2 |
5.8 |
4.9 |
5.6 |
5.9 |
5.8 |
5.4 |
5.3 |
5.1 |
5.3 |
| Conductivity (mS/cm) |
0.026 |
0.027 |
0.079 |
0.026 |
0.033 |
0.028 |
0.024 |
0.011 |
0.019 |
0.105 |
| Available Phosphorus (kg/ha) |
47.3 |
93.03 |
52.03 |
126.14 |
77.26 |
63.07 |
69.38 |
3.15 |
14.19 |
- |
| Organic carbon (%) |
0.54 |
0.89 |
1.14 |
0.66 |
2.23 |
1.8 |
0.77 |
1.55 |
0.77 |
- |
| Available Potassium (kg/ha) |
108.2 |
136.5 |
164.8 |
181.5 |
372.1 |
244.6 |
236.9 |
70.8 |
145.5 |
- |
| Lime requirement * |
4.5 |
4 |
- |
4.5 |
- |
6.4 |
5.2 |
10.1 |
- |
- |
Table 53. Soil analysis in the Sharavathi downstream (Batch III) (cont…).
| Parameters |
Sampling Sites |
| 31 |
32 |
33 |
34 |
35 |
| Moisture content (%) |
26.79 |
20.31 |
20.72 |
16.14 |
20.04 |
| Bulk density (g/cm3 ) |
1.63 |
1.63 |
1.29 |
1.76 |
1.56 |
| Water holding capacity (%) |
33.13 |
42.38 |
44.05 |
40.11 |
52.4 |
| PH |
5.6 |
5.5 |
5.5 |
5.8 |
5.5 |
| Conductivity (mS/cm) |
0.1049 |
0.0794 |
0.099 |
0.041 |
0.17 |
| Available Phosphorus (kg/ha) |
- |
- |
- |
- |
- |
| Organic carbon (%) |
- |
- |
- |
- |
- |
| Available Potassium (kg/ha) |
- |
- |
- |
- |
- |
| Lime requirement * |
- |
- |
- |
- |
- |
* in Tonnes of CaCO3/acr

