|
RESULTS
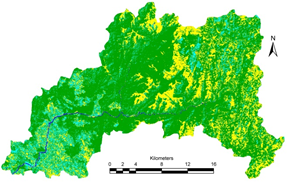
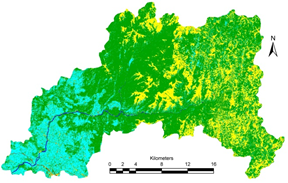
3.1 Land use analysis: Land use analysis was carried out using remote sensing data of 2014, for Yettinaholé catchment (a tributary of Gundia river) and results are given in Figure 13 and Table 11. Major portion of the catchment is covered with evergreen forest (45.08%) followed by agriculture plantations (29.05%) and grass lands (24.06%). The valleys along the stream are dominated by agriculture lands and horticulture plantations, the hill tops dominated by grass lands, slopes covered with forest cover. The accuracy of the land use classification is 87% with kappa of 0.82. Temporal land use in the Gundia river catchment during 2000, 2006, 2010 and 2014 are depicted in Figure 14 and details are provided in Table 12. Results reveal that area under forests has reduced from 70.74% (in 2000) to 61.15% (in 2014).
Table 11: Land use in Yettinaholé catchment
Land use |
Area (%) |
Built up |
0.07 |
Agriculture Plantation |
29.25 |
Evergreen |
45.08 |
Forest Plantation |
0.001 |
Water |
0.002 |
Open land |
0.91 |
Agriculture |
0.62 |
Grassland |
24.06 |
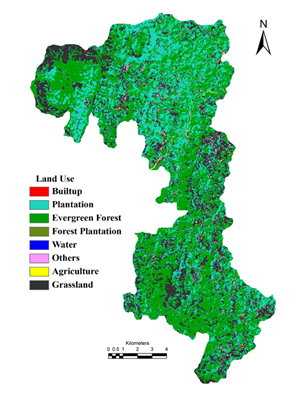
Figure 13: Land use in Yettinaholé catchment (eastern part of Gundya river basin)
|
|
December 2000 |
January 2006 |

|
|
December 2010 |
December 2014 |

|
Figure 14: Land use dynamics – Gundia river basin
Table 12: Land use dynamics. – Gundia river basin
Land use
|
2000 December |
2006 January |
2010 December |
2014 December |
Area (sq.km) |
% Area |
Area (sq.km) |
% Area |
Area (sq.km) |
% Area |
Area (sq.km) |
% Area |
Water |
4.05 |
0.63 |
3.61 |
0.56 |
2.96 |
0.46 |
3.11 |
0.49 |
Built up |
0.44 |
0.07 |
0.17 |
0.03 |
2.41 |
0.38 |
2.72 |
0.43 |
Plantation |
74.61 |
11.66 |
77.55 |
12.11 |
79.29 |
12.39 |
121.29 |
18.95 |
Forest |
452.80 |
70.74 |
443.36 |
69.26 |
443.27 |
69.25 |
391.43 |
61.15 |
Others |
108.22 |
16.91 |
115.44 |
18.03 |
112.18 |
17.53 |
121.56 |
18.99 |
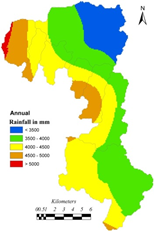
The region receives annual rainfall ranging from 3000 mm to 4500 mm. Variability of rainfall was assessed based on 11 rain gauge stations in the catchment and is given in Figure 15.
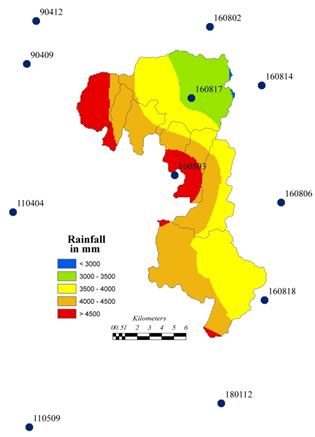
Figure 15: Spatial patterns of rainfall and rain gauge stations
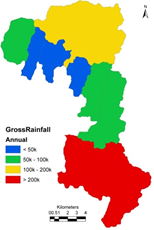
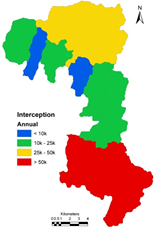
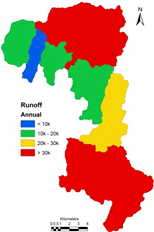
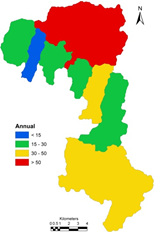
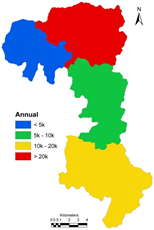
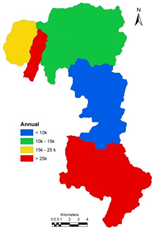
Figure 16 provides the annual variability of hydrological parameters for understanding the hydrological regime. Gross rainfall, estimated as product of catchment area and rainfall. The gross rainfall varies from 33232 kilo.cum (in Kadumane holé 2 and Yettinaholé 2) and over 2000000 kilo.cum (in Yettinaholé and Hongada halla catchments). Portion of the water doesn’t reach the earth surface, but is intercepted by the earth features namely the tree canopy, building tops, pavements etc., which gets evaporated. Runoff in the basin is estimated as a function of catchment characteristics along with rainfall. Yettinholé, catchment is covered predominantly by evergreen forests, has aided in recharging groundwater zone and sub surfaces. Infiltration of significant amount of precipitation to underlying layers, has reduced the overland flow and thus retarded the flash floods. The infiltration of water to sub-surface takes place during monsoon, and overland flow (surface runoff) happens during the monsoon (rainfall > 50 mm per month) and quantity depends on the catchment characteristics namely land use / land cover in the catchment, soil porosity, texture, presence of organic matter (leave debris, decayed matter etc.). The portion of water percolates through the sub surfaces and thus recharges ground water resources. Water stored in vadoze zone (sub-surface) and groundwater zone moves laterally to streams with cessation of rain. Forests in the catchment have played a prominent role in maintaining stream flow, water holding capacity of soil, ground water, which also plays a pivotal role in catering the ecological and environmental demand of water. Sub basin wise yields are listed in Table 13; the surface runoff during the monsoon is estimated to be 9.55 TMC.
Table 13: Catchment yield
Sub basin |
Average Annual Rainfall mm |
Gross Rainfall TMC |
Runoff yield as TMC |
Yettina hole |
3539.73 |
5.98 |
2.62 |
Yettina holé T2 |
4311.44 |
1.23 |
0.58 |
Yettina holé T1 |
4109.99 |
1.33 |
0.57 |
Kadumane holé 2 |
4364.85 |
1.20 |
0.53 |
Kadumane holé 1 |
4725.54 |
1.79 |
0.70 |
Hongadahalla |
4000.77 |
6.70 |
2.68 |
Keri holé |
4013.09 |
2.69 |
1.17 |
Yettina holé lower reach |
4385.25 |
1.81 |
0.69 |
GROSS Yield (TMC) |
|
9.55 |
Evapotranspiration in the catchment depends on the land use, solar radiation, variations in temperature, precipitation, etc. Potential evapotranspiration was estimated using Hargreaves method. PET indicates the maximum possible water that can evaporate, PET varies between 160 mm/month (March) to 85 mm/month (monsoon season). Considering the various land use characteristics in the catchments, actual evapotranspiration was estimated in the catchments show variation of 40 mm/month (monsoon) to 120 mm/month (March).
Crop water demand was calculated in each catchment based on cropping pattern, area under each crop, and water required across the growth phases of the crops, which were compiled from various literatures (local, national and international) and discussion with the public regarding cropping practices and experiences. Table 9 and Figure12, details season-wise crop water requirements and growth phases. The agricultural water demand of 2.6 TMC in the catchments is for horticultural and paddy cultivation. Livestock water demand given in Table 10 was estimated based on the livestock population (compiled from District at a glance of Hassan 2012-13).
Census data for the year 2001 and 2011 with the decadal rate of change in population was used compute the population for 2014 and water demand. Population for the year 2014 was estimated as 16156 persons. Catchment had a population of 17005 (in 2001), which decreased to 16345 (in 2011) at a decadal decline of 3.88%. The population density in the catchments varies from 33 persons per sq.km (in Keriholé) to about 150 persons per sq.km (Yettinaholé lower reach).
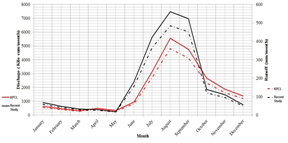
Ecological Flow Assessment: Flow measurements during the study period at two basins namely Hongadahalla and Kadumaneholé of Yettinaholé namely and based on the long term monitoring data [45] is given in Figure 16 and Figure 17 respectively. This illustrates that flow during the lean season is about 10% of the annual flow, which is lower than the minimum flow requirement to sustain the ecosystem services in the water body.

|
|
Figure 16: Hongadahalla |
Figure 17: Kadumaneholé |
Monthly monitoring of select streams in Sharavathi River basin over 24 months (covering all seasons) revealed the linkages of fish diversity with the duration of water flow in the respective stream. Table 14 lists the fish diversity across monitored streams. The current assessment confirm the requirement of 24 to 30% of annual flow during lean seasons to sustain the native fish diversity of endemic species [46, 47, 62]. Based on this, the ecological flow in Yettinaholé catchment (during the lean seasons) is 2.8 TMC.
Table 14: Fish diversity in select streams of Sharavathi River basin
Fishes (Scientific Name) |
Hill streams |
Huruli River |
Nagodi River |
Birer River |
Yenne River |
Kouthi Stream |
Sharavathi |
Hilkunji |
Sharmanavathi |
Haridravathi |
Nandihole |
Amblyphyrngodon mola |
|
|
|
|
|
|
|
|
|
|
Aplocheilus lineatus |
* |
* |
* |
* |
* |
* |
* |
* |
|
|
Barilius canarensis |
|
|
* |
|
* |
|
|
|
|
|
Catla catla |
|
|
|
|
|
|
|
|
|
|
Chanda nama |
* |
|
|
|
|
|
* |
|
|
|
Channa marulius |
|
|
|
|
|
* |
|
|
|
|
Cirhina fulungee |
|
|
|
|
|
* |
|
* |
|
|
Cirhina mrigala |
|
|
|
|
|
|
|
|
|
|
Cirrhinus reba |
|
|
|
|
|
|
|
* |
|
|
Clarius byatracus |
|
|
|
|
|
|
|
|
|
|
Cyprinus carpio |
|
|
|
|
|
* |
|
|
|
|
Danio aequipinnatus |
* |
* |
* |
* |
* |
* |
* |
* |
* |
* |
Garra gotyla stenorynchus |
* |
|
|
|
|
* |
|
* |
|
* |
Glossogobius giurus |
|
|
|
|
|
|
|
|
|
|
Heteropneustis fossilis |
|
|
|
|
|
|
|
|
|
|
Labeo fimbriatus |
|
|
|
|
|
|
|
|
|
|
Labeo rohita |
|
|
|
|
|
* |
|
|
|
|
Lepidocephalichthys thermalis |
|
|
* |
|
* |
|
|
|
|
|
Mastacembalus arnatus |
|
|
|
|
|
* |
|
|
|
|
Mystus cavesius |
* |
|
|
|
|
|
|
|
|
|
Mystus keletius |
* |
|
|
|
|
|
|
|
|
|
Mystus malabaricus |
* |
|
|
|
|
|
|
|
|
|
Namacheilus rueppelli |
|
* |
* |
|
|
|
|
|
|
|
Ompok bimaculatus |
|
|
|
|
|
* |
|
|
|
|
Ompok sp. |
|
|
|
|
|
|
|
|
|
|
Oreochromis mossambica |
|
|
|
|
|
|
|
|
|
|
Pseudambasis ranga |
* |
|
|
|
|
|
|
|
|
|
Pseudeutropius atherenoides |
* |
|
|
|
|
|
|
|
|
|
Puntius arulius |
|
|
|
|
* |
|
|
|
|
|
Puntius dorsalis |
|
|
|
|
|
|
|
|
|
|
Puntius fasciatus |
* |
* |
* |
* |
* |
|
|
|
|
|
Puntius filamentosis |
|
|
|
* |
* |
|
|
|
|
|
Puntius kolus |
|
|
|
|
|
|
|
|
|
|
Puntius narayani |
|
|
|
|
|
|
|
|
|
|
Puntius parrah |
|
|
|
|
|
|
|
|
|
|
Puntius ticto |
|
|
|
|
|
|
|
|
|
|
Rasbora daniconius |
* |
* |
* |
* |
* |
* |
* |
|
* |
* |
Salmostoma boopis |
|
|
|
|
|
* |
* |
|
* |
|
The water demand and availability are listed in table 15 and Figure 18 depicts the spatial variability of resources. Total water demand (5.84 TMC of water) across the catchments (accounting anthropogenic and evapo-transpiration of terrestrial ecosystems) was obtained as a function of evaporation, livestock, and domestic and agriculture demands. Availability of water in the catchment was assessed as a function of runoff during all seasons. The assessment showed that most streams in the forested catchment are perennial compared to steams in the catchment predominantly covered with monoculture plantations (6-9 months) or the streams in catchment dominated by open area or barren area (4 months). The available water in Yettinaholé catchment is sufficient to cater the existing water demand (social, ecological and environmental) throughout the year.
|
|
|
|
Rainfall mm |
Gross Rainfall in kilo.cum |
Interception in kilo.cum |
Runoff in kilo.cum |

|

|

|
|
Infiltration in kilo.cum |
Ground Water Recharge in kilo.cum |
Evapotranspiration in kilo.cum |
Livestock Demand in kilo.cum |

|
|
|

|
Domestic Demand in kilo.cum |
Agricultural Demand in kilo.cum |
Gross Demand in kilo.cum |
Water Available (Anthropogenic and Terrestrial Ecosystems) in kilo.cum |
Figure 18: Hydrologic assessment in Yettinaholé catchment
Table 15: Hydrological assessment in Yettinaholé catchment
|
Description |
Quantity |
1 |
Gross Area |
179.68 sq.km |
2 |
Average Annual Rainfall |
3500 – 4500 mm |
3 |
Water Yield in Yettinaholé catchment |
9.55 TMC |
4 |
Ground Water Recharge |
0.49 TMC |
5 |
Evapotranspiration |
3.16 TMC |
6 |
Irrigation Water Requirement |
2.64 TMC |
7 |
Domestic Water Requirement |
0.03 TMC |
8 |
Livestock Water Requirement |
0.01 TMC |
9 |
Total Water Demand (anthropogenic) |
5.84 TMC |
10 |
Ecological or environmental flow |
2.8 TMC |
* Conversion of Units, kilo.cum to TMC (Thousand Million Cubic Feet)
Note: 1TMC = 28316.847 kilo.cum
|