Chandran MDS1, Rao GR2, Gururaja KV3, Ramachandra TV4,* Energy and Wetlands Research Group, Centre for Ecological Sciences, Indian Institute of Science, Bangalore 560 012, India E mail: 1mds@ces.iisc.ac.in, 2grrao@ces.iisc.ac.in, 3gururaj@ces.iisc.ac.in, 4tvr@ces.iisc.ac.in |
|
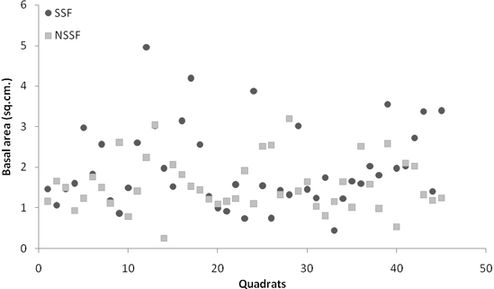
RESULTS AND DISCUSSION Basal area and Importance Value Index (IVI) In Table 8, a list of 10 tree species showing highest IVI for each of the nine SSF grid transects is highlighted. Gymnacranthera canarica and Myristica magnifica occur in six grids each and Syzygium travancoricum in four. The satisfactory regeneration of the last one is a promising northward range extension for a Critically Endangered species. Semecarpus kathalekanensis,found only in two grids, and Siddapur taluk being the only place in the world where it occurs, its population and regeneration are cause of concern (Vasudeva et al. 2001). Notable of the high IVI species of NSSF (Table 9) are Holigarna grahamii (high IVI in 8 grids), Aglaia elaeagnoideaDipterocarpus indicus, Dimocarpus longan, Hopea ponga (in 7 grids), Knema attenuata, Syzygium gardneri, Olea dioica (in 5 grids)andso on. Average basal area of trees estimated (Table 10, Table 11) is significantly higher (51.97 m2/ha) in SSF than in NSSF (39.25 m2/ha). Basal areas, for 45 SSF quadrats and 45 NSSF quadrats are shown in Fig. 17. Basal area is higher in many SSF quadrats than NSSF. The swamps are notable for their large sized trees.
Fig. 17 Basal area of trees in SSF and NSSF quadrats (45 each). |
||||||||||||||||||||||||||||||||||||||||||||||||||||||||||||||||||||||||||||||||||||||||||||||||||||||||||||||||||||||||


