 |
Ecology of the Swampy Relic Forests of Kathalekan from Central Western Ghats, India |
 |
Chandran MDS1, Rao GR2, Gururaja KV3, Ramachandra TV4,* Energy and Wetlands Research Group, Centre for Ecological Sciences, Indian Institute of Science, Bangalore 560 012, India E mail: 1mds@ces.iisc.ac.in, 2grrao@ces.iisc.ac.in, 3gururaj@ces.iisc.ac.in, 4tvr@ces.iisc.ac.in |
|
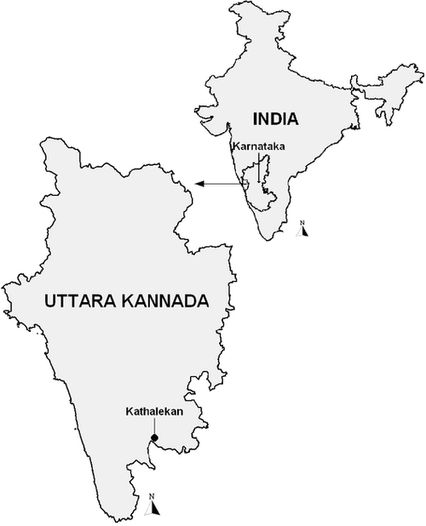
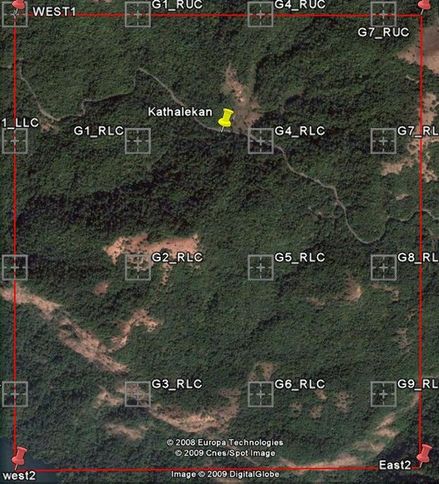
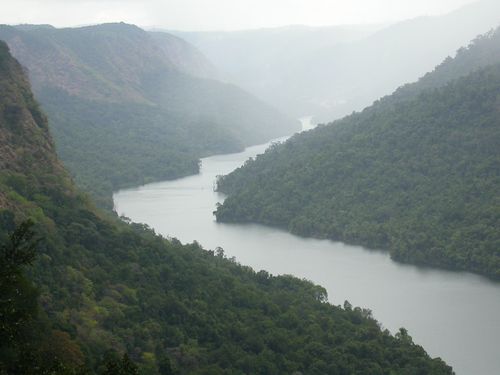
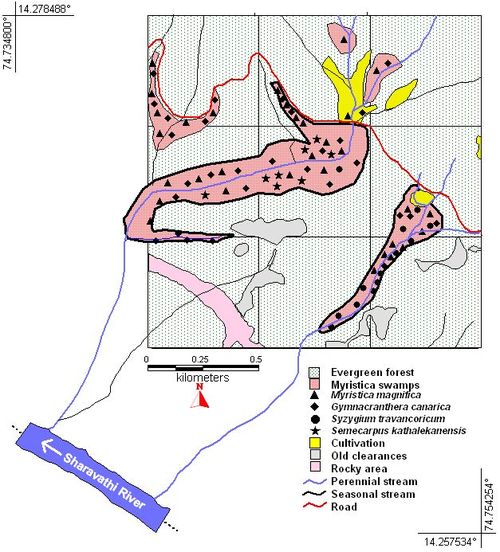
MATERIALS AND METHODS This study was conducted in the Kathalekan hamlet (14.2639° to 14.2789° N and 74.7389° to 74.754° E) of Siddapur taluk of Uttara Kannada (formerly North Kanara) district in the Central Western Ghats, in the state of Karnataka (Fig. 1). Bordered by the Arabian Sea to the west, a major part of the district’s 10,291 km2 area is covered with the low hills of the Western Ghats, their general elevation seldom rising over 600 m. Uttara Kannada has a tropical climate with a well defined rainy season between June and November with an average rainfall of 2500 mm. The western parts of the district, including Kathalekan region, exposed to the South West Monsoon, receive copious seasonal rainfall of 3000 to 5000 mm. The rainfall declines rapidly towards the east and north-eastern parts of Uttara Kannada which merge with the semi-arid Deccan region (Pascal 1988; Bourgeon 1989). Fig. 1 Location of Kathalekan. Evergreen to semi-evergreen forests dominate major portion of the district towards the west where rainfall is heavy. With declining rainfall towards the east the forests change from moist deciduous to dry deciduous types. Degraded forests in the form of savanna grasslands, scrub and thickets of biotic origin are present closer to habitations. Most forests towards the west are considered secondary, owing their origin mainly to slash and burn cultivation that was widely prevalent up to mid 19th century and thereafter in an attenuate form until the close of the century. These forests today are in different stages of secondary succession, and in many places appear like the primary forest itself (Chandran 1997, 1998). The region is dominated by complex pre-Cambrian rocks, mainly of the oldest metamorphic type rich in iron and manganese and mingled with quartz and schists. Peninsular gneiss and granites also occur here (Bourgeon 1989). For a systematic study of vegetation we chose an area of 1500 × 1500 m (total 2.25 km2). The area was divided into nine grids, each of 500 × 500 m, in three rows of three each (Fig. 2). The Honavar-Bangalore road winds its way through the first, fourth and eighth grids. The network of perennial water courses in the study area drain into the river Sharavathi, which runs through a deep gorge (Fig. 3) behind our study area. The streams flow sluggishly in some places creating swampy conditions favourable for growth of especially Myristicaceae trees. These Myristica swamps occur in almost all grids, very small in grids 3 and 7, and larger in 4, 5, 8 and 9 (Fig. 4). The gorge of the river is flanked by rocky precipices, a part rising in grid 3. The general elevation of Kathalekan ranges between 500 to 600 m. A hill to the north-east, just outside our study area, rises to 800 m. Towards north are more hills of 700 to 800 m; their slopes covered with forests whereas their tops are grassy with clumps of dwarf trees and shrubs. The folklore says these hills were under kumri (slash and burn) cultivation during earlier days. Some such old clearances, said to be used formerly for shifting cultivation, occur in grids 2, 3, 5 and 9 (Figs 2, 4). These clearances were larger than present in earlier days and today the forest could be seen advancing towards the open tops in a slow process of vegetational succession. Some farms are found in grids 4, 7 and 8, parts of which are infringements into the Myristica swamps. Fig. 2 Imagery of Kathalekan study area showing grids (Image source: Google Earth 2009). Fig. 3 Sharavathi River. Fig. 4 Land cover of Kathalekan study area. Occurrence of swamp trees shown with symbols. Forest vegetation was sampled grid-wise using transect-based quadrat method. This method was found useful especially in surveying human impacted heterogeneous forest patches of central Western Ghats (Chandran and Mesta 2001; Ramachandra et al. 2006; Ali et al. 2007). The length of the transect was fixed at 180 m. Five quadrats for study of trees (woody plants having minimum girth of 30 cm at GBH or 130 cm height from the ground), each of 20 m × 20 m area were laid along the transect alternately on right and left leaving an interval of 20 m between two quadrats. Within each tree quadrat, at two diagonal corners, two sub-quadrats of 5 m × 5 m were laid for studying shrubs and tree saplings (<30 cm girth). Within each of these two herb layer quadrats were also laid for enumeration of herbs and seedlings of trees (Fig. 5). Notes were made of the climbers and other associated species. Fig. 5 Typical transect with quadrats. A: 20 m × 20 m for trees; B: 5 m × 5 m for shrub layer; C: 1 m × 1 m for herb layer Each grid was studied using two transects, one for water courses (stream/swamp forest, SSF) and another for other forests (non-stream/swamp forest, NSSF). Water courses on the uneven terrain being heterogeneous, we placed the five quadrats of the transect selectively in different segments so as to represent variations in vegetation, and the data was recorded in the same way as for NSSF. The data was analyzed (Table 1) to calculate species diversity (using Shannon-Weiner diversity index), basal area of trees, importance value index (IVI), regeneration status of trees (based on the presence of small girth classes and saplings) and carbon sequestration potential (Ravindranath et al. 1997; Murali et al. 2005; Ramachandra et al. 2006). The trees were grouped under evergreen and deciduous and transect-wise percentage of evergreenness calculated (% of evergreen trees among the total number of trees in the transect). Percentage of trees endemic to the Western Ghats is expressed as percentage of tree endemism.
Standing biomass is computed based on empirical equation Y = -2.81 + 6.78*(BA), where y is biomass (t/ha) and BA is basal area (m2/ha) and carbon stock is computed assuming that the carbon content of dry matter is 50% of live biomass (Ravindranath et al. 1997). Carbon sequestration potential is estimated transect-wise and extrapolated to one hectare for both SSF and NSSF. |
|||||||||||||||||||||||||||||||||||||||