|
Geographical Indicators for Sustainable Management of Urban Sprawl
|
 |
1Department of Management Studies, 2Centre for Sustainable Technologies (astra), 3Centre for Ecological Sciences [CES],
4Centre for infrastructure, Sustainable Transportation and Urban Planning [CiSTUP],
Indian Institute of Science, Bangalore – 560012, India.
*Corresponding author: cestvr@ces.iisc.ac.in
|
RESULTS AND DISCUSSION
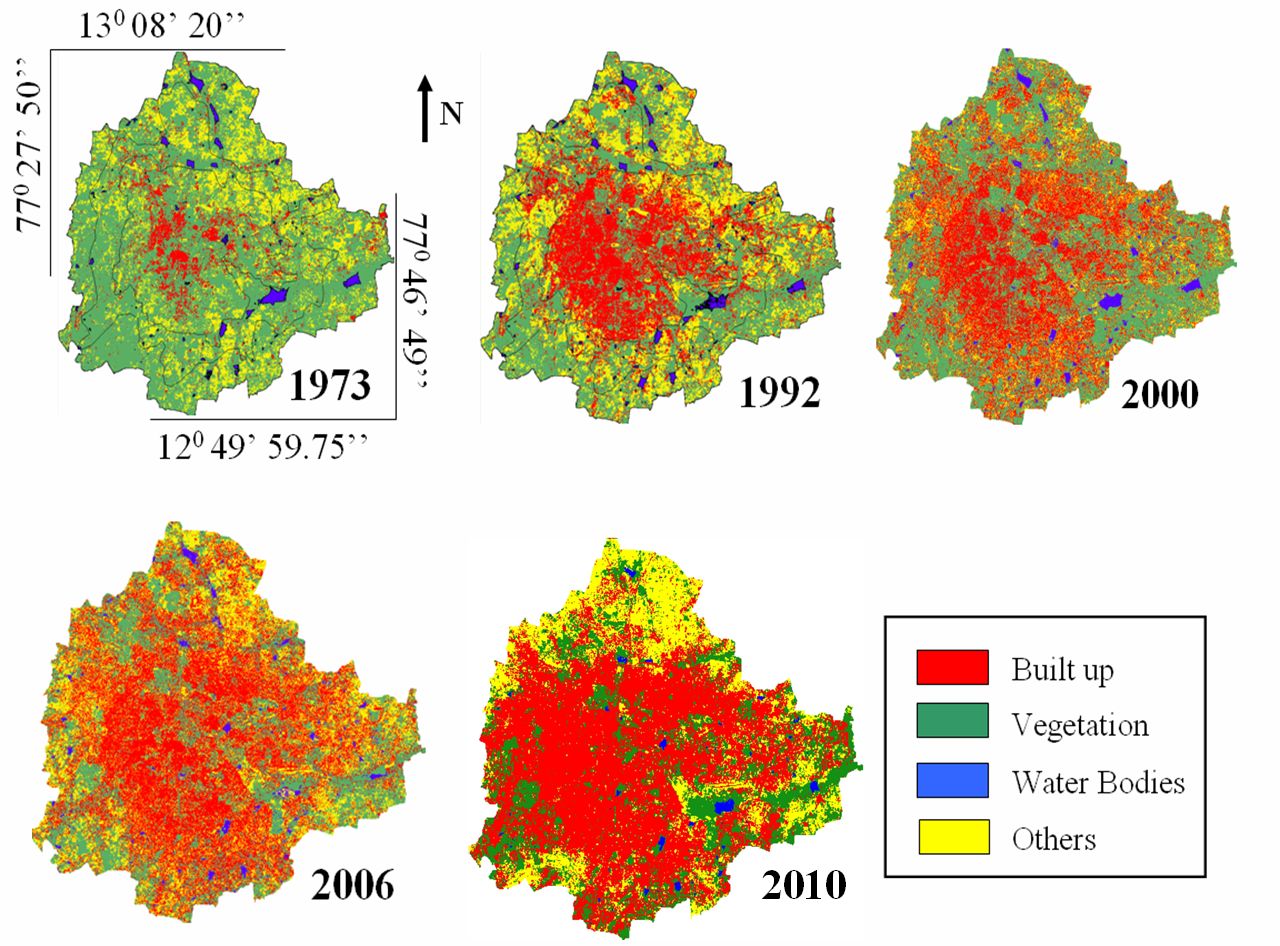
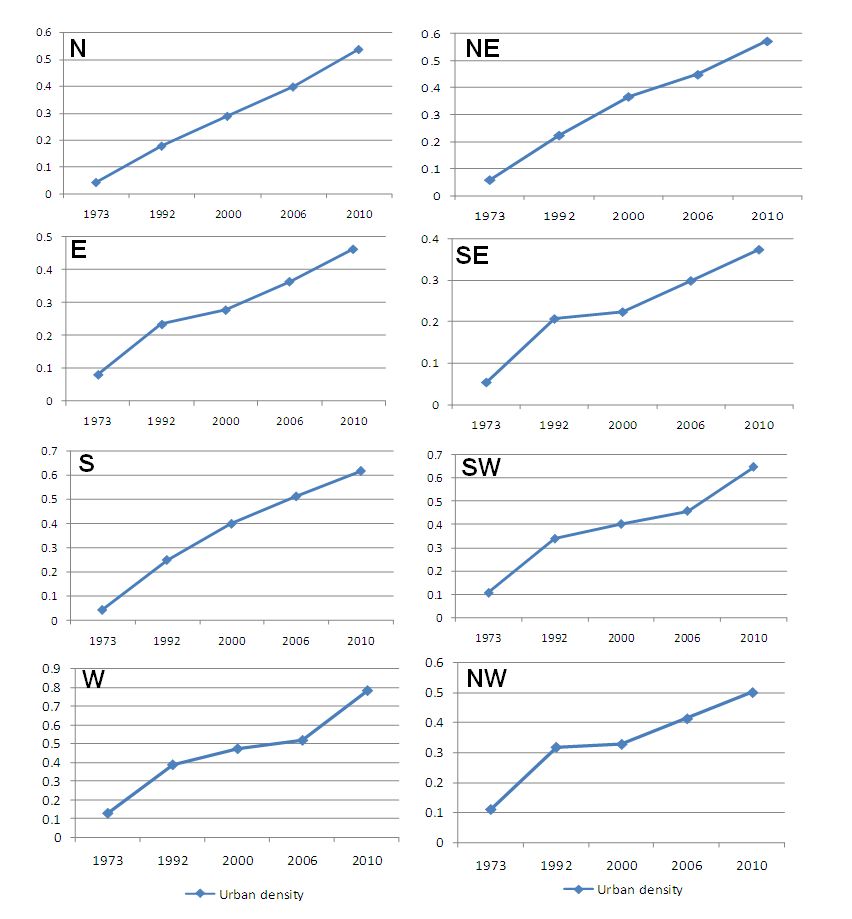
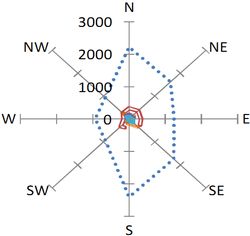
The classified images are shown in figure 3 and the statistics are listed in table 2. Overall accuracy for the classified images were 72% (1973), 75% (1992), 77% (2000), 73% (2006) and 71% (2010). Urban density is increasing in all the directions (figure 4) indicating almost a linear growth. There has been a 584% growth in builtup area in the last four decades. Vegetation has decreased by 66% and water bodies have reduced by 74%. The results obtained from each metrics are as depicted in figure 5.

Figure 3: Greater Bangalore from 1973 to 2010
Table 2: Greater Bangalore land use statistics
| Class → |
Builtup |
Vegetation |
Water Bodies |
Others |
| Year ↓ |
Ha |
% |
Ha |
% |
Ha |
% |
Ha |
% |
| 1973 |
5448 |
7.97 |
46639 |
68.27 |
2324 |
3.40 |
13903 |
20.35 |
| 1992 |
18650 |
27.30 |
31579 |
46.22 |
1790 |
2.60 |
16303 |
23.86 |
| 2000 |
24163 |
35.37 |
31272 |
45.77 |
1542 |
2.26 |
11346 |
16.61 |
| 2006 |
29535 |
43.23 |
19696 |
28.83 |
1073 |
1.57 |
18017 |
26.37 |
| 2010 |
37266 |
54.42 |
16031 |
23.41 |
617 |
0.90 |
14565 |
21.27 |
Figure 4: Urban density in eight directions showing rapid growth rate
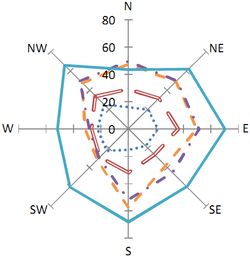
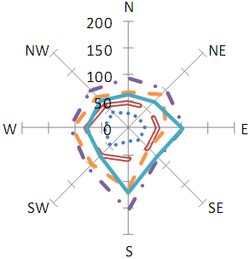
Urban growth became almost constant in southeast and northwest directions between 1992 and 2000 and then increased linearly. Largest patch developments have taken place in north and east directions (figure 5 (a)) in 2010 and medium urban development have emerged in west, southwest and south (figure 5 (a)). Separate clusters of huge urban patches have come in north (Bangalore International Airport) and east (International Tech Park Limited). Largest Patch Index (percentage of built-up) shows that urban growth is predominant in west, southwest, and south from 2000 to 2010 (figure 5 (b)). Number of patches increased from 1973 to 2000 in all directions (figure 5 (c)) showing urban sprawl. However, the city also continued to become more compact as represented by number of decreasing patches in 2010. Patch size coefficient of variance (PADCV) is the variability in patch size relative to mean patch size. Coefficient of variation of patch area is minimum in 1973 and increases towards 2010 with almost similar values in 2000 and 2006 as shown in (figure 5 (d)). MSI-CV - the standard deviation to mean ratio was maximum in 2006 and continued to decrease in 2010 (figure 5 (e)). The highest ratio was in 2000 and it showed increasing trend between 2000 and 2010. Variation in patch shape was maximum in the patch types of new residential areas and industrial areas in south Bangalore. Area weighted Perimeter-Area Ratio (figure 5 (f)) indicates that the landscape shapes were biggest in 1973 and continued to become smaller with time, having smallest patches in 2010. MPFD-CV indicated maximum variability in raggedness of boundary in 2006 and minimum in 1992 with moderate raggedness in 2010 (figure 5 (g)). This metrics helps us to understand inherent variability between and within simple and complex shapes. The compactness index measures not only the individual patch shape but also the fragmentation of the overall urban landscape (Huang et al., 2007). The more irregular the patch shape and patch number, the bigger the CI value (figure 5 (h)). ENND-CV represents higher variation in mean ENND from the neighboring patch in north, northeast, south, and southwest in 1973 and continues to decrease till 2006. In 2010, the variability again increased in all directions except northeast, west and southwest (figure 5 (i)). In 1973, the urban patches were more clustered together segregated from other patch types. From 1992 to 2006, urban areas were in close proximity with non-urban patches with increasing clumpiness towards 2010 (figure 5 (j)). Ratio of open space was more in 1973 and decreased in all directions in 2010 causing limited lung spaces and greenery for the residents (figure 5 (k)). The dominance diversity of largest patch was minimum in 1973 and maximum in 2006 for all directions and decrease towards 2010. The number of dominant urban patches was maximum in 2006 and the patches continued to aggregate in 2010 making it more compact with decreasing dominance diversity (figure 5 (l)).
Figure 5: Representation of changes in landscape structure described by various metrics.
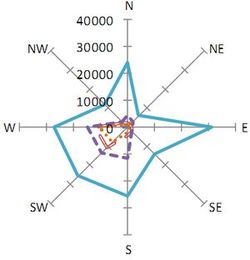
(a) Largest Patch |
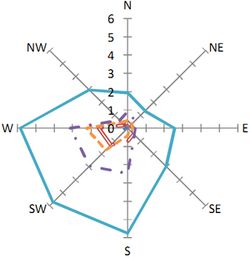
(b) Largest Patch Index (percentage of built-up) |
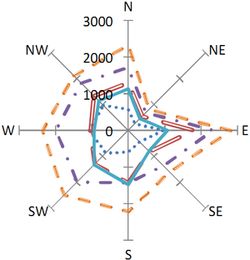
(c) Number of patches |
(d) PAD-CV (Patch size coefficient of variance) |
(e) Mean Shape Index (coefficient of variation) |
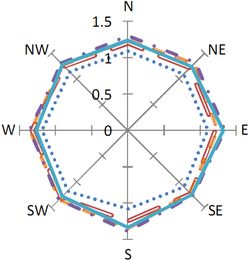
(f) Area Weighted Perimeter Area ratio |
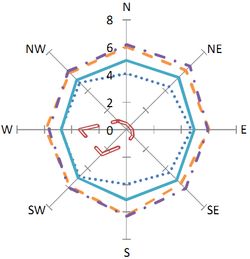
(g) Mean Patch Fractal Dimension coefficient of variation |
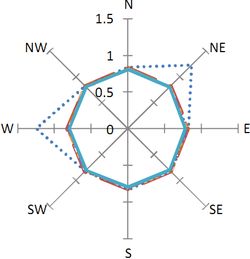
(h) Compactness Index |
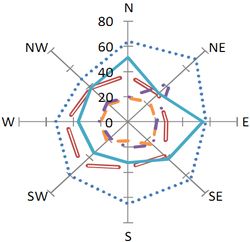
(i) Euclidean mean nearest neighbor distance - coefficient of variation |
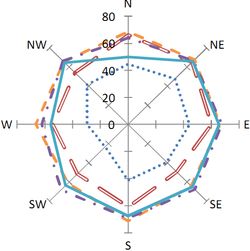
(j) Interspersion and Juxtaposition |
(k) Ratio of open space |
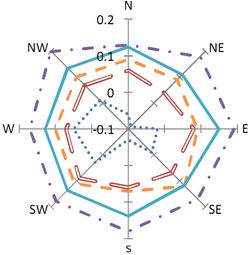
(l) Dominance index |
The study shows not only the types of land use change in various directions, but also help us to understand in a way land was compositionally and spatially organised, that aids to assess the nature of human-environment interaction through the scale, pattern, and process paradigm that is emergent in real world.
|
|
Citation : Uttam Kumar, Anindita Dasgupta, Chiranjit Mukhopadhyay and Ramachandra. T.V., 2012, Geographical Indicators for Sustainable Management of Urban Sprawl., Proceedings of SAMANWAY 2012 – National Conference Connecting Science and Society, Faculty Hall, Indian Institute of Science (IISc), Bangalore, March 3-4, 2012, pp. 1-17.
|