|
Geographical Indicators for Sustainable Management of Urban Sprawl
|
 |
1Department of Management Studies, 2Centre for Sustainable Technologies (astra), 3Centre for Ecological Sciences [CES],
4Centre for infrastructure, Sustainable Transportation and Urban Planning [CiSTUP],
Indian Institute of Science, Bangalore – 560012, India.
*Corresponding author: cestvr@ces.iisc.ac.in
|
DATA AND STUDY AREA
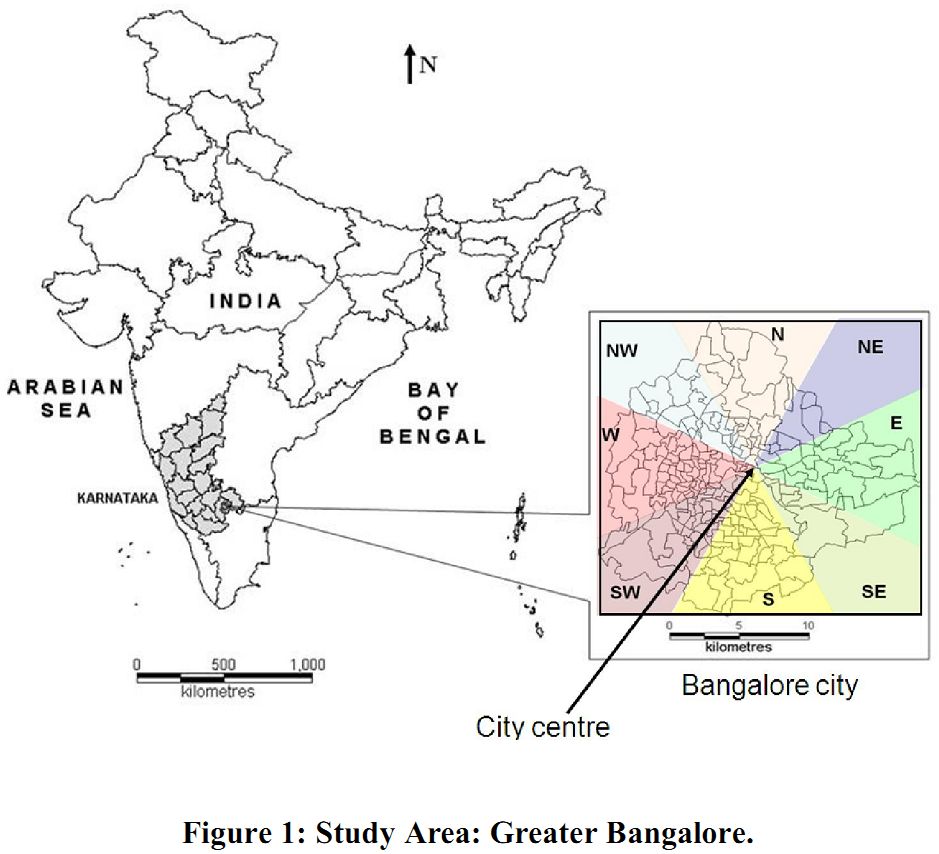
Greater Bangalore is principal administrative, cultural, commercial, industrial, and knowledge capital of the state of Karnataka with an area of 741 sq. km. and lies between the latitudes 12°39’00’’ to 13°13’00’’N and longitude 77°22’00’’ to 77°52’00’’E. Bangalore city administrative jurisdiction was widened in 2006 by merging the existing area of Bangalore City spatial limits with 8 neighbouring Urban Local Bodies and 111 Villages of Bangalore Urban District to form Greater Bangalore. Now, Bangalore (figure 1) is the fifth largest metropolis in India currently with a population of about 8 million (Ramachandra and Kumar, 2008).
Urbanisation and urban sprawl are more a local phenomenon and location specific. Local urban sprawl tends to increase along ring roads, highways in a certain direction, around service facilities in another direction, which later turn into urban centre hub that extends in all directions. Therefore, understanding the spatio-temporal pattern of urban landscape in different directions becomes necessary and relevant. In this context, the city was divided into 8 zones [North (N), Northeast (NE), East (E), Southeast (SE), South (S), Southwest (SW), West (W), and Northwest (NW)] from the ‘city centre’ or the central business district (figure 1).
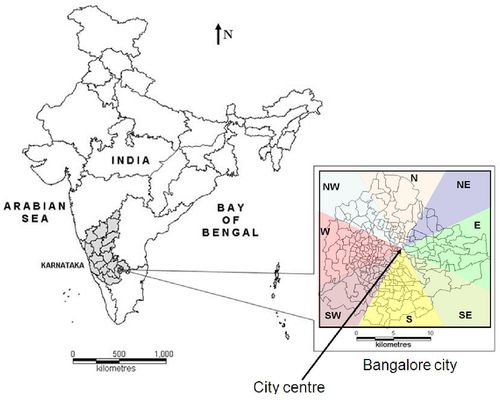
Figure 1: Study Area: Greater Bangalore
The RS data used to study the temporal changes in landscape pattern were Landsat Multispectral Scanner (MSS) of 1973, Landsat Thematic Mapper (TM) of 1992, Landsat Enhance TM Plus (ETM+) of 2000 and 2010 and IRS LISS-III MSS for 2006. The data were georeferenced, rectified and cropped pertaining to the study area. Landsat ETM+ bands of 2010 were corrected for the SLC-off by using image enhancement techniques, followed by nearest-neighbour interpolation. All these images were resampled to 30m spatial resolution (1130 rows and 1170 columns) for consistency, easy analysis and interpretation. Collateral data such as road network, drainage network, water bodies, etc. were obtained from the Survey of India (SOI) Topographical sheets of scale 1:250, 000 and 1: 50, 000. Handheld GPS (Global Positioning System) were used to collect ground information and Google Earth image (http://www.earth.google.com) were used for validating the classified outputs.
|
|
Citation : Uttam Kumar, Anindita Dasgupta, Chiranjit Mukhopadhyay and Ramachandra. T.V., 2012, Geographical Indicators for Sustainable Management of Urban Sprawl., Proceedings of SAMANWAY 2012 – National Conference Connecting Science and Society, Faculty Hall, Indian Institute of Science (IISc), Bangalore, March 3-4, 2012, pp. 1-17.
|