|
RESULTS AND DISCUSSIONS
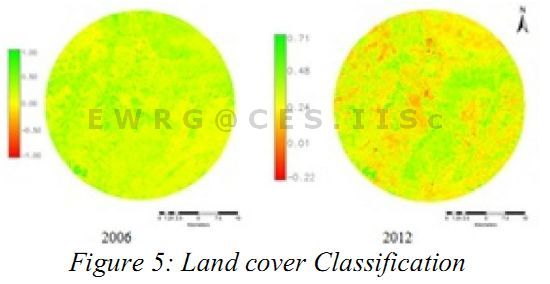
Land Cover Analysis:Slope and Distance based vegetation indices were computed, of which NDVI shows significant results and is given in Figure 5 and the details in Table 2. The vegetation cover has decreased from 96.35% (2006) to 91.74% (2012).
Table 2: Land Cover details
| Year |
Vegetation |
Non Vegetation |
| 2006 |
96.35% |
3.65% |
| 2012 |
91.74 % |
8.26 % |
Figure 5: Land cover Classification
Land Use Analysis: Temporal land use changes during 2006 and 2012 are given in Figure 6 and in Table 3. Results show an increase built-up from 4.81 % (2006) to 5.74% (in 2012), water bodies and vegetation fairly constant, while other category (including the cultivation lands, barren lands, open lands, etc.) have changed from 92.93% % (2006) to 91.58% in 2012. Overall classification accuracy achieved is about 93 % for the classified images, and table 4 gives the summary ofoverall accuracy and the agreement between the true value and the sensed value i.e., kappa statistics. Higher kappa indicates that the classified data (sensed data) is in agreement with the ground data (true data).
Figure 6: Land Use Classification
Table 3: Land use details
| Particulars |
Percentage |
Area(Ha) |
| Year 2006 |
| Water |
0.23 % |
87.47 |
| Vegetation |
2.33 % |
886.07 |
| Built up |
4.81 % |
1829.17 |
| Others & Cultivation |
92.93 % |
35339.95 |
| Year 2012 |
| Water |
0.24 % |
92.03 |
| Vegetation |
2.44 % |
928.73 |
| Built up |
5.74 % |
2190.15 |
| Others & Cultivation |
91.58 % |
34904.41 |
Table 4: Overall Accuracy and Kappa Statistics
| Year |
Overall Accuracy |
Kappa Value |
| 2006 |
93.64 % |
0.92 |
| 2012 |
93.12 % |
0.93 |
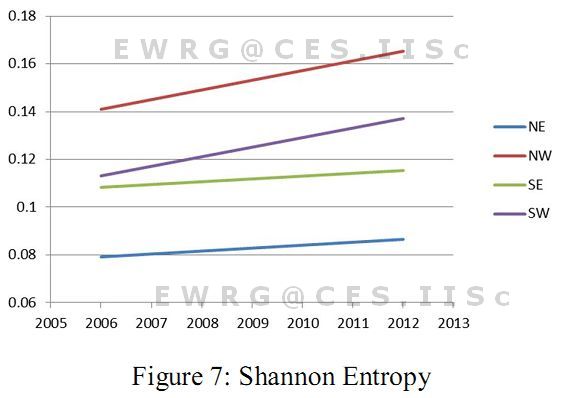
Urban sprawl assessment: Shannon’s entropy was calculated in four directions and the results aregiven in figure 7 and table5 respectively. The threshold limit of Shannon’s Entropy is log 11 (1.0414), and the values closer to the threshold value indicates the growth is scattered indicating sprawl in the region. The Shannon’s Entropy values close to zero indicates that the growth is clustered and confined. The results show increasing tendency of urban sprawl in 2006 and 2012, indicating that a tendency of dispersed growth in all directions and is evident in Figure 6.
Figure 7: Shannon Entropy
Table5: Shannon’s Entropy Analysis
|
NE |
NW |
SE |
SW |
2006 |
0.079145 |
0.14097 |
0.108442 |
0.113038 |
2012 |
0.086431 |
0.165239 |
0.115427 |
0.137098 |
|