
Spatial metrics
The spatial metrics for the year 1973, 1989, and 2010 gives the landscape status in terms of heterogeneity, diversity, etc. for each sector. Figure 8 (a) to (f) depicts sector-wise metrics across three time periods.
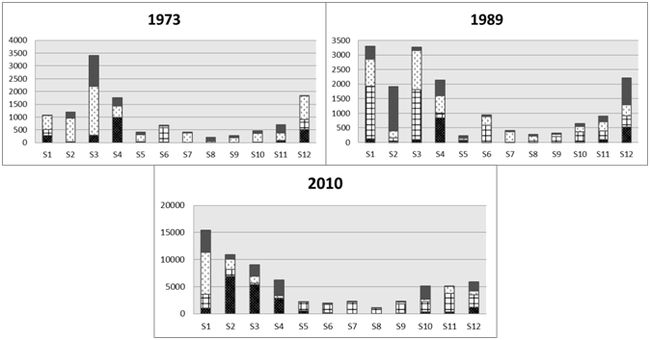
Fig. 8 (a). Number of patches (NP)
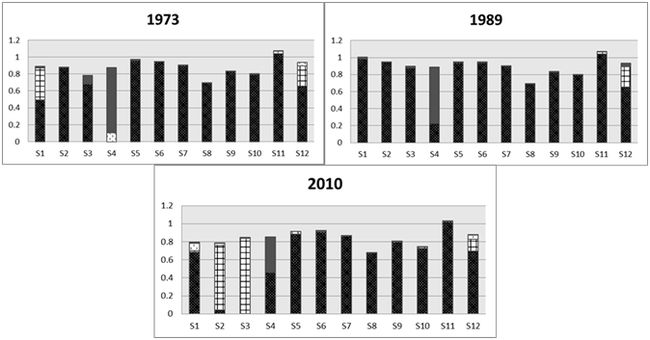
Fig. 8 (b). Largest patch index (LPI)
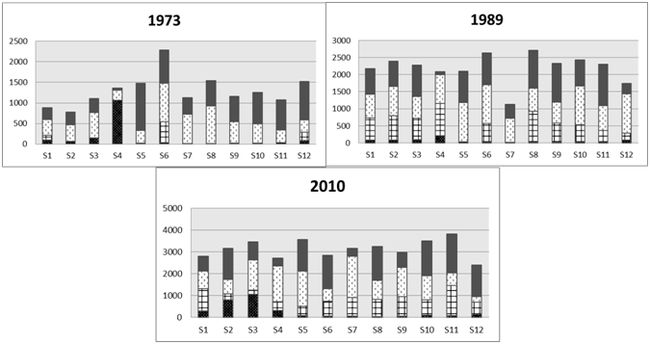
Fig. 8 (c). Perimeter area weighted mean (PARA_AM)
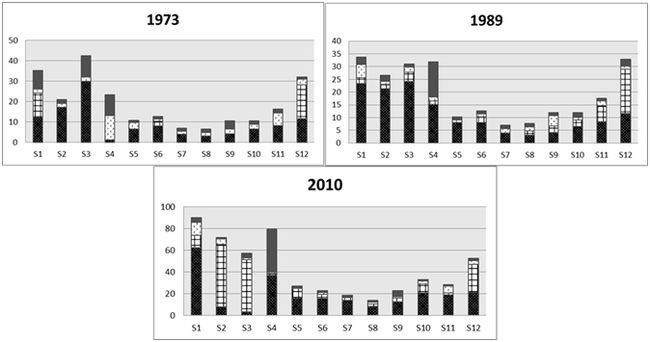
Fig. 8 (d). Area weighted mean shape index (AWMSI)
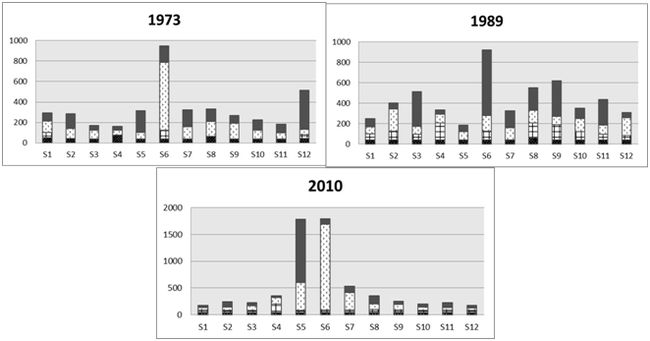
Fig. 8 (e). Euclidean nearest neighbor distance area weighted mean (ENN_AM)
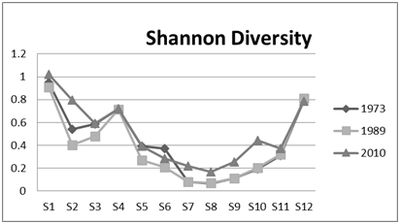
Fig. 8 (f). Shannon’s diversity
Sector 1 with dense population shows large number of patches, which explains the fragmentation of region. 11 patches in vegetation category (1973) has increased to 4118 (2010), illustrates of receding of vegetation and major green patchesare becoming more number of patches, due to the fragmentation. LPI shows that largest patch is the cropland (68.34%) in this sector among all other land use classes. PARA_AM shows highest value for urban class, which explains the shape complexity of the region because of urban spread in the region and also each land use category is showing increase in the value from 1973 to 2010 picturises complex shape of landscape.
AWMSI value is increasing from 1973 to 2010 shows the patch shapes are becoming more irregular. ENN_AM is decreasing prominently in case of cropland and urban classes because of new intermediate patches of same class are developing in the region.
Sector 2 shows of increase of numbers of cropland patches (33 to 6904), vegetation (252 to 803). This indicates the evolution of new patches during 1973 to 2010 resulting in land use changes in the region. There is no urban class in this region in 1973, but new rural agglomerations in 1989 due to the conversion of forest and croplands, which resulted in the largest patch in 2010. PARA_AM and AWMSI show the region is becoming more complex in terms of shape especially urban class (57.49) and ENN_AM of urban class has reduced (84.92 to 40.08 M) during 1989 to 2010.
Sector 3 depicts more number of patches in most land use classes except urban class. The urban class exhibit concentrated growth at Kalghatghi with new clusters. In 1973 cropland category has largest patch, but in 2010 largest patch has changed to urban category. PARA_AM shows higher values in all categories other than urban reflecting the convolution of shapes and AW_MSI explains these shapes are becoming simpler than 1989 to 2010. ENN_AM values are decreasing from1973 to 2010 shows the intermediary patch developments with complex shapes.
In sector 4 a number of vegetation patches turns out to be more (321 to 2851) and has made the area fragmented due to cultivation from 1973 to 2010. LPI shows cropland is revolved to be larger patch from vegetation. PARA_AM shows the complexity of shape with respect to forest and AWMSI shows from 1973 to 2010 cropland is becoming simpler shape by intermediate patches development of same class.
Sector 5 has more numbers of patches with respect to crop and urban classes and number of vegetation patches are coming down, which highlight of effective forest management from 1989 to 2010 but even though largest patch belongs to cropland. PARA_AM, AWMSI shows the shape complexity for cropland and urban classes. ENN_AM shows the higher value for forest patches because of intermediate croplands, which have the influence in distance between nearest neighbour patches of same class.
Sector 6 shows higher number of forest (202), urban (1588) cropland (167) patches, clearly indicates the fragmentation and also largest patch is crop land; reason behind is the Yellapur town situated in this sector. PARA_AM shows urban, cropland is having complex shapes. Among all cropland is having more convoluted shape, which is revealed by AWMSI. Because of intensified growth in the region, which shows higher distance between the open space patches.
Sector 7 is less fragmented compared to all sectors with less number of patches except urban class. In 2010 only new urban patches are observed in the region but still cropland is the largest patch because of no intermediate patches are present. But in terms of shape AWMSI shows crop land is having more convoluted shape. ENN_AM shows high value for the open space category because of no barren areas is present nearby in the region.
Sector 8 has more number of patches for urban which are isolated to each other and largest patch is cropland. PARA_AM explains all categories have shape complexity. AWMSI reveals cropland is have more convoluted shape than other. ENN_AM values came down from 1973 to 2010 due to human induced small patches.
Sector 9 is more fragmented with respect to urban and forest cover. In this sector among all classes cropland (79.7%) is largest patch. PARA_AM has high degree of complexity in land scape shape and AWMSI gives cropland and forest cover have convoluted shapes. Forest patches have less distance and open space is filled by built-up and cropland lead to higher distance of value for open space category due to intermediate urban patches.
Sector 10 has more number of urban patches (1852) with the increase in forest fragmentation evident from the increase in patches from 106 to 2482. Largest patch is located by cropland (72.63%). PARA_AM shows the complexity is unanimous for all the categories and AWMSI shows cropland and urban has high evolvement of shape. Decrease in ENN_AM with all patches are distributed in less distance to same patch type from 1973 to 2010 indicates of higher fragmentation.
Sector 11 shows the region with more number of patches for urban, crop, open space categories and forest are comparatively less fragmented. LPI shows the forest (80%) is the largest patch among all other. PARA_AM shows all categories have higher degree of shape complexity. AWMSI reveals cropland has higher convoluted shape. ENN_AM shows the progression less distance between the patches of same type.
Sector 12 is the final sector covers Ankola region having higher degree of fragmentation from 1973 to 2010 in all land use classes. LPI shows cropland (69.35%), urban (13.5%) are dominant patches. PARA_AM picturises all the land use classes have complex shapes and AWMSI extracts urban (25.7) cropland (21.78) has elongated shapes. ENN_AM shows urban; crop classes do not have any change in the distance and forest patches have lesser distances in the progression of new patches.
Shannon’s diversity index is also referred as a landscape ecological security index and a measure of the diversity is determined by both the number of different patch types and the proportional distribution of area among patch types. This index is computed by considered landscape as a whole to assess the diversity with respect to each sector from 1973 to 2010 shown in Figure 8 (f). The results shows the higher value of diversity for sector 1, sector 4, sector 9, sector 10, sector 12 because of higher fragmentation in the distribution of patches in terms of area with respect to one of land use class, especially sector 1 and 12 are experiencing development (urban) processes. Pattern process analysis is undertaken to visualise pattern, evaluate the consequences through simulation. Population density map is generated to know the distribution of population per one square kilometer. Figure 6 shows villages between Yellapur and Ankola taluks that are sparsely populated with a population density ranging from 0 to 100 persons/km2. This essentially helped as a base layer to project the scenario of growth pattern for 2020.
Considering the rate of changes in the forest cover, likely changes in the region is predicted for 2020 (Fig.9 (a), (b)) considering the business –as usual scenario and likely implementation of developmental projects in the region. Figure 9 (a) depicts the decline of forests by 11.8 percent by the Year 2020 considering the business as usual scenario. The simulation outcome given in Figure 9 (b) indicated that there would be a growth of 16.23 percent in the region consequent to land use changes with implementation of development projects like new motor ways, industries and railways. This highlight intensified urban growth for Kalghatghi, Yellapur, Ramanguli and Sunksal regions with new agglomeration and it may leads to peripheral growth with higher deforestation.
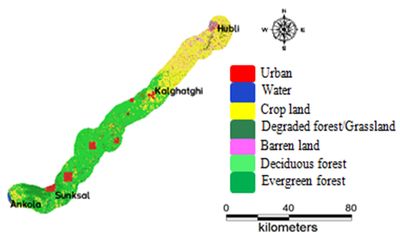
Fig. 9 (a). Base case scenario (2020)
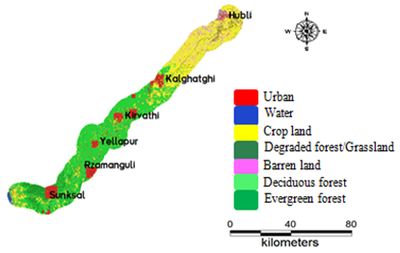
Fig. 9 (b). Scenario (2020) with the proposed developmental activities