
Results
Land Cover Analysis: Figure 4 illustrates the spatio temporal changes in the land cover, done by computing NDVI Table 3 explains the land cover changes, which show vegetation cover of 98.78% (1973) has decreased to 83.14% in 2010. Seasonal variation is evident in NDVI values of 2003 and 2004. Even though drastic land cover changes were observed during 1973 to 1989, the changes during 1989 to 2010 are relatively lower.In order to account these changes, we have considered 1973 and 1989 as base years. The rate of changes from 1973 to 1989 is 7.04% whereas 1989 to 2000 is 1.93%. These could be due to the forest conservation measures due to the ban on logging with the implementation of the Indian Forest ACT 1978 by the Karnataka forest department. The decline of vegetation during 1973 to 2010 is 15.64 %.
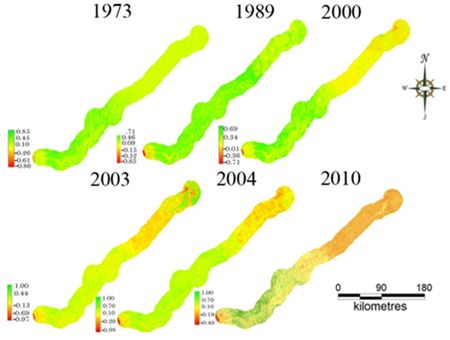
Fig. 4. Land cover analysis through NDVI
Table 3. Land cover analysis from 1973 to 2010
| Year | % Vegetation | % Non-vegetation | Temporal change | |
| 1973 as base year | 1989 as base year | |||
| 1973 | 98.78 | 1.22 | – | – |
| 1989 | 91.74 | 8.26 | –7.04 | – |
| 2000 | 89.81 | 10.19 | –8.97 | –1.93 |
| 2003 | 86.95 | 13.05 | –11.83 | –4.79 |
| 2004 | 88.38 | 11.62 | –10.4 | –3.36 |
| 2010 | 83.14 | 16.86 | –15.64 | –8.6 |
Land Use Analysis: The spatio temporal land use changes during 1973 to 2010 are given in the Figure 5 and Table 4. The urban land is increased from 0.18% (1973) to 0.81% (2010), the area of deciduous forest is decreased from 56.23% (1973) to 47.93% (2010), and the area of evergreen forest remains same due to the forest regeneration and implementation of forest policies whereas agricultural land has increased from 25.55% to 30.31%. This illustrates the influence of human induced agricultural activities are major driving forces of the changes in forest cover in the region.
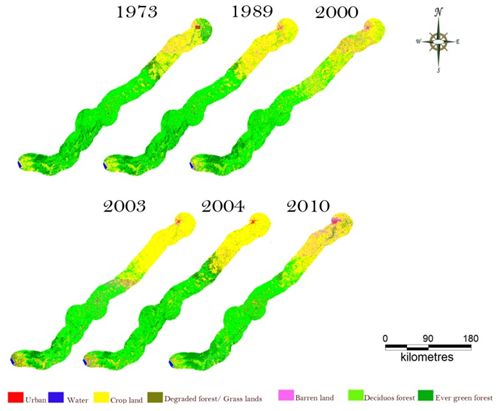
Fig. 5. Land use analysis
Table 4. Spatio temporal land use dynamics
| Year | 1973 | 1989 | 2000 | |||
| Category | Ha | % | Ha | % | Ha | % |
| Urban | 266.46 | 0.18 | 502.87 | 0.35 | 769.61 | 0.53 |
| Water | 698.67 | 0.48 | 661.62 | 0.46 | 833.5 | 0.58 |
| Crop land | 36965.48 | 25.55 | 45796.59 | 31.65 | 50447.44 | 34.86 |
| Deciduous forest | 81366.53 | 56.23 | 76157.34 | 52.62 | 73522.03 | 50.81 |
| Evergreen forest | 13249.41 | 9.16 | 13242.42 | 9.15 | 9872.05 | 6.82 |
| Degraded forest | 8690.14 | 6 | 6086.11 | 4.21 | 5275.02 | 3.65 |
| Barren land | 3465.44 | 2.4 | 2255.18 | 1.56 | 3982.48 | 2.75 |
| Year à | 2003 | 2004 | 2010 | |||
| Category | Ha | % | Ha | % | Ha | % |
| Urban | 916.21 | 0.63 | 931.16 | 0.64 | 1169.82 | 0.81 |
| Water | 800.65 | 0.55 | 510.09 | 0.35 | 835.84 | 0.58 |
| Crop land | 52198.60 | 36.07 | 49303.58 | 33.98 | 43856.97 | 30.31 |
| Deciduous forest | 67018.23 | 46.31 | 71611.1 | 48.86 | 69355.54 | 47.93 |
| Evergreen forest | 9128.59 | 6.32 | 10116.74 | 6.97 | 12709.93 | 8.78 |
| Degraded forest | 8460.63 | 5.85 | 9900.46 | 7.09 | 8949.23 | 6.18 |
| Barren land | 6179.21 | 4.27 | 2329.00 | 2.11 | 7824.8 | 5.41 |
The seasonality is one of major influential factors in the forest based landscape study. To account the seasonal variation in the vegetation cover the multi-season remote sensing data is considered, i.e. 2003 (pre-monsoon) and 2004 (post monsoon) as deciduous species shed their leaves in the pre monsoon period, which lead to the change in the reflection of vegetation in remote sensing data and it is accounted as a cropland. Further Google Earth (http://www.googleearth.com) is used to verify the data and to quantify the areas by digitising polygons from land cover map. The result shows around 3% area of dry deciduous forest is accounted as croplands.
The land use classification of temporal remote sensing data is verified with training samples which are randomly chosen for assessment. The producer accuracy computed for each category listed in Table 5, provides the probability that an area on the ground that was identified as a particular suitability type on the classified map. User accuracy is the probability that a point on the map classified as a particular suitability category will actually be that category on the ground. KHAT (KAPPA statistic) summarizes overall results and measures difference between the actual agreements in the error matrix which is ranging from 87% to 94%.
Table 5a. Accuracy assessment (PA – Producer’s Accuracy, UA – User’s Accuracy)
| Category | 1973 | 1989 | 2000 | 2003 | 2004 | 2010 | ||||||
| PA | UA | PA | UA | PA | UA | PA | UA | PA | UA | PA | UA | |
| Urban | 99.01 | 100.00 | 62.69 | 40.83 | 55.04 | 93.02 | 53.35 | 99.38 | 78.23 | 93.02 | 89.18 | 100.00 |
| Water | 99.70 | 88.26 | 99.99 | 99.86 | 99.31 | 79.49 | 99.75 | 99.42 | 98.98 | 79.49 | 91.42 | 92.44 |
| Cropland | 98.09 | 80.05 | 79.60 | 97.29 | 86.50 | 93.84 | 96.65 | 89.52 | 99.47 | 93.84 | 97.58 | 98.46 |
| Degraded forest | 60.16 | 55.44 | 94.58 | 75.65 | 96.28 | 76.45 | 52.70 | 98.82 | 39.50 | 76.45 | 86.05 | 84.64 |
| Barren land | 61.77 | 92.21 | 44.19 | 39.36 | 93.39 | 62.50 | 61.31 | 99.45 | 71.31 | 62.50 | 99.93 | 96.96 |
| Deciduous forest | 88.53 | 96.13 | 98.88 | 90.61 | 95.59 | 94.63 | 99.93 | 95.55 | 98.72 | 94.63 | 86.49 | 95.26 |
| Evergreen forest | 92.29 | 98.62 | 94.78 | 100.00 | 99.71 | 100.00 | 99.99 | 100.00 | 99.84 | 100.00 | 97.86 | 81.39 |
Table 5b. Overall accuracy and Kappa
| Year | Overall Accuracy | Kappa value |
| 1973 | 87.38 | 0.81 |
| 1989 | 91.24 | 0.85 |
| 2000 | 92.47 | 0.87 |
| 2003 | 93.51 | 0.89 |
| 2004 | 94.42 | 0.90 |
| 2010 | 93.01 | 0.90 |
Sector-wise Land use Analysis: In order to access the land use at micro scale sector wise land use assessment is done by using 2010 IRS data (finer spatial resolution of 5.8 m). The sector-wise land use pattern is depicted in Figure 7.
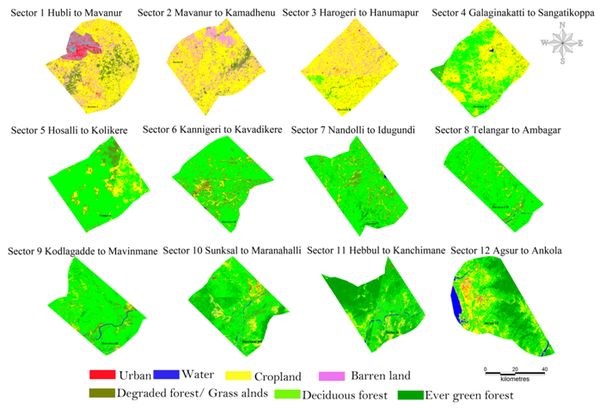
Fig. 7. Sector-wise land use dynamics
Sector 1 to 6 covers the plane section of the region; sector 6 to 10 covers the Sahyadri mountains/Ghats section and sector 11, 12 covers the coastal region. Figure 6 shows the population density in the region, which explains the human distribution in the villages, covered in gradient. Table 6 lists sector-wise land use while Table 7 lists sector-wise population with Alpha, Beta population densities.
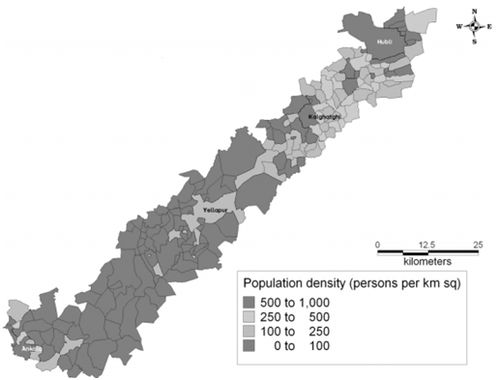
Fig. 6. Population density in the gradient
Table 6. Land use statistics of sector 1 to 12
| Category Sectors | Urban | Water | Cropland | Degraded forest | Barren land | Deciduous forest | Evergreen forest | |||||||
| Ha | % | Ha | % | Ha | % | Ha | % | Ha | % | Ha | % | Ha | % | |
| S1 | 593.8 | 4.3 | 0.58 | 0 | 8620.1 | 61.73 | 1700.3 | 12.2 | 3050.5 | 21.8 | 0.0 | 0 | 0.0 | 0 |
| S2 | 76.8 | 0.6 | 0.02 | 0 | 9015.2 | 70.3 | 840.8 | 6.6 | 2892.4 | 22.6 | 0.0 | 0 | 0.0 | 0 |
| S3 | 137.8 | 1.1 | 1.6 | 0.0 | 10329.1 | 83.3 | 249.6 | 2.0 | 1347.4 | 10.9 | 0.0 | 0 | 0.0 | 0 |
| S4 | 33.3 | 0.3 | 19.1 | 0.2 | 5406.6 | 42.6 | 292.4 | 2.3 | 5.0 | 0.1 | 5406.6 | 42.6 | 0.0 | 0 |
| S5 | 1.5 | 0.0 | 1.0 | 0.0 | 1674.8 | 13.3 | 952.8 | 7.5 | 0.0 | 0.0 | 9993.8 | 79.2 | 0.0 | 0 |
| S6 | 20.8 | 0.2 | 11.1 | 0.1 | 900.9 | 7.4 | 1677.0 | 13.8 | 0.1 | 0.0 | 9520.9 | 78.4 | 8.5 | 0.1 |
| S7 | 2.3 | 0.0 | 12.1 | 0.1 | 601.5 | 5.4 | 1225.5 | 10.9 | 0.1 | 0.0 | 8806.2 | 78.5 | 567.2 | 5.1 |
| S8 | 5.6 | 0.1 | 19.9 | 0.2 | 291.0 | 3.4 | 370.5 | 4.3 | 0.0 | 0.0 | 7556.8 | 88.0 | 339.9 | 4.0 |
| S9 | 42.0 | 0.4 | 69.7 | 0.7 | 445.6 | 4.3 | 578.5 | 5.6 | 21.9 | 0.2 | 8830.3 | 85.1 | 392.6 | 3.8 |
| S10 | 69.4 | 0.7 | 25.0 | 0.2 | 978.2 | 9.6 | 350.7 | 3.4 | 158.3 | 1.6 | 6773.7 | 66.3 | 1864.5 | 18.2 |
| S11 | 5.6 | 0.0 | 88.7 | 0.6 | 1029.0 | 7.4 | 383.8 | 2.8 | 223.9 | 1.6 | 6088.5 | 43.6 | 6146.9 | 44.0 |
| S12 | 181.0 | 1.3 | 587.1 | 4.3 | 3034.2 | 22.2 | 327.4 | 2.4 | 125.1 | 0.9 | 6050.9 | 44.2 | 3390.5 | 24.8 |
Table 7. Sector-wise distribution of population and α, β densities
| Sectors | Total Population | α Density | β Density |
| S1 | 821906 | 1384.22 | 58.85 |
| S2 | 42463 | 552.64 | 3.31 |
| S3 | 50733 | 368.16 | 4.09 |
| S4 | 12447 | 373.76 | 0.98 |
| S5 | 12320 | 8229.79 | 0.98 |
| S6 | 24359 | 1171.95 | 2.01 |
| S7 | 7517 | 3282.53 | 0.67 |
| S8 | 4789 | 855.57 | 0.56 |
| S9 | 7081 | 168.41 | 0.68 |
| S10 | 2368 | 34.14 | 0.23 |
| S11 | 5956 | 1070.26 | 0.43 |
| S12 | 59288 | 327.55 | 4.33 |
Sector 1 covers the Hubli region with the dominant land use as cropland of 61.73%, 4.25% built-up area and higher population of 8, 21,906 and α Density (1384.23); β Density (55.854) values, which explains the intense urbanisation. Cropland (70.29%) continues to be dominant land use in Sector 2 along with barren lands. This sector has the population of 42,463.
Sector 3 is dominated by cropland (83.24%) with a smaller amount of dry deciduous forest cover (2.66%). Population in sector 3 is 50,733 with α Density of 368.1 and β Density of 4.09. Sector 4 has 54% of cropland, 42% of deciduous forest and population of 12,447.
Sector 5 is mostly dominated by deciduous forest cover (79.17%) with the Density of 8229.73 and lower β Density (0.976).
Sector 6 has 78.64% of moist deciduous forest cover with the moderate α Density (24359) being the part of Yellapur town (24359).
Sector 7 rich in biodiversity is dominated by moist deciduous forest (78.52%) with small fraction of evergreen (5.06%) and human population of 7517.
Sector 8 covers moist deciduous forest (88.04%), evergreen (3.86%) and human population of 4789.
Sector 9 has dominant deciduous forest (85.06%) with evergreen forest (3.78%). Similar situation prevails in Sector 10 with deciduous (66.28%) and evergreen (18.24%) forests. This sector has sparse human population (2368) compared to all other sectors. Sector 11 has equal proportion of deciduous (43.59%) and semi evergreen (44.01%) forests. Sector 12 covers part of Ankola town and its suburbs and consists of deciduous forest (44.18%), semi evergreen (24.75%) with the population of 59288.