|
INTRODUCTION
The rapid urbanization involving the large scale changes in the catchment area and the inflow of pollutants are known to influence the water quality and thereby threatening the aquatic life and its ecosystems severely in the last decade. This has reached the critical levels by influencing the water quality furthermore on the ecosystem integrity. The significance of the role of regional impacts in determining the biological assemblages has been focused in recent years (Soininen et al. 2004), emphasizing the need for investigations on the biological components such as algae and macroinvertebrates as indicators of pollution (Alves et al.2008; Smith et al. 2007).
Diatoms are the most diverse and dominant group of algae in rivers, streams, lakes and wetlands forming the important component of the aquatic ecosystem (Stoermer and Smol, 1999). Shift in diatom community structure, in particular is used to detect change in water quality in a more integrated manner to assess the ecosystem integrity rather than traditional water monitoring. Thus, benthic diatoms have been used to monitor environmental changes because of their immediate response to physical and chemical conditions such as pH, conductivity and organic nutrients (Bennion et al. 2000, Potapova and Charles, 2003), eutrophication (Kitner and Poulícková, 2003) and global warming problems (Leelahakriengkrai and Peerapornpisal, 2010). The impact on distributional pattern of benthic diatom assemblages in relation to varying environmental characteristics are evident in streams (Soininen et al. 2004), ponds (Poulíčková et al. 2008) and lakes (Reid and Ogden, 2009) and leads to the potential use of diatom indices such as trophic diatom indices (TDI), Pollution sensitivity indices (IPS), Generic diatom indices (GDI) and Trophic diatom indices (TDIL) for lakes (Taylor et al.2007a, Blanco et al.2004). Owing to its ubiquity, diatom assemblages and pollution indices are an integral part of many stream assessment programs worldwide (Simkhada et al.2006).
Benthic macroinvertebrates are common inhabitants of freshwater systems and are also sensitive elements of aquatic biota (Alves et al. 2008). Macroinvertebrate communities play a decisive role in many ecological and eco-toxicological processes in lakes and rivers (Downing, 1991). The changes in its taxonomic richness and composition are considered sensitive tools for perceiving alterations in aquatic ecosystems (Mance, 1987). Biotic indices such as Trent Biotic index (Woodiwiss, 1964); BMWP score(Armitage et al.1983), ASPT score(Armitage et al. 1983), Wisconsin Biotic Index (BI) and Family Biotic Index (FBI) for macroinvertebrates are used to detect and monitor water quality and human perturbations in varying ecosystems like rivers (Chessman, 1999), streams (Lenat, 1994) and lakes (Schartau et al.2008). Macroinvertebrates in general explain changes in sediment composition and grain size (Robbins et al.1989), lake trophy and depth (Rasmussen, 1988), macrophyte (Downing, 1991), periphyton and other food resources (Lamberti et al. 1996) predation by fish and other invertebrates (Power, 1990) and, metals and organic contaminants (Rosenberg and Resh, 1993).
Diatoms and macroinvertebrates responses to environmental variables have been investigated in rivers and streams (Beyene et al. 2009), focusing on organic pollution (Kucuk, 2008) and anthropogenic degradation of wetlands (Lougheed et al. 2008). Niemi et al. (2009) studied diatoms and macroinvertebrates along with breeding birds, fish and wetland plant communities to develop indicators to estimate ecological conditions and suggest plausible causes of ecosystem degradation. A compiled biotic data of several indicator groups of species has been mandated under Water Framework directive program defining ecological status (CEC, 2000). However, the compiled study of several biotas and their use in wetland assessment in tropical India has been scarce. With an increase in anthropogenic activities and improper water management, urban wetlands are subjected to a variety of hydrological alterations more noticeably in arid and semi-arid regions (Pan et al. 2004). The pollution sources such as sewage, effluents from industries, agricultural wastes runoff, soil erosion, etc. has deteriorated the ecosystem's health (Kucuk, 2008, Ramachandra and Uttam, 2008). Government committee was constituted in 1986 to record the water quality of several lakes which was followed by a series of studies (Ramachandra et al. 2002, Ramachandra, 2008) explaining the physical and chemical variables of wetlands. These studies recommend the need for conserving biological diversity in an urban region and biological monitoring to assess the ecological integrity of wetlands.
The main objective of this study is to examine the response of benthic diatoms and macro invertebrate distribution in relation to water quality variables. This study is a part of an exploratory multidisciplinary research conducted in 11 urban wetlands of Bangalore, to establish the biotic integrity with biological indicators for monitoring the environmental quality of wetlands and to classify sampling sites based on their ecological status.
STUDY AREA
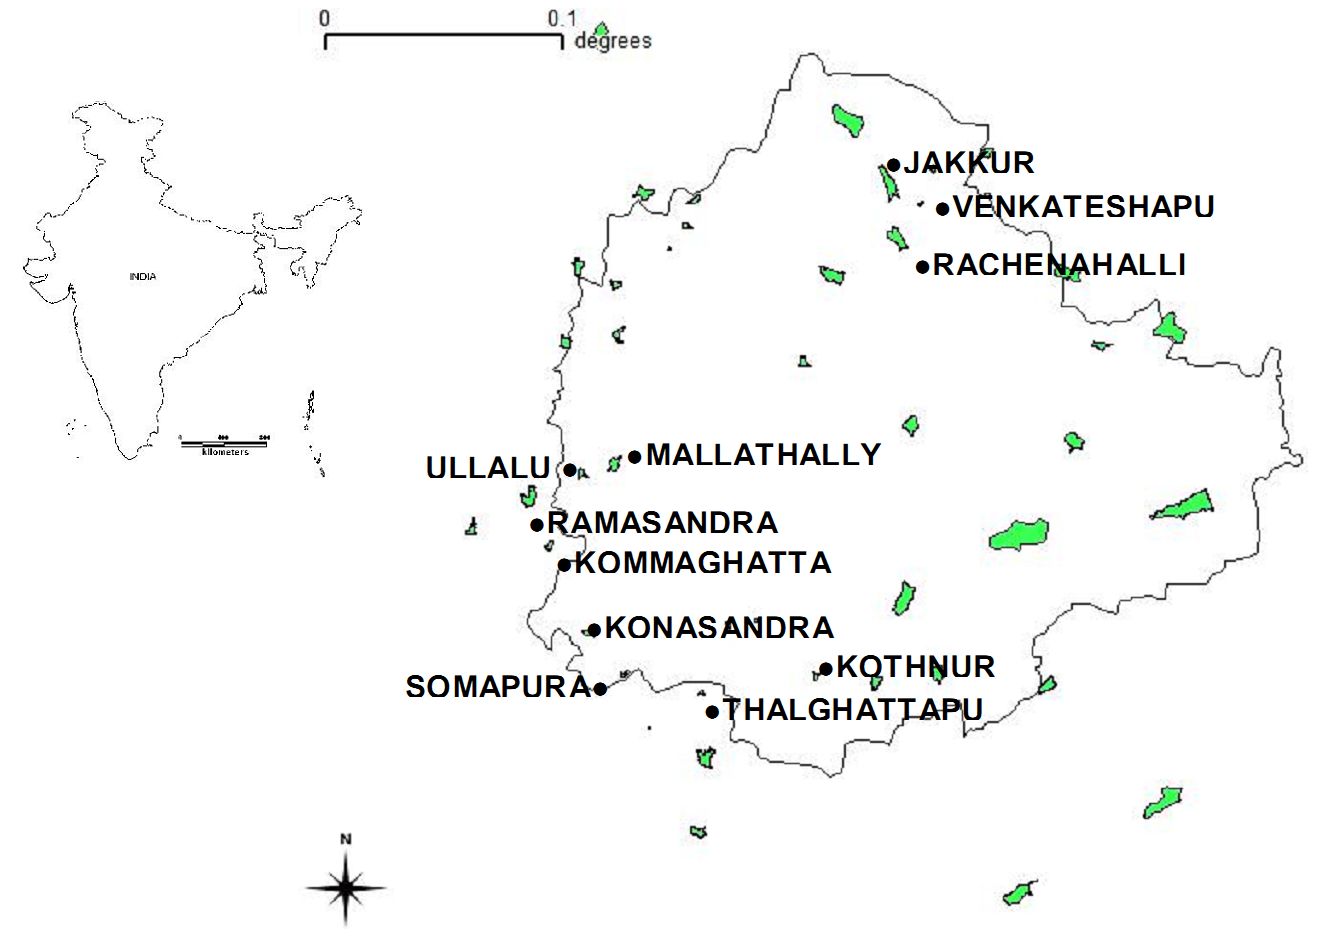
Bangalore is the principal administrative, cultural, commercial, industrial, and knowledge capital of the state of Karnataka, India (Figure 1). Bangalore is one of the fastest growing cities in India, and is also known as the ‘Silicon Valley of India’ for heralding and spearheading the growth of Information Technology (IT) based industries in the region. With the advent and growth of the IT industry, as well as numerous industries in other sectors and the onset of economic liberalization since the early 1990s, Bangalore has taken the lead in service-based industries, which have fuelled the growth of the city both economically and spatially. Bangalore has become a cosmopolitan city attracting people and business alike, within and across nations (Ramachandra and Uttam Kumar, 2008).
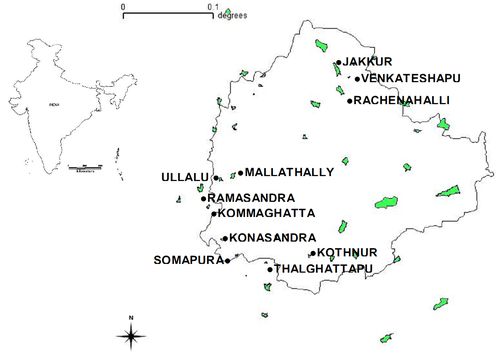
Fig 1. Bangalore map with study sites
Wetlands of Bangalore occupy about 1.48% of the geographical area (741 sq km) covering urban and non- urban areas. Bangalore is situated in the semi-arid climatic zone of the tropics. Due to its high elevation, Bangalore usually enjoys healthy climate throughout the year. Bangalore City had more than 400 interconnected lakes that followed the natural gradient of flow from one lake to the next lake/tank, thereby preventing flooding. However in recent years, the lake number has been decreased to 93 due to improper sewage treatment system and unplanned growth of the city (Ramachandra and Kumar, 2008). The city earlier harbored many wetlands to meet the domestic and agricultural needs. Ramachandra and Kiran (2000) showed the decline of 35% in the number and loss in the interconnectivity among wetlands which has been disturbing the drainage network and the hydrological regime. 11 wetlands are selected to investigate the water quality and the influence of shifts in water quality on the aquatic biota (Figure 1).
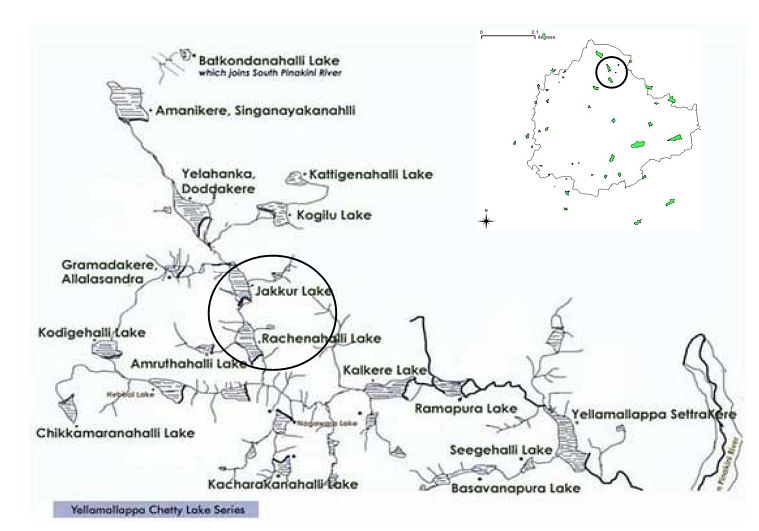
The undulating terrain in the region facilitated the creation of a large number of tanks in the past, providing for the traditional uses of irrigation, drinking, fishing and washing. This led to Bangalore having hundreds of such water bodies through the centuries. In 1961, the number of lakes and tanks in the city stood at 262. A large number of water bodies (locally called lakes or tanks) in the City had ameliorated the local climate, and maintained a good water balance in the neighborhood. Temporal analysis of wetlands, however, indicates a decline of 58% in Greater Bangalore which can be attributed to intense urbanization processes. This is evident from a 466% increase in built-up area from 1973 to 2007 (Ramachandra and Uttam Kumar, 2008). The undulating topography, featured by a series of valleys radiating from a ridge, forms three major watersheds namely the Hebbal Valley, Vrishabhavathi Valley and the Koramangala and Challaghatta Valleys. These form important drainage courses for the interconnected lake system which carries storm water beyond the city limits. Bangalore, being a part of peninsular India, had the tradition of storing this water in these man-made water bodies which were used in dry periods. Today, untreated sewage is also let into these storm water streams which progressively converge into these water bodies. Varthur is one such wetland at the end of a chain of lakes. Figure 2 illustrates the interconnectivity among lakes (digitized from the Survey of India topo-sheets of 1:50000 scale. Jakkur, Rachenahalli, Yelahanka and Allalasandra wetlands are interconnected in the watershed and overflow of Jakkur drains to the Rachenahalli wetlands. The objective of this study is to examine the influence of water quality on benthic diatoms and macroinvertebrates especially to pollution loads. The study also evaluates the applicability of benthic diatoms and macroinvertebrate indices to monitor wetlands of tropics, which were developed and validated to temperate and other regions. The similarity in water quality and also indices in the interconnected wetlands highlight the transport of water in the chain. Table 1 lists the spatial extent (area), catchment, lake system surrounding the lake (as per Bangalore Development Authority, BDA) and the pollution status (as per Bruhat Bengaluru Mahanagara Palike, BBMP). Table 2 lists the acronyms used for the study sites.
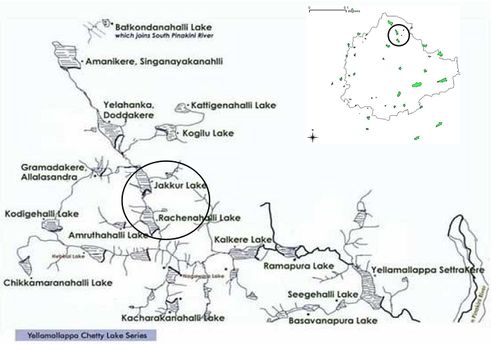
Fig 2. Interconnected lakes in Yellamallappa chetty lake series (In circle, Jakkur, and Rachenahalli lakes under this study)
Table 1. Details of lakes selected for the study. (* Data compiled by BDA. ** data compiled by BBMP)
| Wetland |
Geographic co-ordinates
(Lat/long) |
Depth (m) ** |
Size of the lake in Ha (Weed cover in Ha)** |
Catchment area in Ha ** |
Lake system* |
Remarks** |
| Jakkur |
130 04’ N/ 770 36’ E |
1.25 |
59 (5.1) |
806 |
Jakkur, Yelahanka, Allalsandra |
Domestic sewage run-off of Jakkur village, urbanization, fields, plantations |
| Rachenahalli |
13o03' N/ 770 37’E |
1.7 |
44.35 (2.1) |
850 |
Yelahanka, Jakkur, Venkateshpura |
Runoff of surrounding village, urbanized area, fields, plantations |
| Venkateshpura |
13o03' N/ 770 37’E |
2.33 |
4.4 (0.1) |
109.5 |
Venkateshpura |
Runoff of Jakkur village, urbanized area, fields, plantations, quarry |
| Ullalu |
-- |
2.91 |
12.64 |
342.8 |
Ullalu,
Mallathally |
Vacant land, less human density, less vegetation, more road sediment near inflow and soil erosion |
| Mallathally |
-- |
1.54 |
23.516 |
618 |
Mallathally
Hirohalli |
Discharge of surrounding sewage, defecation, Layout run-off |
| Ramasandra |
120 55’ N/ 77027’ E |
3.2 |
54.77 (1) |
1629 |
Kanneli lake, Kenchanapura, Ramasandra |
Inflow from fields and plantations, undeveloped areas |
| Konasandra |
120 53’N/ 770 29’ E |
1.4 |
15.11 (5.5) |
128 |
Vrishahavathi river |
Upper reaches include forest area and urbanized at other parts |
| Kommaghatta |
-- |
2.51 |
|
553 |
Kommaghatta |
Sewage discharge, Plantations, road run-offs |
| Somapura |
120 52’N/ 770 30’ E |
1 |
7.49 (1.29) |
93 |
Vrishahavathi river |
Urban developments, road run-offs |
| Thalghattapura |
120 59’N/ 770 32’ E |
2.5 |
7.85 (1) |
217.45 |
Thalghattapura |
Open fields, rugged terrain in forest, Layout run-off |
| Kothnur |
120 52’N/ 770 34’ E |
1.75 |
7.375 (0.5) |
89.9 |
Kothnur |
Developed area, layout run- offs |
Table 2. List of sampling sites with codes
| Codes |
Sampling site |
Codes |
Sampling site |
Codes |
Sampling site |
| JK |
Jakkur |
KMO1 |
Kommaghatta outlet 1 |
KT |
Kothanur |
| JKI1 |
Jakkur inlet 1 |
ML |
Mallathally |
KTI1 |
Kothanur inlet 1 |
| JKI2 |
Jakkur inlet 2 |
MLI1 |
Mallathally inlet 1 |
KTO1 |
Kothanur outlet 1 |
| JKO1 |
Jakkur outlet 1 |
MLO1 |
Mallathally outlet 1 |
KN |
Konasandra |
| RC |
Rachenahalli |
UL |
Ullalu |
KNFN |
Konasandra fencing |
| RCI1 |
Rachenahalli inlet 1 |
ULI1 |
Ullalu inlet 1 |
KNL1 |
Konasandra layout |
| RCI2 |
Rachenahalli inlet 2 |
ULO1 |
Ullalu outlet 1 |
KNI1 |
Konasandra inlet 1 |
| RCO1 |
Rachenahlalli outlet 1 |
TA |
Thalghattapura |
KNO1 |
Konasandra outlet 1 |
| VN |
Venkateshapura |
TAI1 |
Thalghattapura inlet 1 |
RM |
Ramasandra |
| VNI1 |
Venkateshapura inlet 1 |
TAI2 |
Thalghattapura inlet 2 |
RMI1 |
Ramasandra inlet 1 |
| VNO1 |
Venkateshapura outlet 1 |
TAO1 |
Thalghattapura outlet 1 |
RMA1 |
Ramasandra animal grazing 1 |
| KM |
Kommaghatta |
SM |
Somapura |
RMO1 |
Ramasandra outlet 1 |
| KMI1 |
Kommaghatta inlet 1 |
SMI1 |
Somapura inlet 1 |
RML1 |
Ramasandra layout 1 |
| KMI2 |
Kommaghatta inlet 2 |
SMO1 |
Somapura outlet 1 |
RMB1 |
Ramasandra boat 1 |
|