|
Results
Algal growth was measured in terms of increase in biomass concentration (mg L-1) and is elucidated in Fig. 1. There was an initial lag phase observed during the growth of Euglena cells. However, after day 2, they grew very fast in these wastewater cultures. However, growth curve was not consistent as there was another growth stress observed at the end of day 4. With the starting density of 0.18+0.06 g L-1, the dry biomass cell weight of the algal cells went up to 1.24+0.74 g L-1 (dense culture) (Fig. 1). There was sudden increase up to 5 times in the density from the 2nd to the 4th day, following a small lag phase further reaching a maximum on the 8th day. The CN elemental analysis of the dry biomass showed a significant increase in the N content from 3.3+0.76 % to 4.4+0.24 % (p<0.05) at the end of the day 4 and thereby a significant decrease in the C value from 33.63+1.34 to 18.01+3.23 (p<0.01) at the end of day 5 (Fig. 2). The C:N ratio significantly decreased from 10.09+2.12 to 7.72+1.34 (p<0.05) at the end of day 4.
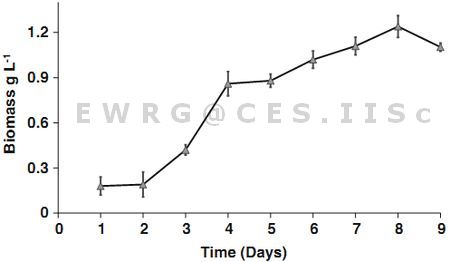
Fig. 1: Growth of Euglena sp. in the wastewater culture
[error bar shows mean + SD (n=3)]
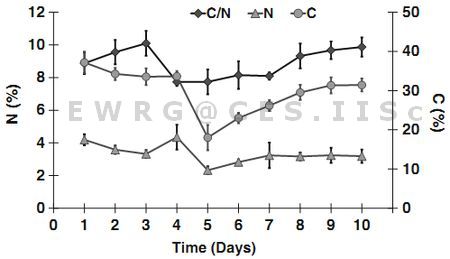
Fig. 2: C and N content of Euglena sp. during growth and C/N ratio
[error bar shows mean + SD (n=3)]
pH values showed a consistent increase from 6.1+0.1 to 9.16+0.57(p<0.01) (Fig. 3). The specific growth rates (µ) picked up in the initial period and reached maximum on day 4 (µ=0.7932 d-1) after which it decreased significantly. 90% of TOC was removed rapidly within a period of six days from 256+21 to 20.75+12.5 mg L-1 as depicted in Fig. 4. Though there was a lag phase in the initial growth stages but that did not affect the TOC removal process which started from the day of initiation of the culture experiment. TOC was the lowest on day 6 after which it slowly increased to an insignificant extent (p<0.05) as depicted in Fig. 4 and majority of the carbon were up taken during the first 3 days of the culture experiment.
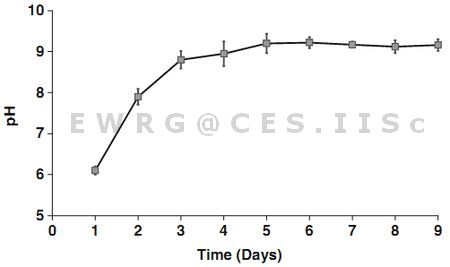
Fig. 3: pH of Culture (mean+S.D)
[error bar shows mean + SD (n=3)]
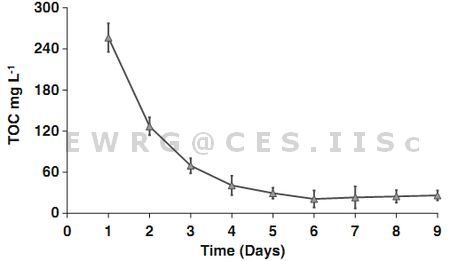
Fig. 4: TOC removal in algal culture
[error bar shows mean + SD (n=3)]
Total Nitrogen removal of 93% was observed in just 8 days (Fig. 5). From an initial concentration of 32.5+0.13 mg L-1, the values dropped down to 2.28+0.06 mg L-1. Most of the N removal had happened from day 2 to day 7. Similarly NH4-N was almost removed i.e. more than 98% at the end of day 8 (Fig. 5). The major NH4-N removal also occurred during the peak growth period till the day 6 wherein almost 90% of NH4-N was removed in just 4 days. However there was no significant nitrification (p<0.01) taking place in spite of mixing and prevalence of oxidizing conditions. The NO3-N values increased to 0.9 mg L-1 from 0.1 mg L-1 on day 6 and then decreased (Fig. 5). The proportion of NO3-N compared to the NH4-N was observed to be 1:25. Similarly NO2-N levels were very insignificant that increased to a certain extent during the growth from 0.89 to 0.03 mg L-1 (Fig. 5). As compared to the C and N removal, the efficiency of Phosphorus removal was observed to be low. Around 66% (16.25+1.22 to 5.49+1.32 mg L-1) of TP were removed and the removal started from the end of day 3 up to the end of day 7 after which it was very slow (Fig. 6). The orthophosphate was reduced from 16+1.22 to 2.44+1.32 mg L-1 showing a removal efficiency of 85%.
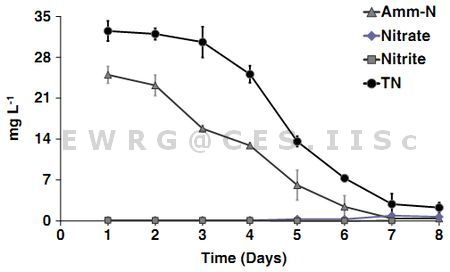
Fig. 5: TN, NH4-N, NO3-N and NO2-N removal
[error bar shows mean + SD (n=3)]
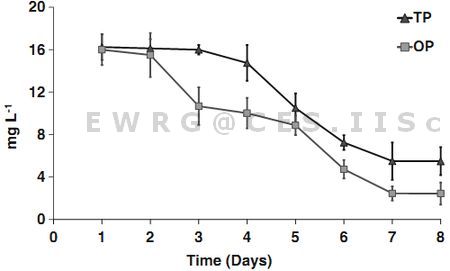
Fig. 6: TP and Ortho-P removal
[error bar shows mean + SD (n=3)]
ATR–FTIR spectra of the Euglena cells showed 7 distinct absorption bands with the wave numbers ranging from 1800-800 cm-1 (Fig. 7). These bands were assigned to specific functional groups following biochemical standards and published matter (Stehfast et al. 2005). Assignments of bands corresponding to the functional groups are provided in the Table 2. Out of all these bands, three bands were most important for the study i.e. ~1740 cm-1 for ester/fatty acid, ~1655 cm-1 for proteins and ~1150-950 cm-1 for carbohydrates. The characteristic lipid peak can be very distinctively visualized in the FTIR spectra at ~1700 cm-1 during the final phases of the culture (Fig. 7). Fig. 7 also illustrates the changes in the FTIR spectra with the culture time from day 1 to day 9. The compositional changes were traced by the Carbohydrate/Amide (C/P) and Lipid/Amide (L/P) changes of Euglena sp. Cultures experienced an increase in the L/P band ratio from an initial value of 0.025 to 0.26. There was a significant increase in the ratio during day 2 and 3 (p<0.05). C/P ratio increased significantly from 0.94 to 2.4 (p<0.01) on day 6 (discussed later in Fig. 10).
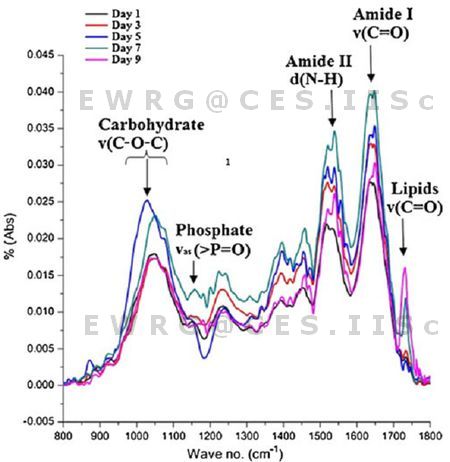
Fig. 7: FTIR spectra of the algal biomass during the culture period. The Major band assignments are illustrated as functional groups
Table 2: Band Assignments for the various functional groups/substrates in algal cells
| Band Assignments |
Functional groups |
| ~1740 cm-1 |
ν(C=O)stretching of ester groups, primarily from lipids and fatty acids |
| ~1655 cm-1 |
ν(C=O)stretching of amides from proteins (Amide I) |
| ~1545 cm-1 |
δ(N–H)bending of amides from proteins (Amide II) |
| ~1455 cm-1 |
δas(CH2) and δas(CH3) bending of methyl from proteins |
| ~1380 cm-1 |
δs(CH2) and δs(CH3) bending of methyl and νs(C–O) stretching of COO– |
| ~1240 cm-1 |
νas(>P=O) stretching, associated with phosphorus compounds |
| ~1000 cm-1 |
ν(C–O–C) stretching from polysaccharides |
The lipid content ranged from 9+0.77% to 24.62+0.98% dry weight of algal biomass. The daily measurement of lipid content of the centrifuged and dried algal biomass showed an increase in the lipid content on day 2 of the culture (18+1.23%) after which there was a steep decrease. Lipid increased from day 6 and was maximum (25.6 %) on day 9 (Fig. 8). FAME Composition of lipids through GC-MS analysis showed 13 different types of fatty acid methyl esters, where almost 51 % were unsaturates. Among the fatty acid methyl esters palmitic acid (C16:0) was the most dominant with 46%, followed by α linolenic acid (~23%) followed by linoleic acid (22%) and stearic acid (3%) (Fig. 9). Unsaturated fatty acids were comparatively higher than saturates and poly-unsaturated fatty acids (PUFA) were 46.6 %.
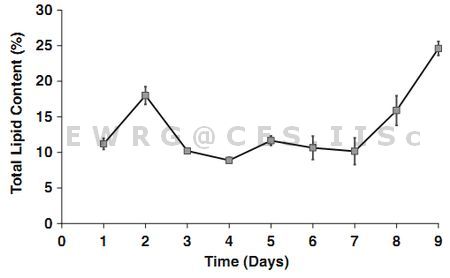
Fig. 8: Changes in Lipid content of Euglena sp.
[error bar shows mean + SD (n=3)]
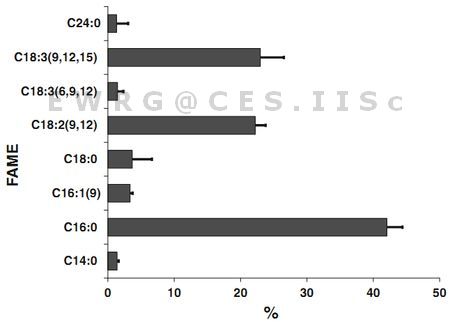
Fig. 9: Major FAME obtained during the analysis
[error bar shows mean + SD (n=3)]
|
