|
Discussion
Euglena sp. isolated from urban wastewaters was able to grow in domestic wastewater utilising the dissolved nutrients and minerals in culture solutions. Observations showed high tolerance of Euglena sp. to raw sewage and the ability to grow mixotrophically as in other chlorophyceae members (Bhatnagar et al, 2010). Euglena sp. is a potential indicator of the presence of high quantity of organic carbon in wastewaters (Mahapatra et al, 2011a) and hence its eco-chemical characteristics are presently being used for wastewater de-contamination (Ahmed and Hader 2011). Species heterotrophy is advantageous as it reduces the dependencies on bacteria to decompose complex organic matter in sewage and hence treat the water faster. TOC, TN and TP concentrations of the feed were intermediate, compared to the earlier reports (Wang et al. 2010a; Zhou et al. 2102) and does not require pre-treatment through anaerobic digestion (Park et al., 2010). The domestic wastewater without any pre-treatment favours algal growth (as in current experiments) compared to highly concentrated wastewater samples as in centrate water (sludge concentrated water) and dairy wastewaters (Wang et al, 2010a,b). Organic carbon in wastewaters can manifest into acids like acetate, butyrate or alcohols in the absence of pre-treatment (Zhou et al. 2012) and can be easily utilised by mixotrophic algae like Euglena sp. (current study) and Chlorella sp. (Liang et al. 2009), Scenedesmus sp. (Li et al. 2010). Voluminous nutrient content in such domestic wastewater helps in the profuse biomass growth and rapid nutrient uptake.
After the initial lag period, there was a rapid increase in the average specific growth rate (µ) from 0.05 day-1 (day 2) to 0.72 day-1 (day 4) during culturing (Table 3), this was due to heterotrophic algal growth with the availability of abundant soluble organic matter as mentioned in earlier studies (Bhatnagar et al, 2010). TOC is correlated significantly with the specific growth rate µ (R2=0.77). Decline of TOC with the increase in µ suggests rapid organic C consumption during the initial stages of the culture, similar to the earlier reports (Ogbonna and Tanakaah 1998). This highlights the importance of soluble C for good growth of cells and indicates healthy heterotrophic growth of Euglena sp. The absence of visible suspended particles in the culture solution initially aided light penetration and algal growth as algal cells adapted to the wastewater environment.
Table 3: Variations in the growth rate, biomass productivities and Lipid productivities with specific growth rates: µ (t: days) with the culturing time
| Time |
Biomass Productivities (g L-1 d-1) |
|
Lipid Productivity (%) |
| Days |
Prod. (mgL-1/d) |
Growth Rate |
% Increase |
µ (SGR)
in d-1 |
|
% Lipid Content |
Daily Acc. rate |
%
Increase |
| 1 |
0.18 |
|
|
|
|
11.20 |
|
|
| 2 |
0.19 |
5.26 |
85.48 |
0.05 |
|
18.00 |
60.71 |
54.51 |
| 3 |
0.42 |
54.76 |
84.68 |
0.79 |
|
10.20 |
-43.33 |
26.89 |
| 4 |
0.86 |
51.16 |
66.13 |
0.72 |
|
8.88 |
-12.94 |
58.57 |
| 5 |
0.88 |
2.27 |
30.65 |
0.02 |
|
11.65 |
31.19 |
63.93 |
| 6 |
1.02 |
13.73 |
29.03 |
0.15 |
|
10.64 |
-8.67 |
52.68 |
| 7 |
1.11 |
8.11 |
17.74 |
0.08 |
|
10.16 |
-4.51 |
56.78 |
| 8 |
1.24 |
10.48 |
10.48 |
0.11 |
|
15.89 |
56.40 |
58.73 |
| 9 |
1.10 |
-12.42 |
0.00 |
-0.12 |
|
24.62 |
54.94 |
35.46 |
Euglena sp. entered the exponential phase after two days of lag period indicating the stress due to changes in the environment (as it was previously grown in BB media) and slowed down between the fourth and the sixth day (Table 3). Elemental analysis of Carbon and Nitrogen in the algal biomass indicated the transition through increased protein synthesis due to the rapid N uptake and turnover during day 4. This is also evident from the decline of C:N ratio from day 4 onwards indicating the slowing down of the growth (Fig. 2). TOC/TN ratio of the culture broth also showed a lower value during the day 4 and 5 of the culture period indicating rapid C fixation into algal biomass compared to N fixation. These observations help in understanding C and N dynamics including C partitioning in the algal biomass, however it requires further investigation.
Removal of nutrients with lower N:P ratio of 2:1 is observed compared to the earlier experiments with N:P ratio of 20-11 (Ho et al. 2003; Boelee et al. 2011). N removal assessment show faster NH4-N removal by rapid consumption, favoured by organic C availability in the medium and subsequent decline in algal growth due to exhaustion of NH4-N (Fig. 5). Higher N removal efficiencies were observed compared to other studies conducted in the batch mode (Woertz et al. 2009; Wang et al. 2010a,b; Cho et al. 2011). The highest N removal was observed during the fifth and the sixth day possibly owing to very high growth rates. NH4-N removal of ~98 % in 8 days (Fig. 5) was observed, contrary to TN removal of only 31% with Scenedesmus sp. (Li et al., 2011) with a decrease in biomass density at NH4-N loads of 15 mgL-1. Scenedesmus acutus removed ~90 % of NH4-N in 8 days of a batch culture in ammonia rich (NH4-N ~32 mg L-1) wastewater (Doria et al. 2012).
High NH4-N removal is observed during the 5th to the 7th day (~60%; Fig. 5). In certain cases NH4-N removal takes place by NH3 volatilization at high temperature under alkaline conditions (Tam and Wong 1990), due to high urea content in wastewaters (Matusiak et al. 1976). In the present study, NH4-N removal can be attributed to algal uptake than volatilization as temperature was always below 26ºC and urea was not a major constituent of the wastewater. Small fraction of NH4-N is also absorbed through cell walls of microorganisms (Volensky 2001; de Philippis et al. 2007). Nitrate (NO3-N) and nitrite (NO2-N) values reveal low nitrification during the culture growth. There was an increase in NO3-N due to excess of NH4-N in the system initially, up to day 6 after which it decreased. Though algae assimilate NH4-N, (at a higher rate) still some NH4-N was available for nitrification up to day 6. After day 6, N started limiting thus ceasing subsequent nitrification (Fig.5). Decrease in the nitrate content after day 6 is due to the uptake of nitrates and nitrite along with NH4-N by algae as they were in the exponential phase comparable to the earlier experiment (Stefast et al. 2005). NO2-N values consistently decreased showing low nitrification. Chlorella sp. also showed a decrease in nitrite content accompanied by a decrease in nitrate content at an initial N concentration of 17 mg L-1 (Wang et al. 2010b). Low nitrification can be attributed to the unavailability of the N sources i.e. NH4-N at the time of nitrification, lack of substrates for the attachment and growth of the nitrifiers, and low culture time as nitrifiers are slow growers (Wiesmann 1994).
Total Phosphorus (TP) was reduced by 66% from 16.5 to 5.5 mg L-1, and most of the P was removed on the days 5 and 6 (Fig. 6). P removal efficiency was lower compared to the 72% removal in digested diary manure (Wang et al. 2010a), 86% removal from concentrated wastewater (Wang et al. 2010b), 90 % removal from artificial wastewater (Yujie et al. 2011) and ~85% removal from secondary treated wastewater (Cho et al. 2011). Lower TP removal of 66 % highlights the availability of large quantity of unutilised P and with a small supplemental C and N to the broth would aid in the algal growth and hence the complete removal of nutrients. There are chances of P precipitation under high pH conditions (Song et al. 2002). As the culture experienced a rise in pH up to 9, the total phosphate removal can be attributed to both algal uptake and P precipitation. Ortho-P got removed by 85% through uptake during the exponential stages of the algal growth. ~15% of the easily accessible P was still unutilised in the medium due to stunted algal growth with C and N limitation. Similar findings were also reported by Zhou et al. 2012. Earlier studies (Aslan and Kapdan 2006) attribute the underutilisation of P to light limitation due to dense biomass in the culture. The N/P ratio of the algal biomass normally ranges between 6.8-10 (Wang. 2010b). N/P ratio of 2 was observed during the initial phase of algal culture which declined to 0.42, indicating excess P concentration all along the growth phase. This alteration however did not affect the algal growth and N consumption as in other studies (Wang et al. 2010a; Park et al. 2011; Wang and Lan 2011) as long as there was sufficient C supply. In such conditions, algae stores excess of P (Wang et al. 2010a,b) as polyphosphates through luxury P uptake (Aitchison and Butt 1973; Powell et al. 2008).
The FTIR assignments of bands to the spectra reveal high carbohydrate and protein peaks during the initial phase of the culture (Fig. 7). Enhanced Lipid/Amide (L/P) ratio at the stationary phase illustrate an increase in lipid content with a decrease in protein content, which correlates with the total lipid content during day 2 of the culture (Fig. 8). Decline of Lipid/Amide (L/P) ratio after day 3 corroborates with the increase in the Carbohydrate/Amide (C/P) ratio from day 4 to 5. In the present experiment the L/P ratio increased from 0.02 to 0.26 (12 folds increase on day 9), that is relatively higher compared to the earlier studies (Stefast et al. 2005; Dean et al. 2010). Investigations of Phaeodactylum tricornitum under nutrient sufficient conditions and N deplete conditions showed L/P ratio of 0.23 (1.27 fold increase on day 14) and 0.3 (1.2 fold increase on day 26) respectively (Stefast et al. 2005). In contrast, Chlamydomonas reinhardtii and Scenedesmus subspicatus under lower N regimes showed L/P ratio of 1.4 (6.75 fold increase on day 28) and 1.5 (7.1 fold increase on day 15) (Dean et al. 2011). Pediastrum duplex under natural conditions showed L/P ratio of 0.2 (Dean et al. 2012).
Carbohydrate/Amide ratio showed a peak on day 5 of the culture (Fig. 10), indicating increased polysaccharides content in the biomass due to rapid TOC assimilation (from day 2 to 6 in the culture). Lower C/P ratio initially is attributed to an increase in the protein content in the cells relative to carbohydrates with the increase in biomass densities. Enhanced C/P ratio shows potential N limitations that would have triggered the lipid synthesis (Dean et al, 2011). In the present experiment, there was an increase in C/P ratio from 0.94 to 2.41 (2.56 folds increase on day 5). However studies on P tricornitum under nutrient sufficient and N deplete conditions showed C/P ratio of 0.8 (1.14 fold increase on day 14) and 0.3 (2.42 fold increase on day 26) respectively and a 6.7 fold increase in Microcystis auregonosa and 3.5 fold increase in Chroococcus minutus (Stefast et al. 2005). Chlamydomonas reinhardtii and Scenedesmus subspicatus under lower N regimes showed a C/P ratio of 2.4 (9.6 fold increase on day 10) and 1.5 (3.75 fold increase day 10) respectively (Dean et al, 2011). Pediastrum duplex under natural conditions showed C/P ratio of 0.6 (Dean et al. 2012).
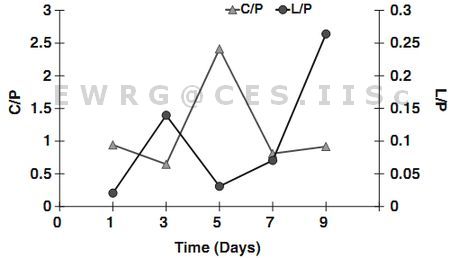
Fig. 10: Changes in the Carbohydrate/Amide ratio and Lipid/Amide ratio of Euglena sp.
Lipid content of Euglena sp. was 24.6% (Fig.8) and there are few studies on lipid quantification of Euglena sp. During 1960s studies were focussed on physiology, photosynthetic ability and lipid biosynthesis of Euglena gracilis (Rosenberg 1963). It has been reported that due to their heterotrophic nature, Euglena sp. can assimilate more soluble C from solutions and can accumulate lipids faster than other algae in dark (Coleman et al. 1988). Regnault et al. (1995) reported lipid accumulation of Euglena gracilis to be independent of NH4-N limitation and C sensitive, which increased in the presence of lactate. Lipid content of Euglena sp. suddenly increased on day 2 (Fig. 8) of the culture (Table 3) owing to C fixation into lipids under heterotrophic/mixotrophic mode due to availability of organic Carbon. A possible reason can be alteration in C metabolism due to adaptation to new wastewater conditions (Pittman et al. 2011). Average lipid production in Euglena sp. was 16.15 mg L-1 d-1 and the biomass productivity was 155 mg L-1 d-1. This is comparable to 8-20 mg L-1 d-1 in other algae such as Nannochloropsis oculata and Chlorella vulgaris (Converti, et al., 2009). A very high lipid productivity of 505 mg L-1 d-1 was reported from Chlamydomonas reinhardtii (bio-coil) in concentrated wastewater with the biomass productivity of 2 g L-1 d-1 (Kong et al. 2010). Lipid production of 24 mg L-1 d-1 was obtained in a semi-continuos mode growing polyculture of Chlorella sp., Micracitinium sp. and Actinastrum sp. (Woertz et al. 2009). Euglena sp. grown in continuous systems would help in treating domestic wastewater while providing biofuel and ensuring the sustenance of energy at decentralised levels.
Culture condition does play a vital role in determining the quality and quantity of lipids in algae (Solovchenko et al. 2008). The quality of biofuel depends on the composition of methyl esters in lipids in addition to the structural characteristics like chain length, degree of saturation (Griffiths and Harrison 2009). There were thirteen different fatty acids identified in the FAME mixture extracted from Euglena sp. grown in domestic wastewaters, among which palmitic acid (C16:0), linolenic acid (C18:3) and linoleic acid (C18:2) are the abundant fatty acids (Fig. 9). The percentage composition of each fatty acid with their time of retention is provided in Table 4. It has been observed that vegetative oil that has good biofuel properties as linseed, rape seed etc. mostly contain C18 fatty acids comprising of stearic, oleic, linoleic and linolenic acids (Lang et al. 2001). The lipid profile shows a dominance of C16 (42%) and C18 (50%) methyl esters, emphasising that the lipids produced from Euglena sp. are similar to vegetative oil and have good biofuel properties. Lipids with the larger share of palmitate and oleate contents have biofuel properties in terms of ignition, better oxidative stability and lubrication (Knothe 2005). PUFA content of 46% observed in the present study, could lead to susceptibility to oxidation (instability) during storage (Cecilia et al. 2011), requiring a partial catalytic hydrogenation for stability and to be used as biodiesel (Dijkstra 2006). Euglena gracilis cells grown heterotrophically showed FAME comprised of C18:3(31%) > C16:0(25.2%) > C16:4(14.8%) > C18:0 (7%) with a total lipid content of 27.2% (Constantopoulos and Bloch 1967). Similar work on municipal wastewaters algae showed FAME consisting of C18:3>C16:1>C16:0 (Strum et al. 2012) and Chlorella pyrenoidesa with FAME C18:3(40%)>C16:0(16%)>C18:2(18%)> C16:2(8.5%) had 21% lipid (D’Oca et al. 2011). The environmental variables like light play a key role in deciding the composition of fatty acids (Su et al. 2011) that is evident from a relatively higher saturated fatty acids (SFA) compared to poly-unsaturated fatty acids (PUFA) and mono unsaturated fatty acids (MUFA) when exposed to high intensities of sunlight and longer dark periods. This is contrary to the reduced PUFA when exposed to high light intensities (Sefabadi et al. 2011). Isochysis galbana showed high SFA accumulation during the day and PUFA accumulation in the night (Zhu et al. 1997). The percentage FAME within C16-C18 was ~97% in the present study. The lipid class important from biofuel prospects indicate that C16-C18 are essential fatty acid with the desirable biofuel properties such as palmitic, stearic, oleic and linolenic acids (Knothe 2005, 2008). It has been reported that presence of high amount of saturates imparts relatively poor cold flow properties to the fuel (Chiu et al. 2004). In the present FAME study, the percentage of saturated fatty acids were relatively high compared to PUFA with the major share of essential fatty acids.
Table 4: Percentage Composition of FAME with the retention time in columns
| C N:U |
Fatty Acid Methyl Ester (FAME) Composition |
Retention Time |
Corr. % Max |
% FAME |
| C 12:0 |
Dodecanoic acid methyl ester |
19.023 |
0.1 |
0.043 |
| C 14:0 |
Methyl tetradecanoate |
25.274 |
3.33 |
1.399 |
| C 15:0 |
Pentadecanoic acid methyl ester |
28.529 |
0.27 |
0.113 |
| C 16:0 |
Hexadecanoic acid methyl ester |
31.83 |
100 |
42.051 |
| C 16:1 (9) |
9-Hexadecenoic acid methyl ester |
31.038 |
7.98 |
3.357 |
| C 17:0 |
Heptadecanoic acid methyl ester |
34.84 |
0.25 |
0.106 |
| C 18:0 |
Octadecanoic acid methyl ester |
37.859 |
8.76 |
3.682 |
| C 18:1(11) |
11-Octadecenoic acid, methyl ester |
37.238 |
2.6 |
1.093 |
| C 18:2(9,12) |
9,12-Octadecadienoicacid methyl ester |
36.917 |
52.84 |
22.22 |
| C 18:3(6, 9,12) |
6,9,12-Octadecatrienoicacid methyl ester |
36.352 |
3.48 |
1.465 |
| C 18:3(9,12,15) |
9,12,15-Octadecatrienoic acid methyl ester |
37.131 |
54.46 |
22.979 |
| C 20:0 |
Docosanoic acid methyl ester |
48.817 |
0.43 |
0.179 |
| C 24:0 |
Tetracosanoic acid methyl ester |
51.964 |
3.12 |
1.31 |
| |
|
|
|
100 |
| Saturated fatty acids (Saturates) |
48.886 |
| Monoenoic fatty acids (Mono-unsaturated fatty acids) |
4.45 |
| Polyenoic fatty acids (Poly-unsaturated fatty acids) |
46.664 |
| Total Unsaturated fatty acids |
51.114 |
| C16-C18 (fatty acids important from Bio-diesel perspective) |
96.953 |
| Max Total Lipid Content |
24.6 |
|
