Demography and economy |
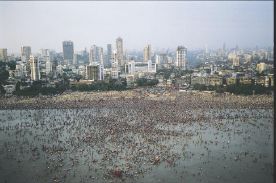
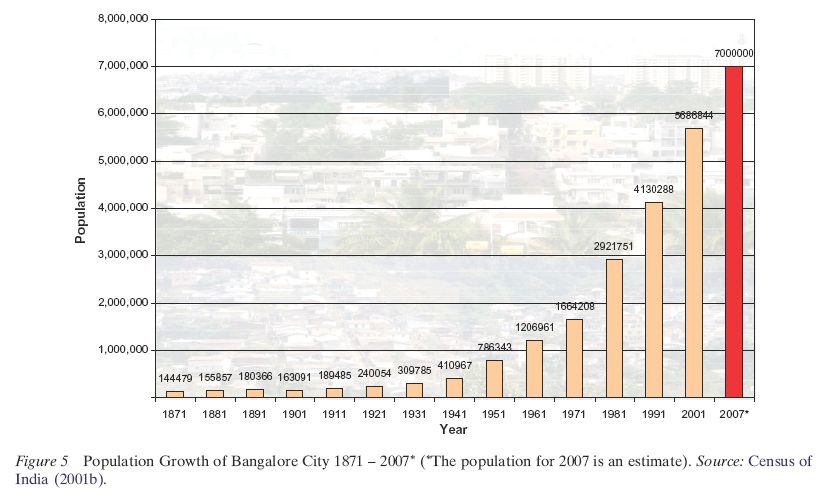
The state of Karnataka was carved out in 1956 based on linguistic boundaries, with regions dominated by Kannada speaking people. Bangalore was retained as the capital of the state, with Kannada as the official language while accommodating other languages like Tamil, Telugu, Malayalam, English and Hindi, true to its cosmopolitan status. The census of population in Bangalore has been recorded every decade since 1871, during the colonial times, the most recent census being carried out in 2001. Figure 5 shows the growth of population in Bangalore from 1871 to 2001 (5.7 million), along with an estimate for 2007 (7 million). It is notable that since the first census, Bangalore was already the most populous city in Karnataka. This urban primacy has been retained consistently for more than a century now. After Independence, Bangalore, now a State capital, saw an influx of population migrating to the city, although it should be noted that the steep population rise in the decade 19411951, while due in part to this migration, also reflects the amalgamation of Bangalore Civil and Military Station Municipality with the then Bangalore City Corporation. Population growth during the 1970s could be ascribed to numerous public sector industries and other defence establishments that came up during the period and fuelled significant immigration. By this time, incidentally, Bangalore had lost its tag of Pensioners Paradise, gained before Independence. Although the advent of IT is attributed to the late 1980s, major growth and expansion of this industry happened only during the late 1990s. Still, population growth in Bangalore in the last census decade, 19912001 (38%), was substantially less than in 19711981 (76%). Nevertheless, the physical growth of the city has been phenomenal over the last few years, and the glaring evidence of this is increased travel-times and the escalating real-estate prices.
According to the latest census (Census of India, 2001a), the urban agglomeration had an overall population in 2001 of 5.7 million, including a workforce of 2.2 million, within an area of 560 km2, and a literacy rate of 75.1%. The hype over the IT industry is underlain by Bangalore having about 30% of all IT workforce in the country and a personal disposable income greater than the Indian city average. This has also resulted in a trickle down effect within the urban economy. Further, investments in industries (not only IT), infrastructure and other services, have signifi- cantly increased purchasing power among the people and have nurtured real estate with consequent land market dynamics, apart from creating numerous secondary employment in services. Interestingly enough, of the 5.7 million population in the urban agglomeration in 2001, about 2 million were migrants (Census of India, 2001b). About 1.2 million of these were from Karnataka state, mainly from the rural parts, while the remaining 0.8 million were from outside the state, the majority of these from urban areas. It is further noted that people have migrated chiefly for employment or moved with household or for education. The large number of migrant population from other parts of India explains the multitude of languages spoken and understood in Bangalore.
Bangalore is home to numerous high-tech knowledge hubs evident from the establishment of premier centres like Indian Institute of Science (IISc), National Institute of Advanced Studies (NIAS), Tata Institute for Fundamental Research (TIFR), Jawaharlal Nehru Centre for Advanced Scientific Research (JNCASR), Indian Space Research Organisation (ISRO), National Aerospace Laboratories (NAL), Defence Research and Development Organisation (DRDO), Indian Institute of Management (IIM), Institute for Social and Economic Change (ISEC), Indian Institute of Information Technology (IIIT) and several professional engineering and medical colleges at undergraduate and graduate levels. In tune with recent trends, Bangalore now has numerous malls and multiplexes that are swarmed during weekends. With an active night life and Bangaloreans penchant for fast-food, a large number of restaurants, pubs and eat-outs throng the city.
The economic fabric of the city, although at times masked by the IT-based industries is varied, being also characterised by textile, automobile, machine tool, aviation, space,defence, and biotechnology based industries. In addition, numerous services, trade and banking activities mark the citys economic landscape. An important feature of the economic activities of Bangalore is the huge concentration of Small and Medium Enterprises (SMEs) in diversified sectors across the city. Bangalore has more than 20 industrial estates/areas comprising large, medium and small enterprises. Of these, Peenya Industrial Estate located in the northern part of the city comprises about 4000 SMEs and is considered the largest industrial estate in South and South East Asia (PIA, 2003). A majority of the SMEs function as ancillaries/subcontractors to large enterprises in the field of engineering and electronics industries, among others. The industrial estates sprung up mostly in the periphery of the erstwhile city and gradually as the city grew became part of its sprawl. Notable among these are the Peenya Industrial Estate just mentioned, Electronic City and Whitefield (Figure 1). The proliferation of SMEs in residential and commercial areas, in addition to the industrial areas, has added to the chaos and congestion in the city. Thus, the thriving economy of the city has resulted with a net district (7)income of Rs. 262,592 million (approx. US $ 5.8 billion) and a per capita income of Rs. 39,420, a little more than twice the States average per capita income of Rs. 18,360 (Government of Karnataka, 2005).
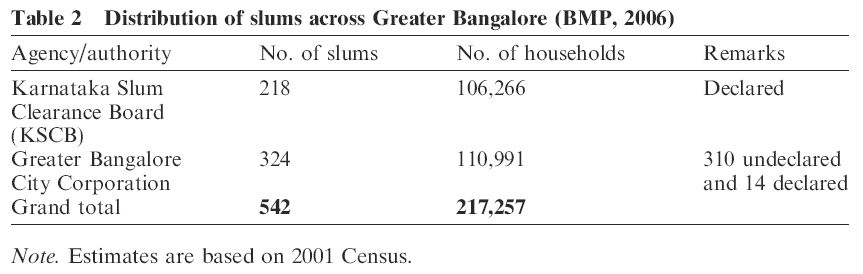
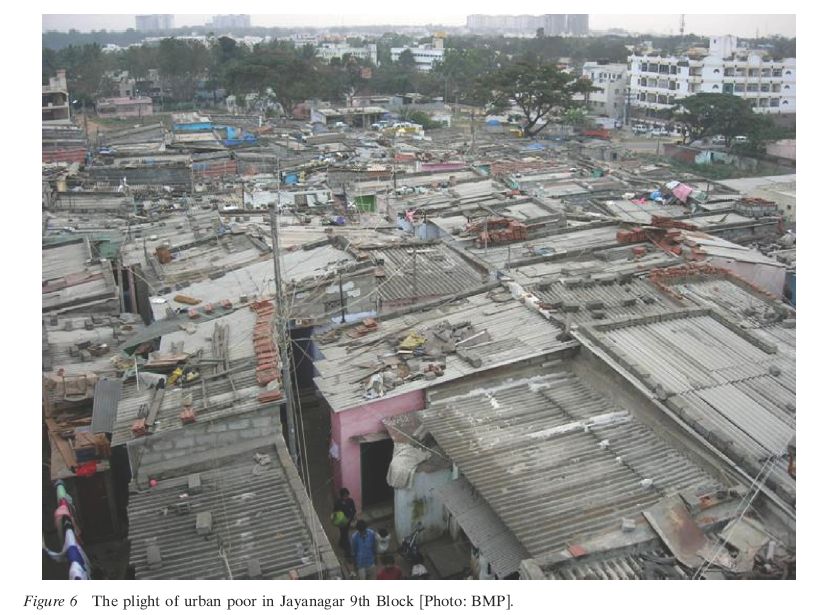
Despite higher per capita income within the urban district than in the rest of the State, and with significant migrant population, the number of urban poor has been on the rise and the slum settlements in the city have not been contained. The escalating costs of land prices coupled with rise in cost of living has pushed the urban poor to reside in squatter settlements with inadequate amenities and services (Figure 6). Some of these settlements have speckled the citys landscape garnering immediate action from civic authorities. According to Bangalore Mahanagara Palike (2006), the number of households in the urban agglomeration defined as poor was 0.22 million, housing approximately 1.1 million people out of 5.7 million population (Table 2). Noting the importance of the matter, the State Government has set up a special agency, Karnataka Slum Clearance Board(KSCB)8specifically to address the redevelopment of slums in partnership with various stakeholders like the Housing Board, Local Bodies, Water Supply Boards, etc. The initiatives taken up by the local body addressing redevelopment of slums are are noted below in the subsection on Issues in Planning and Development.
(7) In the Indian federal system, each state is divided into districts (which are further divided into taluks) for administrative purposes, including decentralised implementation of developmental programmes. The State of Karnataka has 27 districts, of which Bangalore Urban is one, comprising Bangalore East, Bangalore South and Anekal Taluks. Taluk boundaries dissect the city and extend beyond the Bangalore Metropolitan Area. Thus the net district income refers to the entire district and not to the city alone.
(8) Karnataka Slum Clearance Board is responsible for slum improvement, clearance and rehabilitation of the slum dwellers.