 |
Urbanization in India: Patterns,Visualization of Cities, and Greenhouse Gas Inventory for Developing Urban Observatory
|
 |
aRCGSIDM, Indian Institute of Technology Kharagpur, West Bengal, India bEnergy and Wetland Research Group, Centre for Ecological Science, Indian Institute of Science, Karnataka, India
*Corresponding author: bhaithal@iitkgp.ac.in
Study Area and Data
This chapter aims to study five mega cities in India: Mumbai, Delhi, Kolkata, Chennai, and Bangalore, as shown in Figure 7.1. Table 7.1 shows latitude and longitude, population as per the year 2011 census, and metropolitan area spread of these mega cities.
Mumbai, named after the goddess Mumbadevi, has a rich history, and it has been referred to as Bombay province until 1955. The city is located along the west coastline of India. This region has undergone continuous land use change, mainly by reshaping under the Hornby Vellard project, in which the key objective was to merge several islands from the sea. Mumbai has a deep natural harbor, which serves as a significant access point to the Indian subcontinent through many European and Middle Eastern countries and hence getting the nickname “Gateway of India.” Mumbai is the most populous city in India and is the ninth most populous urban agglomeration in the world. The Mumbai metropolitan region is composed of three complete districts, Mumbai city, Mumbai suburban, and Thane, and two partial districts, Palghar and Raigad. Because of its unique air, road, rail, and water transportation network Mumbai ranked first in commerce and industries by contributing 6.16% of India’s gross domestic product. Mumbai enjoys a tropical dry and wet climate with an average annual precipitation of 2167 mm.
Delhi is the capital city and also a union territory of India, located at the northern part of the country, and stands on the west bank of river Yamuna. Delhi is surrounded by two states, namely, Haryana and Uttar Pradesh. With a population of 16,314,838 (Census 2011), Delhi is the second most populous urban agglomeration in India. Delhi and its adjoining urban region have been given the special status of National Capital Region under the Constitution of India’s 69th Amendment Act of 1991. The Delhi metropolitan area consists of five municipal corporations: North Delhi Municipal Corporation, South Delhi Municipal Corporation, East Delhi Municipal Corporation, New Delhi Municipal Corporation, and Delhi Cantonment Board. Various historical monuments, such as Qutub Minar, Humayun’s tomb, Iron Pillar, and Red Fort, and political places of interest, such as Rashtrapati Bhavan, the Parliament House, the Supreme Court of India, the Cabinet Secretariat, and the Reserve Bank of India, are located in the central business district of New Delhi. The Delhi region has excellent railway, metro, and road connectivity such as the 28-km Delhi–Gurgaon Expressway, National Highway-1 connecting Delhi and Attari (near the Pakistan border), and National Highway-2 connecting Delhi and Kolkata (one of the busiest routes covering four states in between). Culture, history, and tourism, on one hand, and politics, economy, utility services, and transport, on the other hand, have made Delhi the second highest populated mega city next to Mumbai.
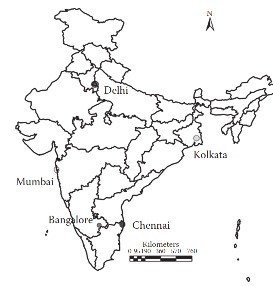
Figure 7.1 Location Details of Mega Cities.
| Mega City |
Latitude |
Longitude |
Population (Census 2011) |
Area (km2) |
| Mumbai |
18.97 |
72.82 |
18,414,288 |
4355 |
| Delhi |
28.61 |
77.23 |
16,314,838 |
1484 |
| Kolkata |
22.56 |
88.36 |
14,112,536 |
1886 |
| Chennai |
13.08 |
80.26 |
8,696,010 |
1189 |
| Bangalore |
12.96 |
77.56 |
8,499,399 |
741 |
Table 7.1 Location, Demographic, and Area Details of Mega Cities
Kolkata is situated in the eastern part of India, and it is the capital city of West Bengal state. Much of Kolkata’s development happened during the British rule during the late 1870s to 1910s. The region also served as the capital for British-held territories in India until 1911. With the increase in population from 9,194,000 in 1981 to 14,112,536 in 2011, Kolkata is the third most populous metropolitan city in India after Mumbai and Delhi. Kolkata is situated on the delta of River Ganga along the east bank of the Hoogly River, near Bay of Bengal. Majority of the landscape within the region was originally wetland, which has been consistently decreasing because of the unprecedented increase in population. The Kolkata Metropolitan Area (KMA) consists of four municipal corporations and 36 municipalities.The city has a rich culture and, unlike other cities n ndia, shows extreme passion for sports, especially football, hich tends to attract a large number of tourists throughout the year. Kolkata is also known for its education sector, IT sector, banking sector, and heavy-scale industries. The city has completely taken advantage of the Port of Kolkata, which is one of the oldest operating ports in India, to export various consignments to other parts of the world.
Chennai is the capital city of the Tamil Nadu state. It is located at the eastern coast—Coromandel Coast, popularly known as the “Gateway to South India.” It is one of the major metropolitan cities in India and has been one of the favorite destinations for tourism, industries, education, culture, and commerce. Chennai, which has a wide range of automobile industries, is famously called “Detroit of India” and is located in between two major rivers (i.e., Cooum and Adyar). Chennai has a tropical wet and dry climate with temperatures ranging from 15°C to 40°C. The jurisdiction of the Chennai (city) Corporation was expanded from 174 to 426 km in 2011. The Chennai Metropolitan Area (CMA) has an area of 1189 km comprising the hennai city district and partially extending to two districts, Kancheepuram and Tiruvallur. Chennai is presently the fourth most populous city in India. The population of Chennai City has increased steeply from 4.34 million (2001) to 4.68 million (2011), whereas the CMA population shows an increase of 1.86 million based on the 2001 and 2011 census.
Bangalore is located in the southern part of India with an elevation of 900 m from the mean sea level. The city has been the capital of the Karnataka state since 1956. In 2006, the city administrative jurisdiction was expanded (known as Greater Bangalore) by merging existing city limits, eight urban local bodies, and 111 villages of the Bangalore urban district (Ramachandra and Kumar 2008). The city is located on a ridge and has numerous planned lakes (for storing water) that are interconnected and drain out to rivers from the three watersheds: Hebbal, Kormangala-Chellaghatta, and Vrishabhavathi (Ramachandra et al. 2015a). Bangalore was once called “Garden City” because of its lush green vegetation and large number of parks such as Lalbagh and Cubbon Park. After 2000, Bangalore experienced a huge population increase because of the establishment of a large number of information technology companies (the city has the nickname “Silicon Valley”). The city also houses public sector industries such as Bharat Electronics Limited, Hindustan Aeronautics Limited, National Aerospace Laboratories, Bharat Heavy Electricals Limited, and Bharat Earth Movers Limited. Because of the city’s excellent transportation network and other infrastructure facilities, Bangalore is ranked third most productive metropolitan area of India.
Administrative boundaries of all mega cities were obtained from topographic maps or toposheets provided by Survey of India. The toposheets were geo-referenced and projected to respective Universal Transverse Mercator (UTM) zones. Bhuvan was used to supplement along with toposheets to ensure and delineate base layers such as administrative boundary, road and rail network, and drainage network. Each study area includes a 10-km buffer (from the administrative boundary centroid) to analyze and account for the land use changes in the future. Data collection involved obtaining ground control points (GCPs) using Global Positioning System (GPS). Bhuvan and Google Earth interfaces were used to collect data from remote areas and restricted areas where manual GPS data collection was not possible. They were also used to collect data in the form of points, lines, and polygons of industries, IT companies, educational institutes, healthcare units, road network, railway network, natural drainage network, restricted area, ecologically sensitive areas, coastal zones, and so on.
Satellite data starting from early 2000 to 2015 depending on availability were obtained from the US Geological Survey public domain website (https://earthexplorer .usgs.gov), which is available for free. Landsat 4, 5 (TM), 7 (ETM+), and 8 (OLITIRS) data were used for the analysis with a spatial resolution of 30 m. IRS LISS-III data were obtained from NRSC in case of missing Landsat data, with a spatial resolution of 23.5 m. GCPs were used to geo-register the satellite imageries to reduce any kind of discrepancy of temporal data.
Citation : Bharath Haridas Aithal, Mysore Chandrashekar Chandan, Shivamurthy Vinay, T.V. Ramachandra, 2018, Urbanization in India: Patterns, Visualization of Cities, and Greenhouse Gas Inventory for Developing Urban Observatory. CRC Press Taylor & Francis Group 6000 Broken Sound Parkway NW, Suite 300 Boca Raton, FL 33487-2742 © 2018 by Taylor & Francis Group, LLC CRC Press is an imprint of Taylor & Francis Group, an Informa business.
| * Corresponding Author : |
|
Bharath Haridas Aithal
RCGSIDM, Indian Institute of Technology Kharagpur, West Bengal, India
Energy and Wetland Research Group, Centre for Ecological Science, Indian Institute of Science, Karnataka, India
E-mail : bhaithal@iitkgp.ac.in |
|
|
Bharath Haridas Aithal
aRCGSIDM, Indian Institute of Technology Kharagpur, West Bengal, India
bEnergy and Wetland Research Group, Centre for Ecological Science, Indian Institute of Science, Karnataka, India
* Corresponding Author
E-mail : bhaithal@iitkgp.ac.in
Mysore Chandrashekar Chandan
aRCGSIDM, Indian Institute of Technology Kharagpur, West Bengal, India
Citation:Bharath Haridas Aithal, Mysore Chandrashekar Chandan, Shivamurthy Vinay, T.V. Ramachandra, 2018, Urbanization in India: Patterns, Visualization of Cities, and Greenhouse Gas Inventory for Developing Urban Observatory. CRC Press Taylor & Francis Group 6000 Broken Sound Parkway NW, Suite 300 Boca Raton, FL 33487-2742 © 2018 by Taylor & Francis Group, LLC CRC Press is an imprint of Taylor & Francis Group, an Informa business.
Shivamurthy Vinay
bEnergy and Wetland Research Group, Centre for Ecological Science, Indian Institute of Science, Karnataka, India
|