URBAN FOOTPRINT OF MUMBAI - THE COMMERCIAL CAPITAL OF INDIA

Ramachandra. T.V 1,2,3,*, Bharath H. Aithal2, Sowmyashree M.V1
1Energy & Wetlands Research Group, Center for Ecological Sciences [CES]
2Centre for Sustainable Technologies (astra)
3Centre for infrastructure, Sustainable Transportation and Urban Planning [CiSTUP] Indian Institute of Science, Bangalore, Karnataka, 560 012, India
*Corresponding Author: cestvr@ces.iisc.ernet.in

Citation: Ramachandra T. V., Bharath H. A. and Sowmyashree M. V., 2014. Urban footprint of Mumbai - the commercial capital of India, Journal of Urban and Regional Analysis, VI (1): 71– 94

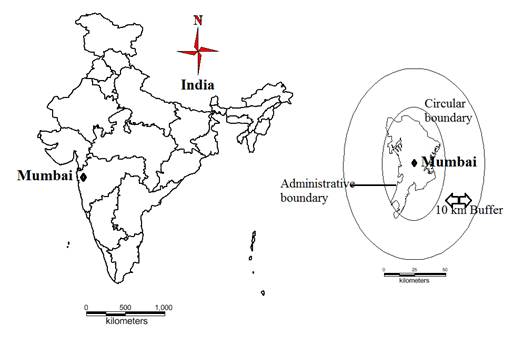
Study Area

Mumbai is the capital of the Indian state of Maharashtra. It is located at 18°55’N and 72°50’ E and is bounded by the Arabian Sea in the west. It is the most populous city in India, and the sixth most populous city in the world and it is also considered as the commercial capital of India that serves as an economic hub of India. In the last three decades, the city saw tremendous growth in the infrastructure development and urban expansion. Mumbai has a population density of 4583 persons per square kilometre (Census, 2001). Mumbai urban agglomeration is ranked third after Tokyo and Mexico City (United Nations, 2012). The city started experiencing urbanization and industrial expansion during 1860s, which gradually led to the rise of more urban areas. Mumbai is formed of seven islands and the expansion of Mumbai resulted in the bulging of the islands causing a scarcity of land. The study has been carried out for Mumbai city considering a 10 km buffer. Figure 1 below shows the Mumbai administrative boundary along with the 10 km buffer.


Figure 1:  Study area - Mumbai with 10km buffer


Figure 2: Temporal population since 1901 (Source: census of India).


2.1 Demography and Economy
Mumbai is the most populous city and a cosmopolitan megacity of India. It is also considered as the business capital of India because of large trading activities. According to 2011 census, the Mumbai population was about 12 million (Census, 2011). Figure 2 depicts the temporal decadal population since 1901. Table1 lists the geographical area, population and population density during the past four decades. In the beginning of 1990, the city experienced a major growth in the development of manufacturing industries and service sector industries such finance, mass media, communication and information technologies and real estate and property development sectors (Pacione, 2006). The GDP per capita is 43 which is higher than other cities (PIB, 2013, United Nations, 2012).


City

Area
(sq.kms.)

Year

Population (lakhs)

Population Density
(Persons per sq.km.)


Mumbai


3571.05

1971

5970575

1671

1981

8243405

2308

1991

9925891

2780

2001

11914398

3336

2011

12478447

3494

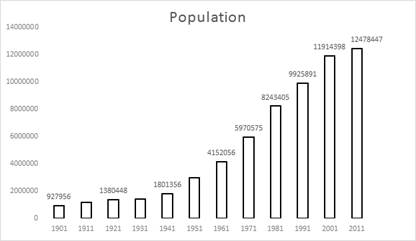
Table1:  Area, Population and Population density of Mumbai (Source: Census India: 1971-2011)

2.2  Urban Development Planning and Infrastructure
The urbanisation process in Mumbai has led to the expansion of the city and provision of many industries resulted in a large scale migration. The city planning development process is controlled by the town planning departments and Urban Development Authority. The Greater Mumbai Municipal Corporation also known as Brihat Mumbai Municipal Corporation (BMMC) is one of the most affluent civic bodies in the country and covers an area of 4,355 km2 (Neelima, 2003). Mumbai Metropolitan Region Development Authority (MMRDA) was setup in 1975 under the Mumbai Metropolitan Region Development Authority Act, which is responsible for the planning and development activities in the Mumbai region (Neelima, 2003).


* Corresponding Author :
  Dr. T.V. Ramachandra
Energy & Wetlands Research Group, Centre for Ecological Sciences, Indian Institute of Science, Bangalore – 560 012, INDIA.
  Tel : 91-80-23600985 / 22932506 / 22933099,
Fax : 91-80-23601428 / 23600085 / 23600683 [CES-TVR]
E-mail : cestvr@ces.iisc.ernet.in, energy@ces.iisc.ernet.in,
Web : http://wgbis.ces.iisc.ernet.in/energy