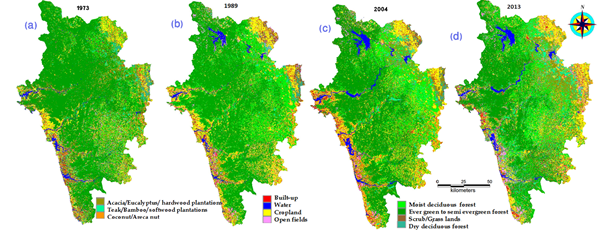
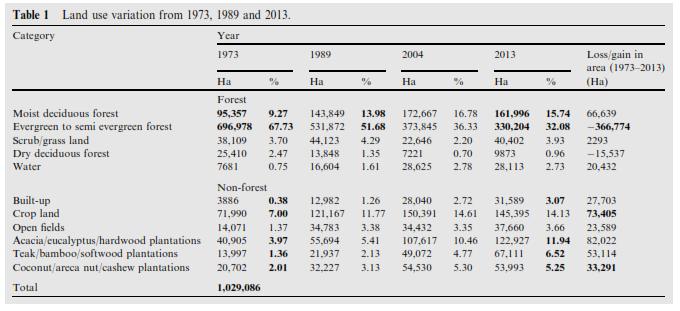
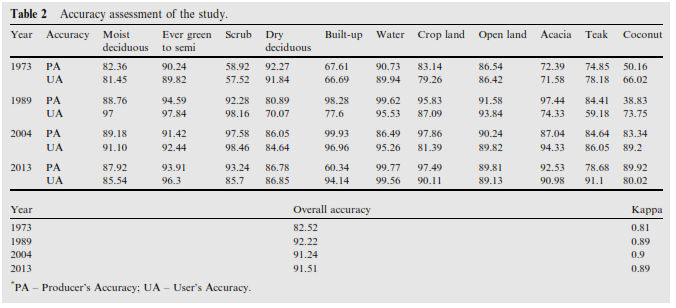
Temporal remote sensing data were classified into eleven land use categories and Table 1 lists land use details during 1973 to 2013 and is depicted in Figure 3 (a, b, c). Comparative assessment of land use categories reveals the decline of vegetation cover in the district during 1973 to 2013. Unplanned developmental activities coupled with the enhanced agriculture and horticultural activities have aided as prime drivers of deforestation. The reduction of area under evergreen forests from 67.73% (1973) to 32.09% (2013) due to anthropogenic activities involving the conversion of forest land to agricultural and horticultural activities, monoculture plantations and land releases for developmental projects. Transition of evergreen-semi evergreen forests to moist deciduous forests, and some have been converted into forest plantations (such as Teak, Acacia spp., etc.). Enhanced agricultural activities is evident from the increase of agricultural land use from 7.00 (1973) to 14.13 % (2013) and the area under human habitations have increased during the last four decades, evident from the increase of built-up area from 0.38% (1973) to 3.07% (2013). The increase in plantation of exotic species (Acacia auriculiformis, Casuarina equisetifolia, Eucalyptus spp., and Tectona grandis) has led to the removal of forest cover and also extinctions of species. The dry deciduous forest cover is very less (0.96%) and is found mainly in the north eastern part of the district in Mundgod taluk and partly Haliyal taluk. The areas of each category were also compared with available administrative reports, statistical department data and forest division annual reports. The accuracy of classifications (Table 2), verified using field data and online data (Google earth, Bhuvan). Accuracy of the classification ranges as 82.52, 92.22 and 91.59% with more consistent results.
4.2 Developmental projects and their impacts on the forest ecosystem
The major developmental projects with buffer region in the district are listed in Figure 4 (marked on Google Earth image of the district) and spatio temporal analysis is done to understand LULC changes with the implementation of developmental projects. District falls in three agro climatic zones namely coast, Sahyadri interior and plains. Specific projects, which are expressive of unplanned implementations in each zone were chosen for the change analysis. Developmental projects include Sea Bird, Gerusoppa dam in the coastal zone, Supa dam, Kadra dam, Kaiga NPH in Sahyadri, West coast paper mill, Tattihalla reservoir in plains. The impacts of these projects are discussed in the next section.
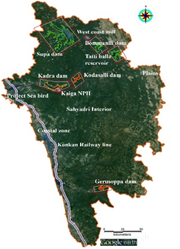
Figure 4 The major developmental projects of Uttara Kannada district à
4.2.1 Project Sea Bird
Indian Navy established Asia’s largest Naval Base at Karwar, about 120 km south of Goa on the west coast of India under ‘Project Seabird’ also known as ‘INS Kadamba’ in 1986, for creation of infrastructure and facilities for the basing of ships/ submarines, with all associated operational/support facilities (http://indiannavy.nic.in). Phase I of Project Seabird has been completed in 2005, spread over an area of 45 square kilometres with a 26km-long coastline, which is 5.5 km of breakwaters, reclaimed areas for development of ship lift and berthing facilities, aircraft carrier berthing facilities, large onshore developments with residential complexes, admin facilities etc. The construction of Project Seabird Naval Base involved eviction of thousands of families of fishermen and farmers from the coastline of Karwar and Ankola taluks. Environmental modifications of great magnitude, such as building of breakwaters, dredging of the sea, filling up of coastal swamps, intensified construction activities and other landscape changes are being executed in the Project Seabird area. Project Seabird Phase IIA commissioned in 2011 involved the construction of a wide range of new facilities and augmentation of certain existing facilities which spans 4 km over 50 Ha land. Land use in the project Seabird region (Table 3 and Figure 5) shows an increase of built-up area from 1.77% (1973) to 32.09% (2013) due to marine ship basements and port construction. Evergreen forests have declined from 34.63 (1973) to 5.22% (2013). The rehabilitation of the evacuees brought greater pressure in other coastal villages as well as in the forest areas of hinterland. The built-up area with in 1km buffer constitute about 21.09% in 2013.
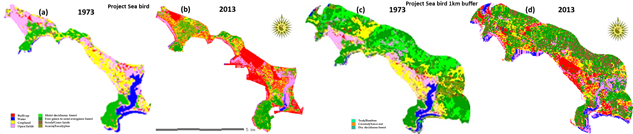
Figure 5 (a, b, c, d) Temporal change inland use by Sea bird project
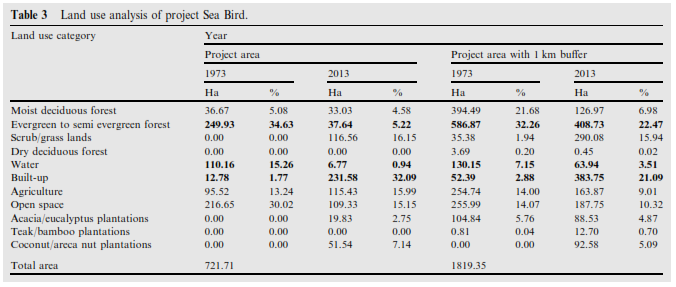
Table 3 Land use analysis of Project Sea Bird à
4.2.2 Supa dam
Supa Dam is the second largest dam in the state of Karnataka, built across the Kali river (101 m high and 332 m long concrete gravity dam) in Supa (Joida) taluk for power generation (http://karnatkapower.com/portfolio/supa-dam/). This submerged more than 24 villages with acquisition of 10,692 hectares of forest land, 2,248 hectares of private land and 466 hectares of revenue land totalling 13,406 hectares. The construction started in 1974 and ended in 1987 has a catchment area of 1057 km2 and the live storage-capacity is 145 Tmcft. (Thousand million cubic feet). The power house was commissioned in 1985. Refugee settlement of this project was established at a place called Ramanagar near Londa on the border of Belgaum and Uttara Kannada districts of Karnataka. This tract of land was earlier under reserved forests, and was taken over for resettlement around 1975. At the time of' handing over, the entire vegetation (including fully grown trees) was removed, and the land was allowed to lie fallow without the institution of any soil conservation measures at least till 1989. Land use analysis of Supa hydroelectric dam with buffer shows execution of dam has submerged thick evergreen forests which covered 94.7% (1973) of region (Figure 6 and Table 4) is reduced to 42.79%. The evergreen forest in 1km buffer of project area declined from 94.55% (1973) to 49.02% (2013). The land use analyses for the period 1973 and 2013 illustrate the increase in built-up area (human habitations) from 0.03% to 0.12% with the implementation of the project. The built-up area has increased in project area. Many small agglomerations for work force colonies can be seen in the buffer region. The agriculture activities in the fringes of the reservoir have increased. The construction of this reservoir has altered the hydrologic regime evident from the conversion of perennial streams to seasonal one affecting the agriculture and horticulture activities.
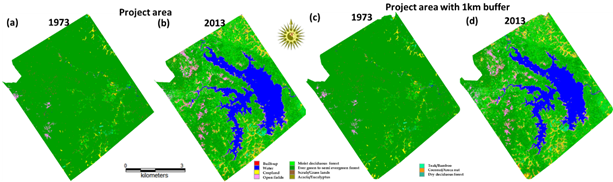
Figure 6 (a, b, c, d) Land use analysis of Supa dam from 1973-2013
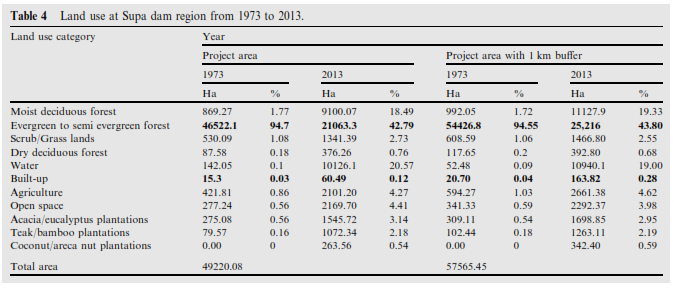
Table 4 Land use at Supa dam region from 1973 to 2013 à
4.2.3 Kadra dam
Kadra power house commissioned in 1997, was built on the left bank of the river Kali with an installed capacity of 150 MW. Kadra dam and power house construction work has started in February 1986 and the project was to finish by 1997 but completed in 2000 (http://karnatakapower.com/portfolio/kadra-dam-power-house/). The power house integrates three 50 MW turbines which are coupled to the generating units. The annual generation is 570 MU. The Kadra Dam is an integral part of the Kaiga Nuclear Power House (NPH) project, provides adequate water to meet the total plant water requirement. Due to Kaiga NPH activity this region’s aquatic fauna is intensely affected. The plankton diversity showed high sensitivity to elevated temperature, resulting in decreased diversity and similarity indices near the discharge point (Zagar et al., 2006). Land use at Kadra dam (Figure 7 & Table 5) project region and buffer region shows the decline of evergreen forest from 69.92% (1973) to 50.98% (2013). The built-up area is increased from 0.63% (1973) to 1.51% (2013). Similar trends of increase from 0.48% to 2.23% (2013) are noticed in the buffer region due to construction of roads and infrastructure. There is intensive plantation activities observed in 2013 due to higher productivity. The evergreen forest has reached to 47.40% by 2013 at project location with 1km buffer. The evergreen forests are periodically becoming semi evergreen to moist deciduous in vicinity due to other disturbance regimes. The project is within a 5 km radius of the Anshi-Dandeli Wildlife Sanctuary, and has affected the habitat of fauna such as Black Panther, bear, bison, elephants, deer and tiger.
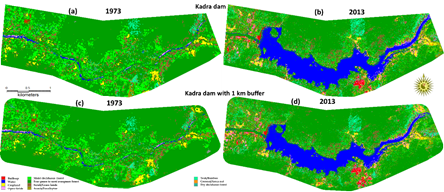
Figure 7 (a, b, c, d) Land use analysis for Kadra dam (1973-2013)
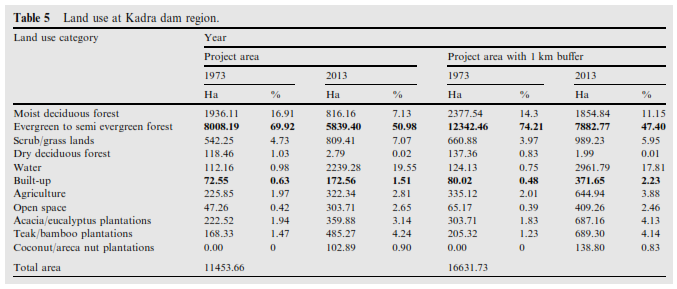
Table 5 Land use at Kadra dam region à
4.2.4 Kaiga Nuclear power house (NPH)
Kaiga NPH generating station located at 14°51′55.16″N 74°26′22.71″E in Kaiga, on the branches of river Kali and the green environs of Western Ghats about 60 Km east of the beach town of Karwar (http://www.npcil.nic.in). It was commissioned in March 2000 by the Nuclear Power Corporation limited (NPCIL) of India with annual generation of 2,231 GWh. Pressurized Heavy Water Reactor (PHWR) is used for producing saturated steam to drive a double stage Turbo Generator. The natural Uranium bundles are used as fuel for the reactors. Biochemical properties of stocked tritium heavy water, the process of cleaning up the spills and recovering the heavy water or flushing it into the environment have induced radiation doses exposing workers and general public to health hazards (Harrison et al., 2002, Ramana et al., 2010). Villagers of Bare, Malavalli, Vajralli and Kalache in Yellapur taluk have reported cancer casesin recent times. The forest land of 732 ha was released for the Kaiga Atomic Energy Plant. The dome of the first reactor unit collapsed in May 1994 delaying its construction by a few more years. In 1999 and again in 2001, people of Sirsi and Yellapur taluks staged a protest against the laying of a high tension power line from Kaiga through the thick forest region. About 677 ha forest lands were cleared for power transmission lines. Now there is a proposal to establish two more units at the site. Earlier studies have demonstrated adverse effect on aquatic diversity due to water discharge from power plant to Kali river (Zargar et al., 2006). LULC analyses of the the region show (Figure 8 and Table 6) evergreen forests have declined from 63.27 (1973) to 21.93% (2013) due to setting up of power house and employee quarters and associated developments (8.91%).
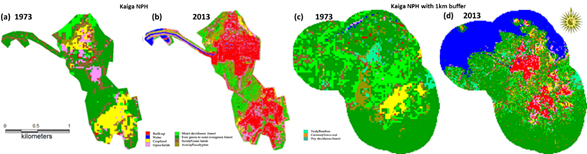
Figure 8 (a, b, c, d) Land use analysis for Kaiga NPH
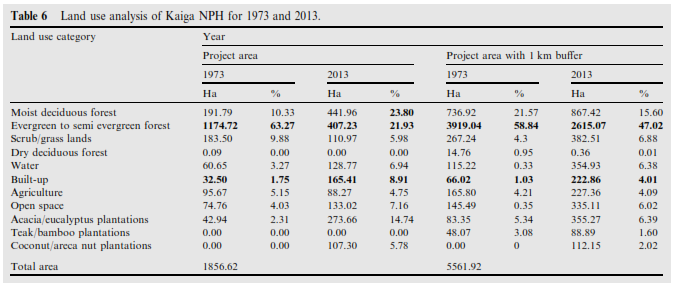
Table 6 Land use analysis of Kaiga NPH for 1973 & 2013
4.2.5 West Coast Paper Mills (WCPM), Dandeli
WCPM was set up in the heart of thick forests on the banks of Kali river with the assured supply of raw materials, water from Kali river, power supply from the state grid. Capacity of the mill was initially 18,000 metric tonnes (MT) per annum of writing, printing and packaging paper (1959), which were augmented to the current production level of 185000 (MT) per annum (http://www.westcoastpaper.com). The present raw material consumption is 400000 (MT) per annum of wood. Bamboo from Uttara Kannada forests was allotted at the rate of Rs. 3.12 per tonne of paper pulp produced, with periodic marginal revision in prices. The extraction limit of bamboo was fixed at 100,000 tonnes of bamboo per year. Bamboo, which was considered almost a weed in the timber forests, by the Forest Department, was nearly eliminated within four decades of the factory’s operations. The depletion of bamboo (“poor man’s timber”) caused great hardships to basket and mat weavers and rural people. LULC analyses (Table 7 and Figure 9) of the region due to the implementation of paper mills show a decline of evergreen forests from 29.46 (1973) to 2.24% (2013). The region is turning to more moist deciduous forest from semi evergreen forest. Built-up has increased from 17.17(1973) to 44.04% in 2013. The mill is promoting eucalyptus plantations in 7689.03 Ha located in nearby plant and villages of Dandeli, which is also evident in land use analysis. Untreated effluents discharged down to Kali river has affected the river, agricultural productivity and groundwater. This is visible as pulp floating in the water and the dark coloured liquid (Krishna Murthy and Bharathi, 1997), which is also confirmed by Central Pollution Control Board (CPCB) in 2003 annual report (Ravi Prasad, 2004).
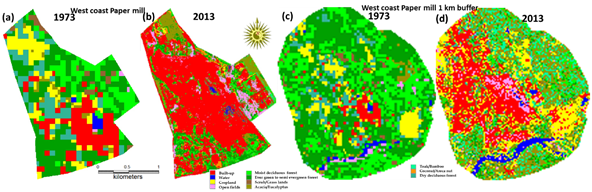
Figure 9 (a, b, c, d) Land use transition by WCPM
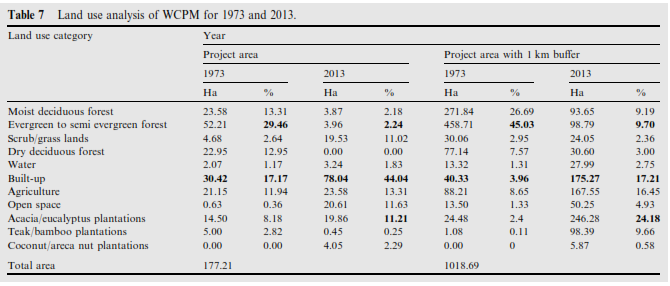
Table 7 Land use analysis of WCPM for 1973 & 2013
The dominant developmental thrust in the district has traditionally favored industrialization and exploitation of natural resources such as forest, land, water were given at free of cost. Some infrastructure developments include the paper mills, the caustic soda factory, the Kali and Sharavathi Hydel projects, the manganese and limestone mining, establishment of a nuclear plant at Kaiga, establishment of a naval base at Karwar, and the Konkan Railway have dramatically altered the structure of fragile ecosystems in the region with long lasting impacts.
4.3 Geo-visualization of land use transitions through fuzzy-AHP-CA
The land use data was classified into 7 categories as forest (evergreen to semi evergreen, moist deciduous forest, dry deciduous forest, scrub/grass lands), plantations (Acacia/ Eucalyptus/ hardwood plantations, Teak/ Bamboo/ softwood plantations), horticulture (Coconut/ Areca nut / Cashew nut plantations), agriculture, open space, built-up and water. Based on land use history during 2004 to 2012, visualization of land use of 2013 was done on different conditions (i.e. transition rules, iteration numbers). This was validated with the actual land use (based on classification of remote sensing data) through kappa indices. The change trajectories between the observed and simulated land-cover classes for the year 2013 had errors lower than 5 %. Kno value is a better alternative than Kstandard for assessing the overall accuracy of the model (Pontius, 2000). The Kstandard value of 0.83 highlights the level of modelling accuracy. The model performed very well in its overall ability to predict land-use of 2013 (Kno = 0.88), and the Klocation value of 0.87 indicates that the model provides a reasonable representation of location. Also, visual interpretation of the results shows that there is an evident similarity between the real and simulated maps for the year 2013. The simulated land use Figure 10-15 shows likely increase in built-up area and loss in forest cover across all the project regions. The process of urbanization is observed to be high in the areas near WCPM, project Sea bird, Kaiga nuclear power house. The analysis highlighted the decline of forest cover with increase in monoculture plantations and urban areas. The natural vegetation is being replaced by the plantation activities in recent time also indicates their further growth in future years. The WCPM shows increase in built-up area from 39.6 (2013) to 83.9 % (2022) due to the influence of Dandeli town located within the project region. The buffer region also had intensification of urban area from 19.6 to 49.9 % by 2022. The Seabird region shows increase in urban area from 33.32 (2013) to 42.54 % (2022) by losing the forest cover from 29.19 to 21.01 % (2022). The moderate changes can be noted in the case of Supa and Kadra dam due to Anshi Dandeli Tiger reserve (ADTR) wild life sanctuary. The region surrounded by development projects witnessed changes within and in the neighborhood due to rapid land conversion. The cropland intensification also witnessed nearby major reservoirs and huge lakes of Plains regions. This necessitates comprehensive land use management focusing on restoration of ecosystems to mitigate the impacts further.
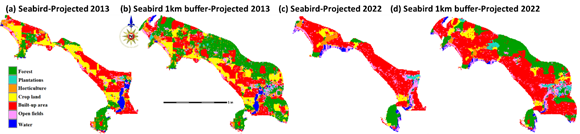
Figure 10 (a, b, c, d) Projected land use of Sea bird project for 2013, 2022.
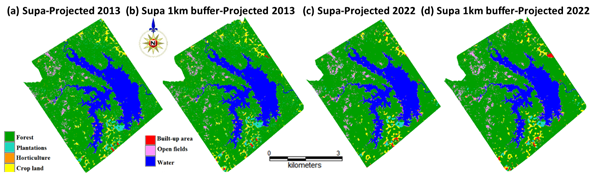
Figure 11 (a, b, c, d) Projected land use of Supa dam for 2013, 2022.
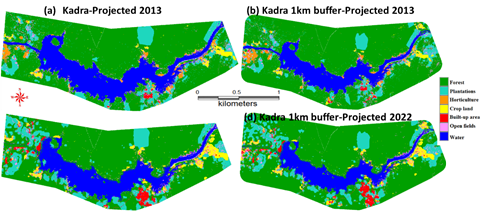
Figure 12 (a, b, c, d) Land use of Kadra dam for 2013, 2022.
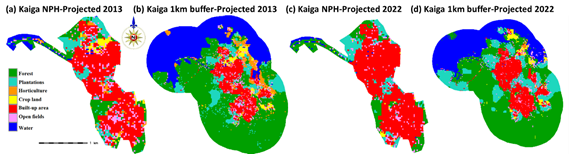
Figure 13 (a, b, c, d) projected land use of Kaiga NPH for 2013, 2022.
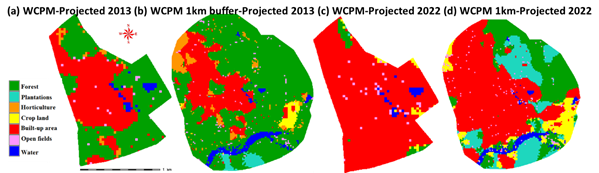
Figure 14 (a, b, c, d) Projected land use of WCPM.for 2013, 2022.
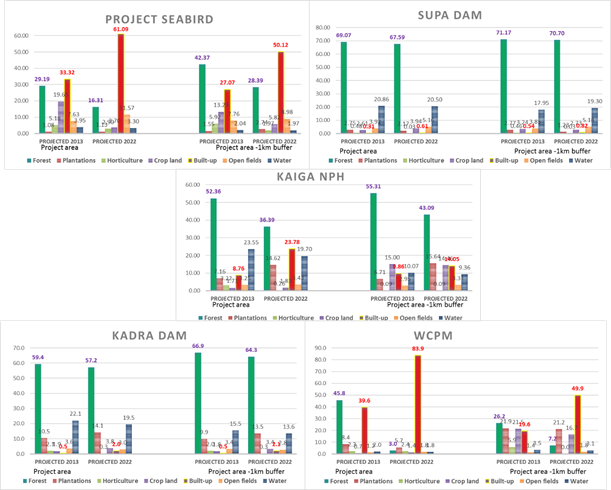
Figure 15 Projected land use of developmental projects and 1km buffer region for 2013, 2022.
4.4 The encroachments as a driver of forest degradation
The forest encroachment is a major driver of forest fragmentation and LULC dynamics. Uttara Kannada district has been experiencing continuous unauthorized land conversions due to fertile forest soil and water availability for cultivation, settlement, construction, grazing cattle and other human activities. The factors responsible are the inducement of market based economic forces, etc. Uttara Kannada district (Figure 16) forest encroachment map shows an area of 7071.69 Ha is diverted for illegal usages ranges from 1Ha to greater than 10 Ha. Division wise area loss due to encroachments (Figure 17 (a)) depicts Sirsi and Honnavar divisions with major land encroachments for agriculture, built-up and marked based economic crop cultivation. Serious threats faced swamps in Sirsi, Honnavar divisions, as water drains are diverted to horticulture gardens. The land conversion to built-up environs is common in and around Sirsi, Honnavar, Bhatkal, Kumta town regions. The Haliyal, Yellapur forest divisions are getting affected due to land conversion for agriculture activities. In certain pockets, the existing land owners are converting adjacent forests by clearing and burning. The pattern of illegal forest resource exploitation is found to be same in all the divisions.
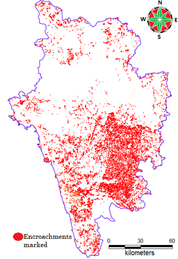
Figure 16 Area encroached in Uttar Kannada district
Major loss was observed in moist deciduous forest cover (3747.89 Ha) followed by evergreen to semi evergreen (1629.16 Ha) (Figure 17 (b) and Table 8). Figure 18 (a) depicts major encroachments in deciduous forest types in eastern side of Haliyal division. Honnavar division (Figure 18 (b)) shows 402.07 Ha of lost in Acacia plantation, because these regions are spatially located very near to agriculture regions. The loss of evergreen forest and swampy areas are due to conversion of areca nut/ coconut plantations for getting continuous water supply. Moist deciduous forests (383.71 Ha) mainly cleared for colonisation, other associated developments in Karwar division (Figure 18 (c)). The Sirsi division (Figure 18 (d)) has lost major tracts of forests in all categories. The clearing of Betta lands (forest land assigned for leaf manure collection) for other uses such as commercial crop plantations, grazing, poultry etc. are observed in Sirsi division. Yellapura division (Figure 18 (e)) represents a greater loss in moist deciduous forest type comprising 290.07 Ha because these type of forests exists in moderate elevations and are easier to convert to other land use forms. Encroachments in wild life division are not marked due to unavailability of forest administrative boundaries and administrative restrictions.
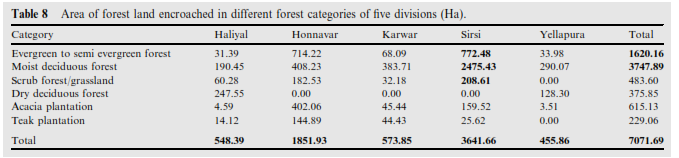
Table 8 Area of forest land encroached in different forest categories of five divisions (Ha)
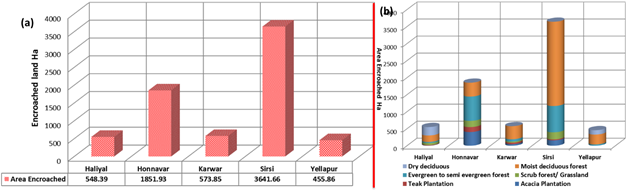
Figure 17 (a, b) Encroachments with respect to forest classes
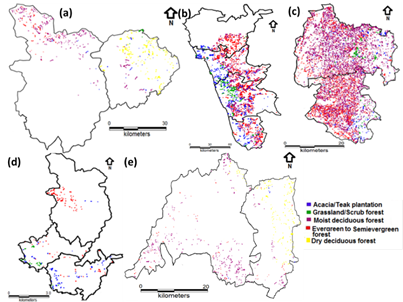
Figure 18 (a, b, c, d, e) Encroachments across all forest divisions
Verification was done by overlying original reserve forest boundaries (obtained from Karnataka forest department), revenue department records and field data. Field investigations were done to assess the encroachments patterns, including compilation of information such as crop grown, trees removal, period of cultivation and other human induced drivers. The forest land encroachment is the major threat to biodiversity, changes in vegetation type (composition and abundance), destruction of ecosystems/habitats, species extinction, curtailment of natural regeneration, reduction in the total economic value of the forests, increases forest management cost. Effective long-term monitoring (of biological, habitat, and hydrological effects) and mapping of natural resources would help in formulating strategies to mitigate the impact of developmental projects (ex. installation of silt traps or silt screens, waste treatment etc.). Involvement of all stakeholders in the forest management would help in arresting illegal practices of encroachment. Involvement of local forest dwelling communities (tribal societies, self-help groups of women etc.) in forest nurseries activities, afforestation, extraction of non-timber forest products (NTFP) would help in the support of local livelihood and protection of forests. Energy efficient stoves, biogas, solar devices, use of agricultural wastes etc. are to be promoted to minimise the demand of fuel in rural areas. At the same time the provision of adequate fuel wood/or other alternative fuels to cottage industries run by potters, lime makers etc., would help in arresting forest degradation Raising mono cultural/ mixed exotic tree plantations has to be site specific such as barren lands, near to pulp based industries. Monitoring involving all stakeholders would ensure post-project environmental monitoring and auditing the compliance and adherence of the environmental norms.