 |
Stimulus of Developmental Projects to landscape dynamics in Uttara Kannada, Central Western Ghats
|
 |
aEnergy & Wetlands Research Group, Center for Ecological Sciences [CES], Indian Institute of Science, Bangalore, Karnataka
560 012, India, b Centre for Sustainable Technologies (astra), Indian Institute of Science, Bangalore, Karnataka 560 012, India cCentre for Infrastructure, Sustainable Transportation and Urban Planning [CiSTUP], Indian Institute of Science,
Bangalore, Karnataka 560 012, India
dInternational Institute of Information Technology-Hyderabad [IIIT-H], India
Web URL: http://ces.iisc.ac.in/energy; http://ces.iisc.ac.in/foss
*Corresponding author: cestvr@ces.iisc.ac.in
|
MATERIALS AND METHOD
The method followed for the current study (Figure 2) involves preprocessing of data, land use analysis and mapping of encroachments using forest administrative boundaries. LULC changes in Uttara Kannada district is analysed using temporal remote sensing data (1973, 1989 & 2013) with ancillary data and field data. The remote sensing data (RS) used in the study are Landsat MSS (25/01/1973), Landsat TM (03/01/1989), Landsat ETM+ (06/01/2004; 29/1/2013) and Google Earth (http://earth.google.com). Landsat data were downloaded from public archive (http://landsat.gsfc.nasa.gov). Ancillary data includes cadastral revenue maps (1:6000), the Survey of India (SOI) topographic maps (1:50000 and 1:250000 scales), vegetation map of South India developed by French Institute (1986) of scale 1:250000 (http://www.ifpindia.org). The forest boundaries of each division representing different forest types, revenue land information are collected from state forest department (http://www.aranya.gov.in). Topographic maps provided ground control points (GCP’s) to rectify remote sensing data and scanned paper maps. Vegetation map of South India (1986) of scale 1:250000 (Pascal, 1986) was digitized to identify various forest cover types and classify RS data of 1980’s. Other ancillary data includes land cover maps, administration boundary data, transportation data (road network), etc. Pre-calibrated GPS (Global Positioning System - Garmin GPS units) were used for field data collection, which were used for RS data classification as well as for validation. Remote sensing data obtained were geo-referenced, rectified and cropped corresponding to the study area. Geo-registration of remote sensing data (Landsat data) has been done using ground control points collected from the field using pre calibrated GPS (Global Positioning System) and also from known points (such as road intersections, etc.) collected from geo-referenced topographic maps published by the Survey of India (http://www.surveyof india.gov.in).
The Landsat satellite 1973 images of spatial resolution 57.5 m x 57.5 m (nominal resolution), were resampled to 30 m x 30 m comparable to the 1989 and 2013 data. Landsat ETM+ bands of 2013 were corrected for the SLC-off through image enhancement techniques, followed by nearest-neighbour interpolation. Land use analysis involved (i) generation of False Color Composite (FCC) of remote sensing data (bands–green, red and NIR). This composite image helps in locating heterogeneous patches in the landscape, (ii) selection of training polygons by covering 15% of the study area (polygons are uniformly distributed over the entire study area) (iii) loading these training polygons co-ordinates into GPS, (vi) collection of the corresponding attribute data (land use types) for these polygons from the field, (iv) supplementing this information with Google Earth and (v) 60% of the training data has been used for classification, while the balance is used for validation or accuracy assessment. The land use analysis was done using supervised classification technique based on Gaussian maximum likelihood (GML) algorithm with multi-temporal “ground truth” information (collected from field using GPS). GML Classification of remote sensing data is based on Bayes’ theorem through the selection of the largest posterior probability rather than the minimum distance and for each training site the complete distribution of values is retained by generating a histogram. The number of occurrences in each histogram bin relative to the total number of occurrences determines the conditional probability distribution (Atkinson and Lewis, 2000) based on the spectral signature defined in the training set to determine each class. Mean and covariance matrix were computed using estimate of maximum likelihood estimator. This technique is proved to be a superior classifier as it uses various classification decisions using probability and cost functions (Ramachandra et al., 2012). GRASS GIS (Geographical Resources Analysis Support System) –software is used for the analysis, which is a free and open source software (http://wgbis.ces.iisc.ac.in/grass/index.php) having the robust support for processing both vector and raster files. Accuracy assessments were performed to decide the quality of the information derived from RS data considering reference pixels. These test samples are then used to create error matrix (also referred as confusion matrix) kappa (κ) statistics and overall (producer's and user's) accuracies to assess the classification accuracies.
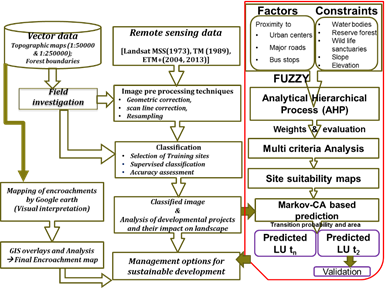
Figure 2 Method followed in the analysis
Temporal land use analyses for each developmental projects have been done considering the project region and project region with a 1 km buffer for accounting changes in the vicinity due to the implementation of the project. Considering buffer region extended the focus of strategies to measure the land use manifestation due to of economic and workforce development. The major initiation of developmental projects started in mid-1980’s and hence 1973 was chosen as a base reference year, while 2013 information represents the current status. Fuzzy clustering technique is performed to group the spatial units of agents into clusters based on their attribute data using evaluation membership functions (sigmoidal monotonic decrease/ increase function, linear) and rescale driver maps into the range 0–255, where 0 represents unsuitable sites and 255 represents the most suitable for transition. In the MCDM process, a collection of different factors such as elevation, slope, proximity to urban centers, proximity to roads and constraints such as water bodies, reserve forest, wild life sanctuaries, slopes higher than 20 % were considered. Analytical Hierarchal process (AHP) is then used to assign weights to these spatial units based on expert opinion. The consistency index CI is computed to evaluate consistency of the weightage matrix. Consistency ratio (CR) were evaluated for three regions and acceptable CR from 0.04 to 0.09 is obtained for each land use. The weightage matrix for each developmental project is evaluated separately, for example, WCPM area the consistency values of industries (0.22), major roads (0.09), urban area (0.34) with CR of 0.06. The CR value below 0.1 indicates the model is consistent, obtained by the probability of the random weights from the landscape factors (Saaty, 2008). Then CA is implemented with the help of transition probability matrix, which inherits past states of land use types to predict future state. CA selects the location of pixels among that are most likely to be transformed between the time periods. Land use is simulated for the year 2013 based on different conditions (i.e. transition rules, iteration numbers) generated based on land use history of 2004-2012. Simulated land use of 2013 was validated with the actual land use (based on classification of remote sensing data) through kappa indices, as a measure of agreement. Once these data and agents are trained and validated, data is used to model and simulate for future trends (2022). The other major land use change driver is encroachment of forests. The division-wise forest administrative maps were used for spatially quantifying the extent of forest encroachments. These administrative forest boundaries were geometrically corrected with GPS points, topographic maps and overlaid on Google Earth. These administrative boundaries with distinct land survey numbers and other features aided in visual interpretation method by marking unauthorised modifications of land. This is further validated with field data compiled using GPS.
|
|
Citation :T.V. Ramachandra, Bharath Setturu, K.S. Rajan, M.D. Subash Chandran (2016). Stimulus of developmental projects to landscape
dynamics in Uttara Kannada, Central Western Ghats. The Egyptian Journal of Remote Sensing and Space Sciences (2016), http://dx.doi.org/10.1016/j.ejrs.2016.09.001, pp.1-19.
|