|
RESULTS AND DISCUSSION
The spatial pattern analyses using temporal remote sensing data, highlights the extent of forest transition, which are given in Figures 5 to 8. The forest cover in coastal region has decreased from 66.5 (2004) to 59.06 % (2013) due to implementation of unplanned projects such as project Sea Bird, Kaiga nuclear power house, Kadra dam, etc., increase in human populations at certain pockets of Karwar, Bhatkal, Honnavara taluks in coastal regions. The increase in population density has cleared major forest cover as built-up area has increased from 3.98 to 4.5 % and plantations have increased from 5.69 to 9.04 %. Sahyadri region is the core part of central Western Ghats with lush greenery, mountains, network of perennial streams and Arecanut gardens in the valleys. The evergreen to semi evergreen forested area has been transformed into moist deciduous forests due to disturbances and some have been converted into plantations such as Acacia auriculiformis, Casuarina equisetifolia, Eucalyptus spp., and Tectona grandis etc. The commercial plantation is practiced prominently in Bedthi / Gangavali river valley and Sharavathi river estuary of Honnavar. The forest cover has lost from 65.98% to 60.6% by 2013 due to increase in built-up area (2.12%) and plantations (17.29%). Haliyal and Mundgod taluks form transitional zone, which are prone to economic activities. The market based cropping pattern and forest department based initiatives for plantation of exotic species shown equally adverse effects on forests. The forest cover has lost from 27.35 to 15.17 % (2013) by increase in plantations 34.28 to 39.82%. The area under paved surface has reached to 6.3 from 2.9 % (2004), due to population increase and associated economic activities. Classification accuracy is assessed by considering the reference data collected from field. Table 4 with higher kappa and overall accuracy values highlights that the classification is satisfactory.

Fig. 5 Land use change across Coastal region from 2004 to 2013
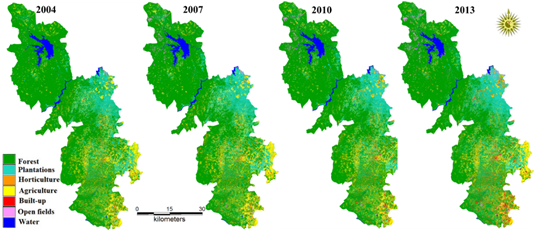
Fig. 6 Land use change across Sahyadri Interior region from 2004 to 2013
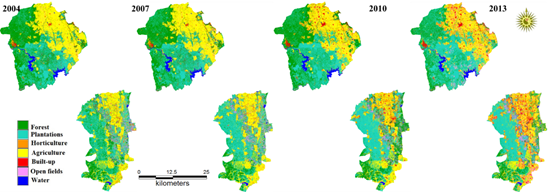
Fig. 7 Land use change across Plains from 2004 to 2013
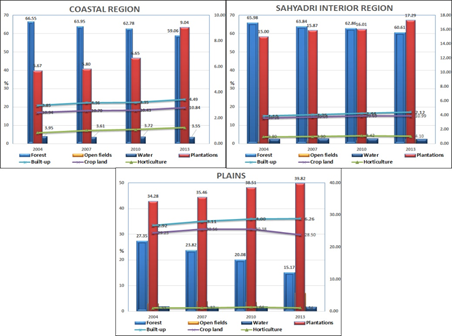
Fig. 8 Land use dynamics across three agro climatic zones
Table 4. Accuracy assessment of land use analysis
Year |
2004 |
2007 |
2010 |
2013 |
Categories |
PA |
UA |
PA |
UA |
PA |
UA |
PA |
UA |
Forest |
92.29 |
98.62 |
86.13 |
37.46 |
89.18 |
91.10 |
96.28 |
76.45 |
Plantations |
88.53 |
96.13 |
98.27 |
91.32 |
91.42 |
92.44 |
99.31 |
79.49 |
Horticulture |
98.09 |
80.05 |
60.04 |
96.5 |
97.58 |
98.46 |
86.50 |
93.84 |
Crop |
88.25 |
96.33 |
93.97 |
89.74 |
86.05 |
84.64 |
55.04 |
93.02 |
Built-up |
88.26 |
80.05 |
79.66 |
81.85 |
99.93 |
96.96 |
93.39 |
62.50 |
Open fields |
86.50 |
93.84 |
98.56 |
93.31 |
86.49 |
95.26 |
95.59 |
94.63 |
Water |
98.82 |
90.67 |
96.94 |
97.19 |
97.86 |
81.39 |
99.71 |
99.17 |
Kappa |
0.82 |
0.86 |
0.9 |
0.88 |
Overall Accuracy |
88.26 |
91.02 |
91.24 |
92.47 |
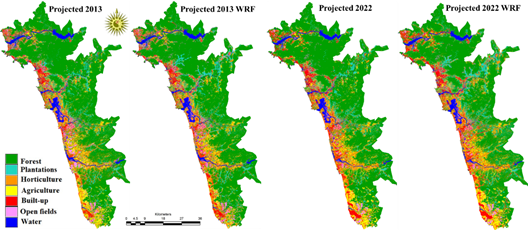
Simulation and modelling of transition at temporal scale is done using Fuzzy-AHP-CA-MC technique. Markov chain is used to determine the zone wise transition probability during 2004 and 2007 with loop time of 3 years. CA with the site suitability and the transition matrix (generated by MC and FUZZY-AHP-MCE) predicted spatially the changes under two scenarios based on the neighboring pixels for 2022 (with the knowledge of transitions during 2004-2007, 2007-2010 and 2010-2013). The accuracy of prediction is evaluated through Kappa statistics by comparing the simulated data with the actual land uses of 2010, 2013 (Table 5 for both scenarios: P* (predicted considering the implementation of protectionmeasures) and P_WRF: Prediction without the protection of reserve forests), which indicates that CA MC is a reliable estimator. The Fuzzy distance measurement has provided the potential transition of each land use based on factors that promote transition. AHP showed good consistency and found suitable for predicting land uses. The projected land use of 2022 for coastal region (Figure 9, Table 6) shows forest cover will reach to 56.76 % with the implementation of protection measures by regulatory framework. The urban expansion from 4.49 to 8.51 % with the industrial growth and economic activities. The increase in plantation area is due to the conversion of forests and also planting in degraded forest patches. Scenario 2 reflecting the lack of protection in the coastal region will result in rampant forest changes. The forest area will reduce to 54.07 % with the increase in area under plantations, horticulture and built-up in the costal taluks – Karwar, Bhatkal, and Honnavar.
Sahyadari Interior region (Figure 10) shows moderate disturbances (60.61 (2013) to 55.62 % (2022)) under high protection scenario with changes in plantations and built-up land use classes. The ADTR, ALTM, Bedthi conservation reserve areas are under protection and will remain so with the minimal disturbances. Scenario 2 highlights the decline of natural forest cover from 60.61 (2012) to 50.11 % (2022) with increase in monoculture plantations from 17.29 to 20.33%. The same trend is noticed in Sirsi, Siddapur, Yellapura taluks except Supa. The area under built-up cover will reach 2.12 to 7.23 % and horticulture will be 11.83 % (in 2022). As per the scenario 2, forest patches in this region would be only in protected areas and Kans - scared forests by 2022. Kans are relic forest patches, protected since historical times and are expected to remain under conservation. The predicted land uses under two scenarios in the eastern plains (Figure 11) show spurt in built-up from 6.26 to 7.81 and 8.16 %. The existing towns and villages will be more urbanized due to neighbor effect of urban agglomerations - Hubli, Dharwad and Belgaum. The forest cover will be 11% and there would be an increase in plantations from 39.42 to 42% (2022). The unauthorized land conversion in plains would lead to an increase in agriculture and horticulture (31.69 %).
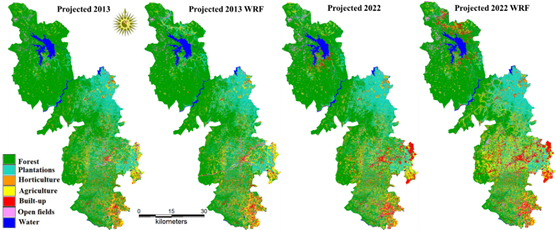
Fig. 10 Predicted and future Landuse of Sahyadri Interior (2013-2022 under two scenrios)
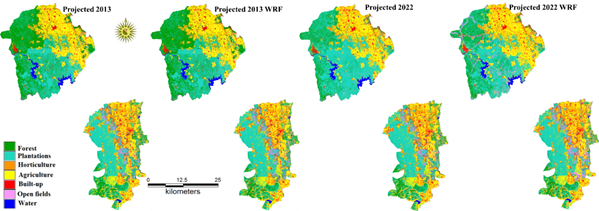
Fig. 11 Predicted and future Landuse of Eastern Plains (2013-2022 under two scenrios)
Table 5. Validation of actual land use with predicted and Kappa value (P* represents Projected).
Zone |
Coastal zone |
Sahyadri Interior |
Plains |
Index |
P*_2013 |
P_ WRF 2013 |
P_2013 |
P_ WRF 2013 |
P_2013 |
P_ WRF 2013 |
Kno |
0.89 |
0.91 |
0.92 |
0.91 |
0.94 |
0.92 |
Klocation |
0.87 |
0.9 |
0.95 |
0.95 |
0.95 |
0.93 |
Kstandard |
0.83 |
0.87 |
0.9 |
0.9 |
0.92 |
0.89 |
The series of hydroelectric projects in the coastal region have adversely affected the ecology and biodiversity. The fisheries sector in the Sharavathi river is now facing serious impediment, due to the loss of spawning and breeding grounds of fishes (now only 43 taxa) and 50% reduction in the total fish taxa with the implementation of power projects at Linganmakki and Gersoppa [68]. This region is undergoing large scale forest transitions after 2005 with the implementation of large scale developmental projects (Project Sea Bird at Karwar, etc.), medium scale industry, small scale Industrial estate (comprises of 357 industries) and other developmental activities. Konkan railways, National Highway 17 (NH-17, now NH-66) from Goa to Udupi, National Highway 63 (NH-63) from Hubli to Ankola have also contributed significantly to forest degradation. Konkan Railway is the longest railway line in the region has given push to urbanization with emergence of new towns, creation of major ports. These activities have impacted the environment as well as socio-economic aspects of the west coast [69]. The forests in Sahyadri region are in different stages of secondary succession by transformation of evergreen forests into moist deciduous forests due to numerous anthropogenic factors such as heavy exploitation, large scale unplanned forest plantations, encroachment of forests [70]. Undulating terrains with the community protected reserves have several primary forest patches with greater than 80% evergreenness and endemism [71]. However, market induced commercial plantations such as Areca catechu, Cocos nucifera has transformed major croplands and swampy areas as horticulture plantations (10.99 %) by 2013. The tourism activities are higher than all the taluks in plains because of Anshi- Dandeli tiger reserve, Anshi hornbill’s national park, Kali river rafting and many more jungle resorts.
The agent based modeling has facilitated to visualize landscape development and transition under higher protection and without any control regulations. Area under built-up has increased over time with the loss of forest lands, agriculture and natural open spaces. This change has allowed recolonization of forest cover by shrub and exotic tree species across three agro climatic zones. Land use change modeling with rich spatial data provided a proper environment analyze and display spatial data to predict land use changes based on several independent spatial variables. Agent based prediction of land uses has helped in visualizing likely changes, which is essential to formulate a comprehensive land use management policies focusing on restoration of degraded forest patches and mitigation of further impacts on the pristine ecosystem. Further, prediction through logistic regression, frequency ratio, and weights of evidence techniques could be reinforced by considering the local expert knowledge [72, 73] to analyze the probability of occurrence of a dependent variable with each class of independent variables [74, 75]. The inclusion of variability in land use drivers, socio-economic variables, the processes inducing changes and their influences on modeling and prediction would augment the prediction accuracy.
Table 6. Projected land use for 2013 to 2022 across three zones
Zone |
Coastal region |
Sahyadri Interior |
|
Category |
P 2013 |
P 2013 WRF |
P 2022 |
P 2022 WRF |
P 2013 |
P 2013 WRF |
P 2022 |
P 2022 WRF |
|
HA |
% |
HA |
% |
HA |
% |
HA |
% |
HA |
% |
HA |
% |
HA |
% |
HA |
% |
Forest |
204522.3 |
60.9 |
203066.3 |
60.52 |
190459.3 |
56.76 |
181431.57 |
54.07 |
329984.27 |
60.97 |
322022 |
59.50 |
301021.8 |
55.6 |
271210.8 |
50.1 |
Plantations |
24520.8 |
7.31 |
25227 |
7.52 |
27385.9 |
8.16 |
32822.52 |
9.78 |
101981.9 |
18.84 |
107255 |
19.82 |
111460.9 |
20.60 |
110030.6 |
20.33 |
Horticulture |
24975.7 |
7.44 |
24560.22 |
7.32 |
29268.7 |
8.72 |
30803.38 |
9.18 |
23663.7 |
4.37 |
26643 |
4.92 |
26449.6 |
4.89 |
25997.1 |
4.80 |
Crop land |
30449.9 |
9.07 |
29356.97 |
8.75 |
36547.7 |
10.89 |
34147.98 |
10.18 |
43794.86 |
8.09 |
41926 |
7.75 |
45804.4 |
8.46 |
64012.2 |
11.83 |
Built-up |
21464.9 |
6.39 |
24251.33 |
7.23 |
28567.5 |
8.51 |
32907.01 |
9.81 |
16338.57 |
3.02 |
17346 |
3.21 |
28121.06 |
5.20 |
39104.8 |
7.23 |
Open land |
17018.6 |
5.07 |
16401.43 |
4.89 |
11361.6 |
3.39 |
11489.6 |
3.42 |
11739.47 |
2.17 |
12309 |
2.27 |
14717.67 |
2.72 |
17258.3 |
3.19 |
Water |
12709.1 |
3.79 |
12698.1 |
3.78 |
11970.7 |
3.57 |
11959.2 |
3.56 |
13693.3 |
2.53 |
13694 |
2.53 |
13620.5 |
2.52 |
13582.2 |
2.51 |
Eastern Plains |
|
Year |
P 2013 |
P 2013 WRF |
P 2022 |
P 2022 WRF |
Total Area |
|
Category |
HA |
% |
HA |
% |
HA |
% |
HA |
% |
|
|
Forest |
22961.03 |
15.06 |
21904.14 |
14.36 |
18285.47 |
11.99 |
16902.38 |
11.08 |
Coastal region
335561.32 |
|
Plantations |
55025.39 |
36.08 |
56456.78 |
37.02 |
64054.89 |
42.00 |
59461.46 |
38.99 |
|
Horticulture |
1411.32 |
0.93 |
1575.54 |
1.03 |
3148.29 |
2.06 |
2853.44 |
1.87 |
|
|
Crop land |
44830.87 |
29.40 |
45389.04 |
29.76 |
45651.73 |
29.93 |
48331.07 |
31.69 |
Sahyadri Interior
541195.99 |
|
Built-up |
11472.99 |
7.52 |
12276.44 |
8.05 |
11910.87 |
7.81 |
12442.5 |
8.16 |
|
Open fields |
14126.75 |
9.26 |
12226.4 |
8.02 |
6747.78 |
4.42 |
9875.01 |
6.48 |
|
|
Water |
2677.36 |
1.76 |
2677.36 |
1.76 |
2706.67 |
1.77 |
2639.84 |
1.73 |
Plains
151505.69 |
|
Note: HA - hectares
|