2.1 Study species
Syzygium travancoricum Gamble. is endemic to the southern Western Ghats of peninsular India, one of the global hotspots of biodiversity (Myers et al. 2000). The tree is hygrophilous, prefers swampy conditions, and found mostly in (especially in Kerala) Myristica swamp areas (Gamble 1935; Sasidharan 1997). The species is considered critically endangered and the conversion of low lying swamp areas to paddy fields is the major reason for its habitat degradation (IUCN 2015). In addition, other forms of disturbance e.g. urbanization, developmental pressures and conversion of forest lands for other land use purposes also magnify the potential threat (Chandran et al. 2008; Roby et al. 2013).
A recent study from Myristica swamps of Kerala, located in the extreme southern part of peninsular India, has reported its habitat preference as well as recommended reconsideration of IUCN status (Roby et al. 2013). However, except a few, the information on distribution of natural population is still scattered and taxonomic disputes among closely related members aggravate the problem thus limiting the conservation and management planning.
2.2 Syzygium travancoricum distribution
Syzygium travancoricum Gamble. was first reported from Myristica swamps of southern Western Ghats, Kerala, India (Bourdilion 1908; Gamble 1935). Myristica swamps are shallow water logged areas dominated by tree members of Myristicaceae family. Later on, few more reports on S. travancoricum’s occurrence were published from the nearby areas indicating water logged / moist habitat preference of the species. The species geographical distribution was later extended up to central Western Ghats region after its discovery from swampy areas / forest patches of Uttrara Kannada district of Karnataka and Goa (Chandran et al. 2008, Prabhugaonkar et al. 2014). The species is categorized as critically endangered by IUCN based on earlier published data on its distribution limited to southern Western Ghats (IUCN 2015). Additionally, identification of S. travancoricum is a complex issue because of its morphological similarity with another Syzygium species i.e. S. stoksii, therefore, proper taxonomic identification is essential for any new occurrence record . Hence, research has been undertaken to authenticate the species identity through type specimens at herbarium and molecular techniques apart from distributional data and taxonomic accounts.

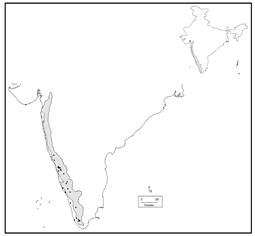
Figure 1. Study area and occurrence points (Western Ghats = gray coloured area, as per the boundary shown by Conservation International)
2.3 Study area
The study was conducted in the Western Ghats and costal region of peninsular India. The Western Ghats are flanked by the Arabian Sea in the west, Deccan Plateau in the east, The Vindyan Range in the north, and Kanyakumari plain in the south. The mountain chain covers an area of 160 000 km2 spanning through six Indian states (south of Gujarat, Maharashtra, Goa, Karnataka, Kerala and west of Tamil Nadu). Annual rainfall varies from 2350 mm in the north to 7450 mm in the south. The mean temperature also has distinct gradients from sea level (250 C) to higher altitudes at 2400m (110 C) in coldest month. This temperature and rainfall gradients along with varied topography, have resulted in a diverse vegetation mosaic from tropical wet evergreen forest, semi-evergreen, moist deciduous forest, dry deciduous forest, scrub jungles, savannahs, peat bogs, and Myristica swamps. It is a global biodiversity hotspot, with numerous rare, endangered, and endemic taxa, which also make it one of the global and national priority areas of conservation concern (Pascal and Ramesh 1997; Myres et al. 2000; Bawa et al. 2007)
2.4 Occurrence data
32 occurrence records of S. travancoricum have been collected through field surveys and literature review (Pascal and Ramesh 1997; Sasidharan 1997; Chandran et al. 2008, 2010; Ray et al. 2012, 2014; Roby et al. 2013). A total of 21 points have been selected finally for model development that is at least 10 km apart to avoid the bias among clustered occurrence records (Fig1). By this step, it has been assumed that, data points are sufficiently separated as to be spatially independent.
2.5 Environmental data
We selected 20 potential environmental predictor variables for model training based on published literatures on S. travancoricum and other studies on species distribution modeling (Anonymous 2007; Irfan Ullah et al. 2007; Nair et al.2007; Zhu et al. 2007; Chandran et al. 2008; Yates et al. 2010). These variables included precipitation, temperature (19 bioclimatic layers from the WorldClim dataset (Hijmans et al. 2005) and soil moisture (Willmott and Matsuura 2001). Correlation analysis and PCA were conducted considering 19 bioclimatic variables to minimise redundancy,. First, correlated variables (≥ 0.7) were grouped and from this group, the variable with highest loading on principle axes was selected (Slender et al. 2013). All the layers were geo-referenced to the same projection, grid cell size, and resampled to the resolution of 1km2 with the help of DIVA-GIS (version 7.1.6) and GRASS (version 6.2, http://ces.iisc/ernet.in/grass). These layers were finally cropped corresponding to the study region (i.e. Western parts of peninsular India).
2.6 Modeling procedure
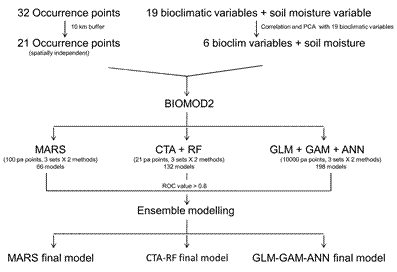
The recent development of various model building tools based on diverse algorithm, data availability and inherent statistical interpretation provide a wide range of choices to test their applicability to real ecological problems. On the other hand selection of optimum/perfect procedure often turns to be a difficult task because of considerable variance in modeling output. Seven modeling techniques were attempted to reduce uncertainty and opt appropriate robust technique for prediction, etc. Among these, six are available in BIOMOD2 package in R: three regression methods (GLM, GAM and MARS), two machine-learning methods (ANN and RF), one classification method (CTA) (Thuiller et al. 2013) and Maxent is a standalone program (Max Ent, version 3.3.3; http://www.cs.princeton.edu/~schapire/maxent/). The ensemble approach was divided into three parts based on pseudo-absence point requirement: MARS, CTA-RF and GLM-GAM-ANN.
Pseudo-absence (pa) strategy in BIOMOD2 package was considered due to lack of real absence data. Multiple numbers of pseudo-absence points were selected based on study conducted by Massin et al. (2012). For CTA and RF we considered 21 pa (similar to occurrence no.), for MARS, it was 100 pa and for GLM-GAM-ANN, 10,000 pa. To optimise the model performance, a total of 6 pa sets were chosen in modelling. Both random as well as geographical exclusion principles were considered for trial as pa selection strategy has important role in modelling oucome.,. For geographical exclusion, 5 km buffer area was selected based on field experience and comprehensive review of earlier modelling experiments (Lobo et al. 2010).
Majority of the default parameters were considered for BIOMOD2, . The dataset was split into 80:20 ratios for model development and evaluation respectively. Each model was iterated for 10 times and the final run used 100% of data in case of all models (Fig 2).

Figure 2. Modelling framework in BIOMOD2
Best performing models were chosen based on i) the area under the relative operating characteristic curve (AUC), ii) Cohen’s kappa iii) the true skill statistic (TSS) and iv) sensitivity. In each set, a final model was developed by ensemble forecast of the best performing models from all respective algorithms. The projected distributions were calculated with the weighted mean approach using the pre-evaluation of the predictive performance of the single models. Binary transformation of the modeling output was done by applying ROC value from ensemble weighted mean models. The randomization technique as described in BIOMOD2 was used to find out the respective variable importance in models . This model independent approach helps in making direct comparison of variable importance across models. In addition, evaluation strips were used to determine the response curves of the four most influential variables.
In MaxEnt, the default parameters with few modifications were used for the modeling experiment. Only linear, quadratic and hinge features were used due to the paucity of occurrence data and 25% of the data was kept aside for random testing purpose. Jackknife test of variable importance was conducted to get the details of variable contribution. The performance of the model was tested through the AUC value.
2.7 Conservation status assessment
The IUCN Red List categories and Criteria (Anonymous 2010) were used to assess the conservation status of the plant in the Western Ghats. Extent of Occurrence (EOO) and Area of Occupancy (AOO) of two Red list parameters under Criteria B were measured. EOO was measured by two methods based on the established protocols (Moat 2007; Franklin and Preece 2014) and for AOO, a grid of 2 X 2 km was superimposed on occurrence points and cumulative area of cells occupied by the species was calculated (Moat 2007). All measurements were done in ArcGIS 9.3.1 and Q-GIS (1.6.0).


