Bioremediation potential of Macrophytes in Jakkur Wetland, Bangalore
Sudarshan.P. 1, 2Mahesh M.K 2Ramachandra T.V.1, 3, 4 1 Energy and Wetlands Research Group, Centre for Ecological Sciences, Indian Institute of Science, Bangalore-5600122 Dept. of Botany, Yuvaraja’s College, Mysore-570005 3 Centre for Sustainable Technologies (ASTRA), Indian Institute of Science, Bangalore,
Indian Institute of Science, Bangalore – 560012, India. 4Centre for Infrastructure, Sustainable Transportation and Urban Planning (CiSTUP),
Indian Institute of Science, Bangalore, Karnataka, India
*Corresponding author:cestvr@ces.iisc.ac.in
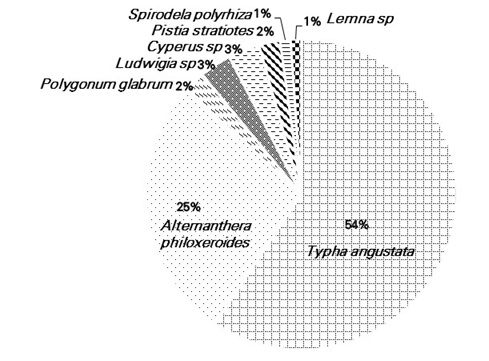
Macrophyte distribution is related to several environmental and anthropogenic factors such as climate, hydrology, geomorphology, nutrient availability, biological interactions, and the extent of anthropogenic activities (Lacoul and Freedman, 2006; Feldmann and Noges, 2007; Hrivnak et al., 2009). Table 1 lists of 9 species of macrophytes (4 floating and 5 emergent types) belonging to 8 families (5 species from inlet and 6 species from outlet) with life forms. Typha angustata was the dominant species followed by Alternanthera philoxeroides. The percentage composition of macrophytes were given in figure 3.
4.2 Estimation of Biomass
Tables 2 and 3 lists species wise biomass and C, N and P of macrophytes samples at inlet and outlets. Polygonum species had higher biomass at inlet whereas Typha angustata had the higher biomass than other species at the outlet. The biomass range was 0.15-0.412 kg/dw (Cyperus sp. - Polygonum glabrum) at inlet and 0.03-1.04 kg/dw (Lemna sp - Typha angustata) at the outlet. Among all, Typha angustata had the higher biomass compared to others during the study period. Variations in biomass and plant zonation are due to varied growth rates among species depending on the nutrient availability and water level (Pompeo et al., 2001; Blom et al.,1990; Junk and Piedade, 1993; Camargo and Esteves, 1996). The biomass changes are low in the aquatic environment with the minimal variations of water level during seasons (Camargo and Esteves, 1995).
4.3 Nutrient concentrations in macrophytes Estimation of Carbon, Nitrogen and Phosphorus:
Carbon (C), Nitrogen (N) and Phosphorus (P) are the most vital elements for plant morphogenesis, support a variety of cell physiological functions and their absorption and allocation are prove to be essential for all organisms (Sardans et al., 2012). These nutrients limit primary production especially in freshwater ecosystems (Maathius, 2009). All these species vary in their nutrient concentration and their distribution depends on nutrient availability. Plant nutrient concentration varies among sites and seasons and each species have specific ability to concentrate the nutrients.
4.4 Carbon (C)
The carbon concentration ranged from 28.5-44.3 % at the inlet (Table 2) with Polygonum species having higher Carbon (40.7-44.3 %). The range of carbon in outlet was 20.5-42 % (Table 3) with Typha angustata having higher carbon (37.9-42%).
4.5 Nitrogen (N)
The concentration of nitrogen was in the range 0.98-3.98 % in inlet (Table 2) and 1.53-4.42% (Table 3) at the outlet. Alternanthera philoxeroides (1.64-3.98 %) at the inlet and Spirodela sp. (3.5-4.42) at the oulet had higher N. N uptake potential varies widely depending on plant species and age, growing season, type of applied wastewater, environmental conditions etc Vymazal (2007) and is related to its net productivity and the concentration in the tissues (Maurizio Borin and Michela Salvato, 2012). N deposition increases the N: P ratio in the plants of terrestrial and freshwater ecosystems, while reducing soil and water N2 fixation capacity and ecosystem species diversity (Sardans et al., 2012).
4.6 Phosphorus (P)
The concentration of phosphorus varied from 0.3-2.22 % at the inlet (Table 2) and 0.95-3.52 % (Table 3) at the outlet with the higher concentrations in Typha angustata (0.97-2.22 %) at the inlet and Spirodela sp. (1.07-3.52 %) at the outlet.
4.7 Heavy metal concentrations in macrophytes
Metal uptake by plants depend on the bioavailability of the metal in water phase, which in turn depends on the retention time of the metal as well as the interaction with other elements and substances in water. The pH, redox potential and organic matter content in the surrounding environment of the metal bound soil or sediment will affect the tendency of the metal to exist in ionic and plant available form (Jackson and kalff, 1993).
4.8 Cadmium (Cd)
Cadmium a highly toxic and non-essential element affects growth, metabolism and creates water stress plants (Divan et al., 2009). Cadmium also produces oxidative stress by releasing free radicals and reactive oxygen species which cause the death of plants by damaging membrane lipids, proteins, pigments and nucleic acids (Foyer et al.,1994). Tables 4 and 5 list species wise Cadmium concentration in plants, which from 0-1.8 mg/kg (inlet) and 0-1.6 mg/kg (outlet), which are within the normal range (Maiti, 2003) and lesser than values reported earlier (Jumbe and Nandini, 2012; Ramachandra et al.,2018) in macrophytes of Bangalore urban lakes. Alternanthera philoxeroides (0-1mg/kg) and Pistia stratiotes (0.2-1.6 mg/kg) accumulated higher amount of Cd.
4.9 Copper (Cu)
Copper at low concentration is essential for plant nutrition and is required for various enzymatic activities and are toxic at higher concentrations Bonanno, (2013), leading to oxidative stress and growth inhibition (Gill, 2014). Tables 4 and 5 list species wise copper concentrations of 0-17.2 mg/kg, which are higher compared to earlier studies (Jumbe and Nandini, 2012). Copper accumulation was higher in the critical range in Typha angustata (0-17.2 mg/kg) at the inlet. It was within normal range in all studied species at outlet with highest accumulation in Ludwigia species (0.6-3.2 mg/kg).
4.1.0 Lead (Pb)
Lead is not essential in plant organs, immobile in soil, tends to accumulate in roots, resulting in a scarce translocation into aboveground organs Bonanno and Lo Giudice (2010) and is toxic. Tables 4 and 5 list species wise the concentration of lead, which are within the normal range, 0-9.8 mg/kg (inlet) and 0-13.6 mg/kg (outlet). Lead accumulation was higher in Alternanthera philoxeroides (0-9.8 mg/kg) at inlet and Typha angustata (3.2-13.6 mg/kg) at outlet.
4.1.1 Zinc (Zn)
Zinc is a vital plant nutrient and plays role in metabolism, plant nutrition and enzymatic activities and concentration above 500 mg/kg is phytotoxic (Maiti, 2003). Its toxicity in plants can lead to poor or reduced root and shoot growth as well as chlorosis of leaves (Gill, 2014). Zinc was within normal range at both the sites. Tables 4 and 5 list the values of Zinc, all samples are in the range 1.5-16.4 mg/kg at inlet and 3-23 mg/kg at outlet. The concentration was higher in Typha angustata (5.2-16.4 mg/kg) at inlet and 3.2-23.0 mg/kg in Typha angustata at outlet.
4.1.2 Nickel (Ni)
The range of Nickel was 0.1-10.4 mg/kg in inlet (Table4) and 0-8 mg/kg in outlet (Table5), which are above normal range in Typha angustata (at inlet) and in all species at the outlet respectively. Nickel concentration was higher in Typha angustata (1.4-10.4 mg/kg at the inlet and 0-8.0 mg/kg at the outlet) and Pistia stratiotes (6-6.2 mg/kg at the outlet) respectively. However, these concentrations were lower compared to the earlier studies (Jumbe and Nandini, 2012; Ramachandra et al.,2018).
4.1.3 Chromium (Cr)
Tables 4 and 5 list species wise Chromium concentrations, which are in the range 0.6-19.6 mg/kg (0.6-14 mg/kg inlet; 2-19.6 mg/kg outlet). Chromium was within normal range in inlet samples but in outlet it was above normal range in Alternanthera philoxeroides species (4.6-19.6 mg/kg). The concentration was higher in Typha angustata (5-14 mg/kg), Polygonum glabrum (8.8-12.0 mg/kg) and Eichhornia crassipes (3-14 mg/kg) at the inlet and Alternanthera philoxeroides (4.6-19.6 mg/kg) at the outlet.
Fig. 3. Species wise Distribution of Macrophyte in Jakkur wetland
Species
Life form
Family
Typha angustata
Emergent
Typhaceae
Alternanthera philoxeroides
Emergent
Amaranthaceae
Polygonum glabrum
Emergent
Polygonaceae
Ludwigia sp
Emergent
Onagraceae
Cyperus sp
Emergent
Cyperaceae
Ludwigia sp
Emergent
Onagraceae
Cyperus sp
Emergent
Cyperaceae
Pistia stratiotes
Free Floating
Araceae
Spirodela polyrhiza
Free Floating
Lemnaceae
Lemna sp
Free Floating
Araceae
Eichhornia crassipes
Free Floating
Pontederiaceae
Table 1: Macrophyte species with the Life form and family details
Typha angustata
Alternanthera philoxeroides
Polygonum glabrum
Eichhornia crassipes
Cyperus sp
Range
Mean
Range
Mean
Range
Mean
Range
Mean
Range
Mean
Biomass (kg/dw)
0.184-0.412
0.29
0.16-0.276
0.2
0.22-0.45
0.33
0.18-0.29
0.256
0.15-0.16
0.157
C (%)
37.1-43.3
40.27
28.5-36.9
32.29
40.7-44.3
43.03
37-39.2
38.6
38.2-43.6
41.3
N (%)
1.52-2.84
2.08
1.64-3.98
2.85
2.58-3.12
2.85
2.15-2.5
2.2
0.98-1.46
1.25
P (%)
0.97-2.22
1.64
0.98-1.31
1.09
0.97-1.55
1.20
0.8-1.42
1.1
0.3-0.65
0.55
Table 2: Biomass and nutrient content of macrophytes at the inlet of Jakkur wetland
Typha angustata
Alternanthera philoxeroides
Ludwigia sp
Pistia stratiotes
Spirodela polyrhiza
Lemna sp
Biomass (kg/dw)
(0.14-1.04) 0.36
(0.16-0.39) 0.23
(0.14-0.22) 0.2
(0.08-0.22) 0.17
(0.04-0.22) 0.11
(0.03-0.2) 0.1
C (%)
(37.9-42) 40.6
(20.5-39.7) 35.17
(35.6-37.2) 36.08
(33.7-33.8) 33.73
(25.7-37.1) 32.97
(30.2-33.4) 31.5
C (%)
(37.9-42) 40.6
(20.5-39.7) 35.17
(35.6-37.2) 36.08
(33.7-33.8) 33.73
(25.7-37.1) 32.97
(30.2-33.4) 31.5
N (%)
(1.53-2.7) 1.85
(1.78-4.24) 3.7
(2.68-3.44) 3.05
(2.63-3.42) 3.16
(3.5-4.42) 4.07
(3-4.1) 3.86
P(%)
(0.95-2.29) 1.31
(0.96-1.4) 1.06
(1.06-1.34) 1.2
(1.09-1.19) 1.12
(1.07-3.52) 1.94
(0.98-2.56) 1.6
Table 3: Mean Biomass (range in parentheses) and nutrient content of macrophytes at the outlet
Metal
Range (mg/kg)
WHO standard
Critical range in plants ( Maiti, 2003)
Normal range in plants (Maiti, 2003)
Typha angustata
Alternanthera philoxeroides
Polygonum glabrum
Eichhornia crassipes
Cyperus sp
Cd
0-0.8
0-1.8
0.2-0.8
0.1-1.8
0-0.9
0.5
5-30
0.1-2.4
Cr
5-14
0.6-10.2
8.8-12.0
3-14
0.8-10
1.3
5-30
0.03-14
Cu
0-17.2
0-2.2
0.8-1.4
0-1.5
0-1.2
40
5-30
1-5
Ni
1.4-10.4
1.4-3.2
0.2-2.4
1.5-4.1
0.1-2.1
10
10-100
0.02-5
Pb
0-9.0
0-9.8
0-5.2
0-8.5
0-4.5
2.0
30-300
0.2-20
Zn
5.2-16.4
2.8-8.6
3.2-9.0
5-14.5
1.5-8.5
60
100-400
1-400
Table 4: Heavy metal concentrations in macrophyte samples at the inlet
Species
Range of metals (mg/kg)
Cd
Cr
Cu
Ni
Pb
Zn
Typha angustata
0-1.4
2-13.2
0-1.8
0-8.0
3.2-13.6
3.2-23.0
Alternanthera philoxeroides
0-1.0
4.6-19.6
0-0.8
0-5.8
0-10.4
3-10.2
Ludwigia sp
0.2-0.6
4-10.6
0.6-3.2
0-6.2
3.6-12.2
6.4-7.8
Pistia stratiotes
0.2-1.6
7-9.6
1.2-2.6
6-6.2
5-8.2
7-8.8
Spirodela polyrhiza
0-1.0
10.6-13.6
0-0.8
0-6.8
2.8-7.6
4-8.8
Lemna sp
0-0.9
4-12.1
0-0.9
0-6.5
1.5-8.5
5-10
Critical range in plants
5-30
5-30
5-30
10-100
30-300
100-400
Critical range in plants ( Maiti, 2003)
5-30
5-30
5-30
10-100
30-300
100-400
Normal range in plants (Maiti, 2003)
0.1-2.4
0.03-14
1-5
0.02-5
0.2-20
1-400
Table 5: Heavy metal concentrations in macrophyte samples at the outlet
Bioremediation potential of Macrophytes in Jakkur Wetland, Bangalore
Sudarshan.P. 1, 2Mahesh M.K 2Ramachandra T.V.1, 3, 4 1 Energy and Wetlands Research Group, Centre for Ecological Sciences, Indian Institute of Science, Bangalore-5600122 Dept. of Botany, Yuvaraja’s College, Mysore-570005 3 Centre for Sustainable Technologies (ASTRA), Indian Institute of Science, Bangalore,
Indian Institute of Science, Bangalore – 560012, India. 4Centre for Infrastructure, Sustainable Transportation and Urban Planning (CiSTUP),
Indian Institute of Science, Bangalore, Karnataka, India
*Corresponding author:cestvr@ces.iisc.ac.in
Macrophyte distribution is related to several environmental and anthropogenic factors such as climate, hydrology, geomorphology, nutrient availability, biological interactions, and the extent of anthropogenic activities (Lacoul and Freedman, 2006; Feldmann and Noges, 2007; Hrivnak et al., 2009). Table 1 lists of 9 species of macrophytes (4 floating and 5 emergent types) belonging to 8 families (5 species from inlet and 6 species from outlet) with life forms. Typha angustata was the dominant species followed by Alternanthera philoxeroides. The percentage composition of macrophytes were given in figure 3.
4.2 Estimation of Biomass
Tables 2 and 3 lists species wise biomass and C, N and P of macrophytes samples at inlet and outlets. Polygonum species had higher biomass at inlet whereas Typha angustata had the higher biomass than other species at the outlet. The biomass range was 0.15-0.412 kg/dw (Cyperus sp. - Polygonum glabrum) at inlet and 0.03-1.04 kg/dw (Lemna sp - Typha angustata) at the outlet. Among all, Typha angustata had the higher biomass compared to others during the study period. Variations in biomass and plant zonation are due to varied growth rates among species depending on the nutrient availability and water level (Pompeo et al., 2001; Blom et al.,1990; Junk and Piedade, 1993; Camargo and Esteves, 1996). The biomass changes are low in the aquatic environment with the minimal variations of water level during seasons (Camargo and Esteves, 1995).
4.3 Nutrient concentrations in macrophytes Estimation of Carbon, Nitrogen and Phosphorus:
Carbon (C), Nitrogen (N) and Phosphorus (P) are the most vital elements for plant morphogenesis, support a variety of cell physiological functions and their absorption and allocation are prove to be essential for all organisms (Sardans et al., 2012). These nutrients limit primary production especially in freshwater ecosystems (Maathius, 2009). All these species vary in their nutrient concentration and their distribution depends on nutrient availability. Plant nutrient concentration varies among sites and seasons and each species have specific ability to concentrate the nutrients.
4.4 Carbon (C)
The carbon concentration ranged from 28.5-44.3 % at the inlet (Table 2) with Polygonum species having higher Carbon (40.7-44.3 %). The range of carbon in outlet was 20.5-42 % (Table 3) with Typha angustata having higher carbon (37.9-42%).
4.5 Nitrogen (N)
The concentration of nitrogen was in the range 0.98-3.98 % in inlet (Table 2) and 1.53-4.42% (Table 3) at the outlet. Alternanthera philoxeroides (1.64-3.98 %) at the inlet and Spirodela sp. (3.5-4.42) at the oulet had higher N. N uptake potential varies widely depending on plant species and age, growing season, type of applied wastewater, environmental conditions etc Vymazal (2007) and is related to its net productivity and the concentration in the tissues (Maurizio Borin and Michela Salvato, 2012). N deposition increases the N: P ratio in the plants of terrestrial and freshwater ecosystems, while reducing soil and water N2 fixation capacity and ecosystem species diversity (Sardans et al., 2012).
4.6 Phosphorus (P)
The concentration of phosphorus varied from 0.3-2.22 % at the inlet (Table 2) and 0.95-3.52 % (Table 3) at the outlet with the higher concentrations in Typha angustata (0.97-2.22 %) at the inlet and Spirodela sp. (1.07-3.52 %) at the outlet.
4.7 Heavy metal concentrations in macrophytes
Metal uptake by plants depend on the bioavailability of the metal in water phase, which in turn depends on the retention time of the metal as well as the interaction with other elements and substances in water. The pH, redox potential and organic matter content in the surrounding environment of the metal bound soil or sediment will affect the tendency of the metal to exist in ionic and plant available form (Jackson and kalff, 1993).
4.8 Cadmium (Cd)
Cadmium a highly toxic and non-essential element affects growth, metabolism and creates water stress plants (Divan et al., 2009). Cadmium also produces oxidative stress by releasing free radicals and reactive oxygen species which cause the death of plants by damaging membrane lipids, proteins, pigments and nucleic acids (Foyer et al.,1994). Tables 4 and 5 list species wise Cadmium concentration in plants, which from 0-1.8 mg/kg (inlet) and 0-1.6 mg/kg (outlet), which are within the normal range (Maiti, 2003) and lesser than values reported earlier (Jumbe and Nandini, 2012; Ramachandra et al.,2018) in macrophytes of Bangalore urban lakes. Alternanthera philoxeroides (0-1mg/kg) and Pistia stratiotes (0.2-1.6 mg/kg) accumulated higher amount of Cd.
4.9 Copper (Cu)
Copper at low concentration is essential for plant nutrition and is required for various enzymatic activities and are toxic at higher concentrations Bonanno, (2013), leading to oxidative stress and growth inhibition (Gill, 2014). Tables 4 and 5 list species wise copper concentrations of 0-17.2 mg/kg, which are higher compared to earlier studies (Jumbe and Nandini, 2012). Copper accumulation was higher in the critical range in Typha angustata (0-17.2 mg/kg) at the inlet. It was within normal range in all studied species at outlet with highest accumulation in Ludwigia species (0.6-3.2 mg/kg).
4.1.0 Lead (Pb)
Lead is not essential in plant organs, immobile in soil, tends to accumulate in roots, resulting in a scarce translocation into aboveground organs Bonanno and Lo Giudice (2010) and is toxic. Tables 4 and 5 list species wise the concentration of lead, which are within the normal range, 0-9.8 mg/kg (inlet) and 0-13.6 mg/kg (outlet). Lead accumulation was higher in Alternanthera philoxeroides (0-9.8 mg/kg) at inlet and Typha angustata (3.2-13.6 mg/kg) at outlet.
4.1.1 Zinc (Zn)
Zinc is a vital plant nutrient and plays role in metabolism, plant nutrition and enzymatic activities and concentration above 500 mg/kg is phytotoxic (Maiti, 2003). Its toxicity in plants can lead to poor or reduced root and shoot growth as well as chlorosis of leaves (Gill, 2014). Zinc was within normal range at both the sites. Tables 4 and 5 list the values of Zinc, all samples are in the range 1.5-16.4 mg/kg at inlet and 3-23 mg/kg at outlet. The concentration was higher in Typha angustata (5.2-16.4 mg/kg) at inlet and 3.2-23.0 mg/kg in Typha angustata at outlet.
4.1.2 Nickel (Ni)
The range of Nickel was 0.1-10.4 mg/kg in inlet (Table4) and 0-8 mg/kg in outlet (Table5), which are above normal range in Typha angustata (at inlet) and in all species at the outlet respectively. Nickel concentration was higher in Typha angustata (1.4-10.4 mg/kg at the inlet and 0-8.0 mg/kg at the outlet) and Pistia stratiotes (6-6.2 mg/kg at the outlet) respectively. However, these concentrations were lower compared to the earlier studies (Jumbe and Nandini, 2012; Ramachandra et al.,2018).
4.1.3 Chromium (Cr)
Tables 4 and 5 list species wise Chromium concentrations, which are in the range 0.6-19.6 mg/kg (0.6-14 mg/kg inlet; 2-19.6 mg/kg outlet). Chromium was within normal range in inlet samples but in outlet it was above normal range in Alternanthera philoxeroides species (4.6-19.6 mg/kg). The concentration was higher in Typha angustata (5-14 mg/kg), Polygonum glabrum (8.8-12.0 mg/kg) and Eichhornia crassipes (3-14 mg/kg) at the inlet and Alternanthera philoxeroides (4.6-19.6 mg/kg) at the outlet.
Fig. 3. Species wise Distribution of Macrophyte in Jakkur wetland
Species
Life form
Family
Typha angustata
Emergent
Typhaceae
Alternanthera philoxeroides
Emergent
Amaranthaceae
Polygonum glabrum
Emergent
Polygonaceae
Ludwigia sp
Emergent
Onagraceae
Cyperus sp
Emergent
Cyperaceae
Ludwigia sp
Emergent
Onagraceae
Cyperus sp
Emergent
Cyperaceae
Pistia stratiotes
Free Floating
Araceae
Spirodela polyrhiza
Free Floating
Lemnaceae
Lemna sp
Free Floating
Araceae
Eichhornia crassipes
Free Floating
Pontederiaceae
Table 1: Macrophyte species with the Life form and family details
Typha angustata
Alternanthera philoxeroides
Polygonum glabrum
Eichhornia crassipes
Cyperus sp
Range
Mean
Range
Mean
Range
Mean
Range
Mean
Range
Mean
Biomass (kg/dw)
0.184-0.412
0.29
0.16-0.276
0.2
0.22-0.45
0.33
0.18-0.29
0.256
0.15-0.16
0.157
C (%)
37.1-43.3
40.27
28.5-36.9
32.29
40.7-44.3
43.03
37-39.2
38.6
38.2-43.6
41.3
N (%)
1.52-2.84
2.08
1.64-3.98
2.85
2.58-3.12
2.85
2.15-2.5
2.2
0.98-1.46
1.25
P (%)
0.97-2.22
1.64
0.98-1.31
1.09
0.97-1.55
1.20
0.8-1.42
1.1
0.3-0.65
0.55
Table 2: Biomass and nutrient content of macrophytes at the inlet of Jakkur wetland
Typha angustata
Alternanthera philoxeroides
Ludwigia sp
Pistia stratiotes
Spirodela polyrhiza
Lemna sp
Biomass (kg/dw)
(0.14-1.04) 0.36
(0.16-0.39) 0.23
(0.14-0.22) 0.2
(0.08-0.22) 0.17
(0.04-0.22) 0.11
(0.03-0.2) 0.1
C (%)
(37.9-42) 40.6
(20.5-39.7) 35.17
(35.6-37.2) 36.08
(33.7-33.8) 33.73
(25.7-37.1) 32.97
(30.2-33.4) 31.5
C (%)
(37.9-42) 40.6
(20.5-39.7) 35.17
(35.6-37.2) 36.08
(33.7-33.8) 33.73
(25.7-37.1) 32.97
(30.2-33.4) 31.5
N (%)
(1.53-2.7) 1.85
(1.78-4.24) 3.7
(2.68-3.44) 3.05
(2.63-3.42) 3.16
(3.5-4.42) 4.07
(3-4.1) 3.86
P(%)
(0.95-2.29) 1.31
(0.96-1.4) 1.06
(1.06-1.34) 1.2
(1.09-1.19) 1.12
(1.07-3.52) 1.94
(0.98-2.56) 1.6
Table 3: Mean Biomass (range in parentheses) and nutrient content of macrophytes at the outlet
Metal
Range (mg/kg)
WHO standard
Critical range in plants ( Maiti, 2003)
Normal range in plants (Maiti, 2003)
Typha angustata
Alternanthera philoxeroides
Polygonum glabrum
Eichhornia crassipes
Cyperus sp
Cd
0-0.8
0-1.8
0.2-0.8
0.1-1.8
0-0.9
0.5
5-30
0.1-2.4
Cr
5-14
0.6-10.2
8.8-12.0
3-14
0.8-10
1.3
5-30
0.03-14
Cu
0-17.2
0-2.2
0.8-1.4
0-1.5
0-1.2
40
5-30
1-5
Ni
1.4-10.4
1.4-3.2
0.2-2.4
1.5-4.1
0.1-2.1
10
10-100
0.02-5
Pb
0-9.0
0-9.8
0-5.2
0-8.5
0-4.5
2.0
30-300
0.2-20
Zn
5.2-16.4
2.8-8.6
3.2-9.0
5-14.5
1.5-8.5
60
100-400
1-400
Table 4: Heavy metal concentrations in macrophyte samples at the inlet
Species
Range of metals (mg/kg)
Cd
Cr
Cu
Ni
Pb
Zn
Typha angustata
0-1.4
2-13.2
0-1.8
0-8.0
3.2-13.6
3.2-23.0
Alternanthera philoxeroides
0-1.0
4.6-19.6
0-0.8
0-5.8
0-10.4
3-10.2
Ludwigia sp
0.2-0.6
4-10.6
0.6-3.2
0-6.2
3.6-12.2
6.4-7.8
Pistia stratiotes
0.2-1.6
7-9.6
1.2-2.6
6-6.2
5-8.2
7-8.8
Spirodela polyrhiza
0-1.0
10.6-13.6
0-0.8
0-6.8
2.8-7.6
4-8.8
Lemna sp
0-0.9
4-12.1
0-0.9
0-6.5
1.5-8.5
5-10
Critical range in plants
5-30
5-30
5-30
10-100
30-300
100-400
Critical range in plants ( Maiti, 2003)
5-30
5-30
5-30
10-100
30-300
100-400
Normal range in plants (Maiti, 2003)
0.1-2.4
0.03-14
1-5
0.02-5
0.2-20
1-400
Table 5: Heavy metal concentrations in macrophyte samples at the outlet
Sudarshan P. Bhat
Energy and Wetlands Research Group, Centre for Ecological Sciences, Indian Institute of Science, Bangalore – 560012, India, Centre for infrastructure, Sustainable Transportation and Urban Planning (CiSTUP), Energy & Wetlands Research Group, Centre for Ecological Sciences, Indian Institute of Science, Bangalore – 560 012, INDIA.
Dept. of Botany, Yuvaraja’s College, Mysore-570005 E-mail : bhat.sudarshanp@gmail.com,
Mahesh M.K Dept. of Botany, Yuvaraja’s College, Mysore-570005
Dr. T.V. Ramachandra
Energy & Wetlands Research Group, Centre for Ecological Sciences, Indian Institute of Science, Bangalore – 560 012, India.
Tel : 91-80-23600985 / 22932506 / 22933099,
Fax : 91-80-23601428 / 23600085 / 23600683 [CES-TVR]
E-mail : emram.ces@courses.iisc.ac.in
Dr. T.V. Ramachandra
Energy & Wetlands Research Group,
Centre for Ecological Sciences, Indian Institute of Science, Bangalore – 560 012, INDIA. Tel : 91-80-23600985 / 22932506 / 22933099 Fax : 91-80-23601428 / 23600085 / 23600683 [CES-TVR] E-mail : emram.ces@courses.iisc.ac.in, tvr@iisc.ac.in ,