Results
Temporal land use analyses (Fig. 5) show a decrease in the evergreen forest cover from 57.31% (1979) to 32.08% (2013). Enhanced agricultural activities are evident from the increase in agricultural land use (Table 2) from 10.02 (1979) to 14.13 % (2013) and areas under human habitation have increased during the last four decades from 0.95% (1979) to 3.07% (2013). In addition to these, various on-going unplanned developmental projects have contributed to the decline in forest cover. The increase in plantations of exotic species such as Acacia auriculiformis, Casuarina equisetifolia, various Eucalyptus spp. and Tectona grandis serve mainly to meet the demand by forest-based industries. These plantations now (2013) constitute 12.04% (Acacia auriculiformis, Casuarina equisetifolia, various Eucalyptus spp) and 6.60% (Tectona grandis) respectively in the district. Degradation of vegetation cover in the coastal zone had triggered a series of landslides in 2009 at 21 locations along a national highway, i.e., NH-17, leading to the loss of property and human life (Ramachandra et al. 2012b). The dry deciduous forest cover is has declined considerably from 2.83% to 0.96% (during 1973 to 2013) and is found mainly in the northeastern part of the district in Mundgod and Haliyal taluks. Accuracy of the classification ranges from 87 to 92% indicating consistent classification results.
Land use changes during the past four decades were estimated using temporal remote sensing data from 1979 to 2013 and are shown in Figure 5 (a, b, c, d). Natural forest categories include moist deciduous, evergreen to semi evergreen, scrub/grass and dry deciduous forest types. Category-wise forest cover is extracted and depicted in Figure 6 (a-d), which helped in assessing the impacts of unplanned developmental activities. Figure 6 (a) illustrates the natural forest cover in 1979 (represented in green color) while Figure 6(d) shows forest cover in 2013. Table 3 provides the spatial extent of forest cover loss during 1979 to 2013. The natural forest cover of 780,778 ha in 1979 was reduced to 733,692 ha by 1989 due to a large scale hydro-electric project at Supa, as well as by the conversion of native forests to monoculture plantations for forest based industries and cultivation. The forest changes during this ten year period was moderate, i.e., a 6.03% reduction, whereas rapid losses were taken place during the period from 1989 to 1999 (forest cover 63.93%) due to implementation of a large number of infrastructure projects, a series of hydroelectric projects, the construction of the Tattihalla and Bommanhalli reservoirs and other associated developments.
The major disturbances noted in the forests of rural areas are due to unauthorized conversion of forest land into agriculture (encroachments), the diversion of forest lands for other purposes and logging of wood by forest based industries. Diversion of forestland under various schemes accounted for the loss of 66,443 ha (KFD 2010). The current area of forest cover is 542,475 ha (52.71%) and forest losses amounted to about 35,021 ha (17.54%) due to unauthorized land conversions and implementation of projects such as the Kodasalli reservoir, the Kadra dam, the Kaiga Nuclear Power plant, the Project Sea Bird, the Gerusoppa dam and others.
Category |
1979 |
1989 |
1999 |
2013 |
ha |
% |
ha |
% |
ha |
% |
ha |
% |
Built-up |
9738 |
0.95 |
12982 |
1.26 |
21635 |
2.1 |
31589 |
3.07 |
Water |
18527 |
1.8 |
16604 |
1.61 |
32983 |
3.21 |
28113 |
2.73 |
Crop land |
103163 |
10.02 |
121167 |
11.77 |
138458 |
13.45 |
145395 |
14.13 |
Open fields |
15988 |
1.55 |
34783 |
3.38 |
21945 |
2.13 |
37660 |
3.66 |
Moist deciduous forest |
102967 |
10.01 |
143849 |
13.98 |
179075 |
17.4 |
161996 |
15.74 |
Evergreen to semi evergreen forest |
589762 |
57.31 |
531872 |
51.68 |
423062 |
41.11 |
330204 |
32.08 |
Scrub/Grass lands |
58936 |
5.73 |
44123 |
4.29 |
47366 |
4.6 |
40402 |
3.93 |
Acacia/Eucalyptus plantations |
50321 |
4.89 |
55694 |
5.41 |
73977 |
7.19 |
122927 |
11.94 |
Teak/Bamboo/plantations |
20896 |
2.03 |
21937 |
2.13 |
38588 |
3.75 |
67111 |
6.52 |
Coconut/Areca nut/Cashew nut plantations |
29675 |
2.88 |
32227 |
3.13 |
43623 |
4.24 |
53993 |
5.25 |
Dry deciduous forest |
29113 |
2.83 |
13848 |
1.35 |
8374 |
0.81 |
9873 |
0.96 |
Total |
1,029,086 |
Overall accuracy (%) |
84.29 |
92.22 |
90.71 |
91.51 |
Kappa |
0.81 |
0.89 |
0.87 |
0.89 |
Table 2 Temporal land use changes from 1979 to 2013 and accuracy assessment
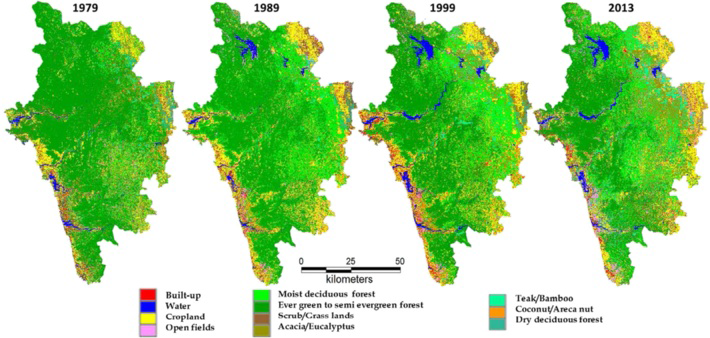
Figure 5 Landuse analysis from 1979‒2013
Year |
Natural forest cover |
Forest loss |
ha |
% |
ha |
% |
1979 |
780778 |
75.87 |
|
1989 |
733692 |
71.3 |
47086 |
6.03 |
1999 |
657877 |
63.93 |
75815 |
10.33 |
2013 |
542475 |
52.71 |
115402 |
17.54 |
Total area (ha) |
1,029,086 |
Table 3 Forest cover change from 1979 to 2013
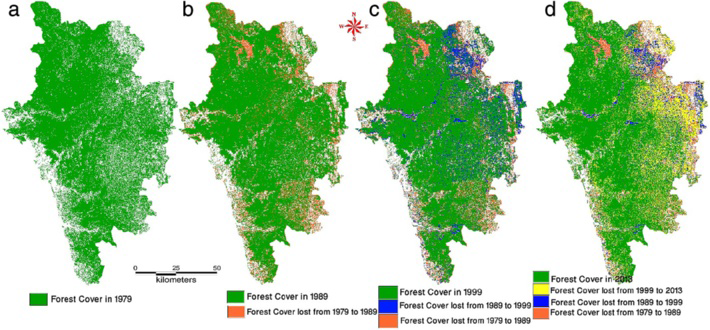
Figure 6 Forest cover in 1979, 1989 and its change (a, b); forest cover in 1999, 2013 and its change (c, d)
Fragmentation of forests at the landscape level was assessed in order to understand the spatial-temporal patterns in forest degradation using temporal land use (1979 to 2013) information. Figure 7 (a, b, c, d) and Figure 8 depict the temporal pattern of the fragmentation process in Uttara Kannada District. Table 4 lists the spatial extent of various types of fragments (interior, perforated, edge, transitional and patch forests). Figure 7 (a) depicts the domination of interior forests (64.42%) in the district. Edge forests (7.32%) are located along linear corridors, such as roads, rivers and boundary pixels of large forest patches. Patch forests are mainly located at the interfaces of forests, intermixed with agriculture and urban classes over small portions. The unscientific forest exploitation by the industrial sector peaked with the impetus of forest based industries during the period from 1960 to the 1980’s leading to selective felling of trees in the evergreen forests (Gadgil and Chandran 1989). This has created canopy gaps and the spread of invasive exotic species, adversely affecting faunal species. Mining activities in the district leave significant ecological, economic and social footprints much beyond the physical boundaries of mines by disrupting continuous forest patches (Ramachandra et al. 2014b).
Figure 7 (b) shows a decline in the area of interior forests from 64.42% (1979) to 53.33% (1989), with increase in edge forests (12%). The major activities during this period were industrialization, infrastructure development, intensified agriculture, manganese mining, a ferromanganese plant, a paper mill and plantations. The provision of forest resources to industries at highly subsidized rates and permission to polluting industries in the ecologically sensitive regions have contributed to the decline of forests and contamination of natural resources. Unplanned developmental activities such as a series of large scale power projects, manganese mining, a ferromanganese plant, a paper mill and several irrigation projects have led to the retreat of forests, with their degradation evident in the form of barren hilltops. The mismanagement of Kans (‘sacred forests’ protected by local communities) and reserve forests also aggravated the situation towards the loss of interior, contiguous forests (Chandran 1989). Figure 7 (c) shows the fragmentation status for the year 1999; the region lost a major portion of its interior forest and reached 40.74% from 53.33% (1989) with the increase in edge forests to 16.35%. Drivers of these changes are the implementation of a series of hydroelectric projects, the construction of national routes NH-17, NH-63, NH-204, the Konkan railway line and other infrastructure projects. Figure 7 (d) illustrates the status of forests (in 2013) with 25.62% interior forests and 17.48% of edge forests, as well as the loss of connectivity between interior forest patches. These interior forests exist now only in the form of protected areas - sanctuaries, protected areas, sacred groves or Kans. The area under non-forests has increased from 36.07 (1999) to 47.3% (2013) with an increase of edge and perforated patches.
Fragment type |
1979 |
1989 |
1999 |
2013 |
ha |
% |
ha |
% |
ha |
% |
ha |
% |
Patch |
3711.73 |
0.36 |
13368.35 |
1.30 |
18043.33 |
1.75 |
30618 |
2.98 |
Transitional |
20369.03 |
1.98 |
33833.24 |
3.29 |
40884.58 |
3.97 |
59435 |
5.78 |
Edge |
75281.05 |
7.32 |
123490.4 |
12.00 |
168266.32 |
16.35 |
179870 |
17.48 |
Perforated |
18517.00 |
1.80 |
14150.94 |
1.38 |
11434.67 |
1.11 |
8909 |
0.87 |
Interior |
662909.2 |
64.42 |
548849.8 |
53.33 |
419248.5 |
40.74 |
263643 |
25.62 |
Non-forest area |
248297.99 |
24.13 |
295393.27 |
28.7 |
371208.6 |
36.07 |
486611 |
47.3 |
Total area |
1,029,086 |
Table 4 Temporal changes in forest fragmentation at landscape level from 1979 to 2013
Figure 7 Forest fragmentation from 1979 to 2013
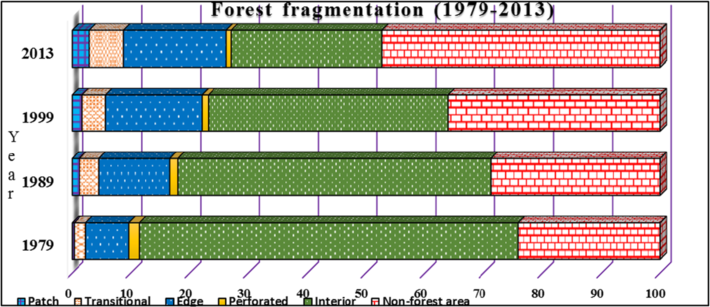
Figure 8 Spatial-temporal pattern of fragmentation from 1979 to 2013 at land scape level
PCA aided in prioritizing bio-geophysical and socio-economic variables and explained the variation in spatial forest cover. Components PC1 and PC2 (for 1979 data) explain a large proportion of the variation (79.67%) (Tables 5 and 6). Axis 1 represents the greater loading of variables such as evergreen to semi evergreen forest, dry deciduous forest, moist deciduous forest, slope, rainfall, and scrub/grass land. Axis 2 represents elevation, population density and other physical factors indicating that Supa, Siddapur and Ankola taluks with greater slopes had higher forest cover. Elevation as a variable had a partial effect on scrub/grass, while moist deciduous forest types in the Sirsi and Yellapura taluks formed clusters. Coastal taluks (Karwar, Kumta, Honnavar) suggest the effect of the variables slope and rainfall. Mundgod represents the effect of dry a deciduous and moist deciduous cover.
PC |
Eigenvalue |
% variance |
Cumulative variance (%) |
1 |
4.63 |
57.90 |
57.90 |
2 |
1.74 |
21.77 |
79.67 |
3 |
0.65 |
8.10 |
87.77 |
4 |
0.45 |
5.67 |
93.44 |
5 |
0.28 |
3.48 |
96.91 |
6 |
0.22 |
2.79 |
99.71 |
7 |
0.02 |
0.21 |
99.91 |
8 |
0.01 |
0.09 |
100.00 |
Table 5 Component loadings & variance for the year 1979
Variables |
Axis 1 |
Axis 2 |
Axis 3 |
Axis 4 |
Axis 5 |
Axis 6 |
Axis 7 |
Axis 8 |
Moist deciduous forest |
‒0.89 |
0.04 |
‒0.19 |
‒0.11 |
0.19 |
0.35 |
0.03 |
0.01 |
Evergreen to semi evergreen forest |
0.93 |
0.27 |
‒0.06 |
0.11 |
‒0.17 |
0.08 |
0.06 |
0.05 |
Scrub/grass |
‒0.70 |
0.28 |
0.56 |
‒0.33 |
‒0.02 |
‒0.06 |
0.02 |
0.02 |
Dry deciduous |
‒0.92 |
0.02 |
‒0.29 |
0.12 |
0.10 |
‒0.22 |
‒0.03 |
0.05 |
Elevation |
0.25 |
0.84 |
0.25 |
0.34 |
0.22 |
0.05 |
‒0.03 |
0.00 |
Slope |
0.88 |
‒0.04 |
‒0.10 |
‒0.24 |
0.36 |
‒0.15 |
0.04 |
0.00 |
Rainfall |
0.87 |
‒0.43 |
0.14 |
‒0.13 |
0.07 |
0.14 |
‒0.08 |
0.03 |
Population density |
‒0.24 |
‒0.83 |
0.34 |
0.34 |
0.12 |
0.00 |
0.04 |
0.01 |
Table 6 Component variances for the year 1979
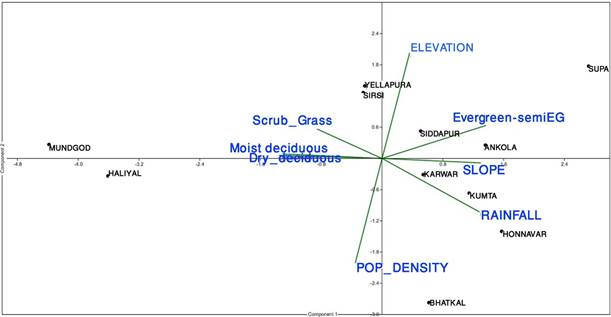
Figure 9 Principal component analysis for 1979
Together, PC1, PC2 and PC3 (based on 2013 data) explain a large proportion of the variation (88.04%) presented in Tables 7 and 8. Axis 1 indicates the higher loadings of the variables evergreen, rainfall, slope, scrub/grass and dry deciduous forests. Axis 2 represents elevation, moist deciduous and population density. Supa and Ankola taluks have evergreen forests cover on slopes and edge effects are observed towards the periphery due to road network. Forest transitions in the Ankola, Kumta, Honnavar and Karwar (coastal) taluks have lost major forest cover towards the west side due to agriculture and aquaculture activities. The Bhatkal taluk has experienced loss of evergreen cover over the 1979 to 2013 period at its lower slopes due to intense activities of agriculture, plantations and other anthropogenic activities. Haliyal and Mundgod taluks have lost deciduous forest cover due to agricultural land expansions with the construction of reservoirs. Our analyses substantiate the role of geophysical variables in the changes of vegetation cover. However, further analyses are required in order to account for the nonlinear relationships among variables, since land transformations are often associated with nonlinear dimensions of human demand, government policies and socio-economic factors (Gong et al. 2011).
PC |
Eigenvalue |
% variance |
Cumulative variance (%) |
1 |
3.748 |
46.852 |
46.85 |
2 |
2.159 |
26.991 |
73.84 |
3 |
1.135 |
14.193 |
88.04 |
4 |
0.572 |
7.149 |
95.19 |
5 |
0.255 |
3.192 |
98.38 |
6 |
0.094 |
1.178 |
99.55 |
7 |
0.024 |
0.299 |
99.85 |
8 |
0.012 |
0.145 |
100.00 |
Table 7 Component loadings for the year 2013
Variables |
Axis 1 |
Axis 2 |
Axis 3 |
Axis 4 |
Axis 5 |
Axis 6 |
Axis 7 |
Axis 8 |
Moist deciduous forest |
0.10 |
0.76 |
0.62 |
‒0.08 |
‒0.11 |
‒0.06 |
0.03 |
0.06 |
Evergreen to semi evergreen forest |
0.85 |
‒0.01 |
‒0.43 |
‒0.05 |
0.23 |
‒0.16 |
0.03 |
0.04 |
Scrub/grass |
0.75 |
‒0.40 |
0.14 |
‒0.48 |
0.03 |
0.16 |
0.04 |
0.01 |
Dry deciduous forest |
‒0.92 |
‒0.17 |
‒0.28 |
0.11 |
0.08 |
0.12 |
0.00 |
0.07 |
Elevation |
0.05 |
0.94 |
0.02 |
0.05 |
0.32 |
0.11 |
‒0.01 |
‒0.03 |
Slope |
0.84 |
0.13 |
‒0.16 |
0.46 |
‒0.16 |
0.10 |
0.07 |
0.00 |
Rainfall |
0.93 |
‒0.22 |
0.20 |
0.18 |
0.02 |
0.04 |
‒0.12 |
0.03 |
Population density |
‒0.17 |
‒0.67 |
0.63 |
0.26 |
0.24 |
‒0.02 |
0.04 |
‒0.01 |
Table 8 Component variances for the year 2013
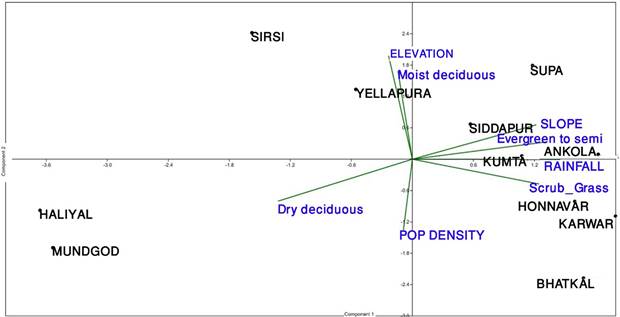
Figure 10 Principal component analysis for 2013
Discussion
Forest clearing due to anthropogenic activities has been a major ecological problem (Laurance 1999; Etter et al. 2006), affecting biodiversity. Fragmentations of forests have resulted in habitat destruction and changes in the dispersal and migration processes (Armenteras et al. 2003; Etter et al. 2006; Eldegard et al. 2015). Shrinkages in animal habitat have led to inbreeding pressure, resulting in the extirpation of species, highlighting the intimate relationship between species and habitat. Edges contain communities different from interior forests due to an altered climate with higher light availability, loss of soil moisture, increased incursion of predators and competitors. As a consequence of fragmentation, changes in microclimatic near edges have favored the establishment of alien species such as Lantana camara,Chromolaena odorata and other species.This has caused a decline in the of native species, particularly in forests highly fragmented by transmission lines such as in the Haliyal and Mundgod taluks and at the lower slopes of Supa and Sirsi taluks. Forest patches shelter rare endemic species in human dominated landscapes. Studies have reported their role in pollination, maintenance of different life cycle phases of species, diversity and seed dispersal by harboring honey bees, small mammals, avifauna survival and many others (Bodin et al. 2006; Page et al. 2010). The Uttara Kannada District with relic forests (sacred forests/ groves) and highly productive landscapes conserve local biodiversity and offer important ecological services, as well as improvement in the livelihood of local communities (Ray and Ramachandra 2010). These intact forests provide shelter for wild fauna and also benefit village communities with an array of forests goods and services such as hydrological functions, fuel wood and timber.
Forest fragmentation analyses provide vital insights to the potential effects of human disturbances (Hobbs and Yates 2003), through spatial descriptors of landscapes besides social and economic factors. The analysis of spatial patterns of forest changes should aid in formulating appropriate management strategies to conserve these threatened ecosystems. Analyses of forest changes are possible due to the availability of temporal remote sensing data. However, the spatial resolution of remote sensing data plays an important role in the analysis of spatial landscape patterns. Kernel sizes and resolution are intimately related in fragmentation analysis. Smaller kernel sizes have the effect of decreasing the average inter patch distance by considering smaller patches in the neighborhood, which also reduces the edge effect. Fragmentation analysis is also affected by up-scaling the resolution of remote sensing data as changes in spatial heterogeneity on a micro scale may not be detected using coarse spatial resolutions (Kitron et al. 2006). Bharath HA et al. (2012) has elucidated the dependency of the role of spatial resolution on measuring landscape structures in order to understand the different landscape patterns. The results reveal that landscape metrics based on area or patch cover are sensitive to spatial resolution. Fragmentation indices are also explicit in sensitivity across various spatial resolutions of remote sensing data. Gupta et al. (2000) highlights the problem of upscaling data by comparing correlations among reflectance and areas of land use categories. Their results indicate the loss of land use information of about 40 % in proportion where upscaling was performed.
Kernel sizes and resolution are intimately related in fragmentation analysis. The kernel or scale size can be consistent with respect to the pixel resolution and an increase of kernel size does not change the input data but increases the width of the non-interior classes, at the expense of interior forests, which maintain their overall proportion and the shapes of their features. Ostapowicz et al. (2008) explains the relationship between the resolution and kernel size by assessing and monitoring the structure of landscape patterns from multi-scale land-cover maps. Riitters et al. (2004) demonstrated the appropriateness of 5 × 5 kernel at a nominal resolution of 30 m. The scale effects on different forest composition and configuration were appraised by sensitivity analysis with various combinations of pixel size and kernel size parameters and comparing frequencies of pattern classes in the entire forest area under study.
Reforestation and afforestation practices have been helpful in partially addressing the negative consequences of forest loss, through carbon sequestration, erosion control and non-consumptive use of forest products. However, the introduction of exotic species would impact the native forest patches in the neighborhood (Shigesada and Kawasaki 1997; Ramachandra et al. 2013). The introduction of Acacia auriculiformis, Tectona grandis and other exotic species in the forested regions and grasslands of this district has appalling effects on biodiversity due to habitat destruction, decline in water resources and unavailability of food especially for grazing mammals, which in turn has affected the prey stock of wild carnivores (Rao et al. 2012). Many commercial plantations have come up in the valleys by removing the natural vegetation, even in places with ecologically important ecosystems such as the Myristica swamps (Chandran and Mesta 2001). In this context, the current conservation strategy needs to focus on the local regeneration of natural forests and maintain continuity of forests, which helps in sustaining the livelihood of dependent populations. This requires motivation, conviction and commitment among major stakeholders, i.e., the forest fringe dwellers as well as forest officials. Restoration of forests with native species at watershed levels will help in mitigating the impact of forest fragmentations and improve hydrological services and biodiversity. The existing village grazing lands needs to be demarcated and managed by involving local stakeholders. This would help in mitigating grazing impacts in natural forests and also improves the prospects of forest regeneration. Prohibition of clear felling in the intact primeval forests would aid in preserving the structure of this ecosystem while enhancing its functional aspects. Joint management of forests by involving all stakeholders - local communities and others, would help in curtailing illegal logging, encroachments, wildlife protection and sustainable management of forests.
Citation : Ramachandra T.V., bharath Setturu, Subash chandran, Geospatial analysis of fragmentation in uttara kannada district,India, T V et al. Forest Ecosystems (2016) 3:10DOI 10.1186/s40663-016-0069-4
|