|
Material and Methods
3.1. Study Area
The Uttara Kannada district with a spatial extent of 10,291sq.km is situated at 74°9' to 75°10' E and 13° 55' to 15° 31' N in the north-western part of Karnataka state (Fig. 2). It extends from north to south to a maximum of 180 km, and from west to east a maximum width of 110 km. Uttara Kannada is bounded by Belgaum district and Goa state in the north, Dharwad and Haveri districts in the east, Shimoga and Udupi districts in the south and the Arabian Sea to the west.
The district has the coastline of 120 km. in the western part. The coast stretches in a long nearly straight line to the south except the shallow Karwar and Belekeri bays (Kamath 1985). The topography of the region can be divided into three distinct zones. The coastal zone, comprising of a narrow strip of the coastline is relatively flat and starts sloping gently upwards towards the east. The ridge zone abruptly rises from the coastal strip, is much more rugged and is a part of the main range of the Western Ghats. Compared to other parts of the Western Ghats, the altitude of the ridge is much lesser and rises to about 600msl. The third zone is the flatter, geographically more homogenous zone that joins the Deccan plateau.
The four major rivers of the district are Kalinadi, Gangavali, Aghanashini and Sharavathi. Varada, Venkatapura, Belekeri, Badagani are some of the minor river and streams in the district. Apart from these river system, large number of other wetlands such as lakes, reservoirs, ponds, puddles, lateritic bogs, wet grasslands, marshes, swamps are present in the district (Ramachandra and Ganapathy 2007; Rao et al. 2008). The district comprises of 11 Taluks namely, Supa, Haliyal, Mundgod, Yellapur, Karwar, Ankola, Sirsi, Siddapur, Honnavar, Kumta and Bhatkal. Supa is the largest taluk in Uttara Kannada in terms of area. The district has 11 taluks (an administrative sub-division for dissemination of the government programmes) spread over the three regions described above. The coast lands comprise of Karwar, Ankola, Kumta, Honnavar and Bhatkal taluks, the forested interior areas which are part of the Western Ghats range comprises of Supa, Sirsi, Siddapur, major parts of Yellapur taluk and the eastern areas which are plateau regions comprises of Haliyal, Mundgod and parts of Yellapur taluks. The climate of the region is tropical monsoon. Generally, the weather is hot and humid in the coastal areas throughout the year. The district experiences south-west monsoon and the rainfall are received mostly between June and September. Average annual rainfall in the district is about 2887 mm which ranges from 4172 mm in Bhatkal taluk to 1345 mm in Haliyal taluk. Population density ranges from 0.26 (Supa) to 4.28 (Bhatkal) persons/hectare with an average of 1.69 &plusmin;1.09. Spatial extent of forest ranges from 48.14 (Mundogod) to 86.5 (Supa) percent of the respective taluk.
3.2.Vegetation of Uttara Kannada District
There are mainly five different types of forest in the district – Evergreen, Semi-evergreen, Moist deciduous, Dry deciduous and Scrub land. The district’s high rainfall supports lush green forests, which cover approximately 70 percent of the district. Uttara Kannada vegetation is divided into 5 broad zones by Daniels (1989) namely, Coastal zone, Northern evergreen zone, Southern evergreen zone, moist deciduous zone and dry deciduous zone. Uttara Kannada has 21 habitat types according to Daniels (1989), based on a study in 181, 5x5 km grids. They are, Evergreen forests(65 percent), Rocky cliffs (14%), Degraded evergreen thickets (17%), Moist grasslands (9%), Moist/dry teak (29%), Humid betelnut (50%), Freshwater marshes (25%), Exotic tree plantations (25%), Rivers (10%), Hill streams (55%), Coastline (9%), Beaches (6%), Coastal coconut (9%), Estuaries (5%), Scrub (2%), Dry deciduous forest (5%), Moist/Dry Bamboo forests (6%), Moist/Dry cultivation (31%), Moist/ Dry Eucalyptus (10%), Moist Deciduous forests (18%), Urban population > 1000 (22%). However, in the last few years the evergreen forests of the district have undergone tremendous changes. Most of the evergreen forested area has been transformed into semi-evergreen forests, and some have been converted into plantations such as, Teak, Arecanut, Acacia spp., etc. (Ramachandra and Ganapathy 2007). It is found that evergreen and semi-evergreen to moist deciduous forest types predominate the forested area of Uttara Kannada (Fig. 2). The complete stretch of the central ridge zone (Ghats section), which was once dominated by the evergreen forests, is now dominated by the semi-evergreen forest. Evergreen is seen in patches mainly towards the south-west and in the Ghats section. Moist deciduous is seen in almost all places distributed throughout the district. It is more common in the eastern Sirsi, south of Yellapur, eastern Siddapur and western region of the coastal taluks. Dry deciduous forests are spotted in the taluks of Mundgod, Haliyal, western Sirsi and north-eastern part of Yellapur.
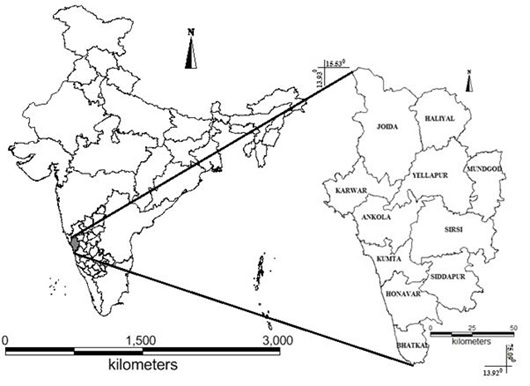 Fig. 2. Uttara Kannada district, Karnataka state
Figure 3 depicts the land use in the district based on the analysis of IRS P6 (Indian remote sensing) multi spectral data of spatial resolution 5.8 m. Area under forest covers 72 percent of the total geographic area of the district (Fig. 4). The forest cover ranges from 50 percent in Mundgod taluk to 88 percent in Supa and Yellapur taluks. The forest was categorized as evergreen, semi evergreen to moist deciduous, dry deciduous, teak and bamboo plantations, scrub forest and grasslands and acacia plantations. Table 1 illustrates that about 53 percent of the total forest land in the district is of evergreen type followed by 21 percent of semi-evergreen to moist deciduous forests. Dry deciduous forests are very less and are found in the eastern part of Haliyal and Mundgod taluk. There has been a significant amount of forest loss owing to various developmental activities across district and conversion of natural forests into plantations. Taluks such as Ankola, Bhatkal, Honnavar, Karwar, Siddapur and Supa has rich presence of evergreen forest out of the total forest area, whereas the least share of evergreen forest is found in Mundgod and Haliyal taluks. The share of semi evergreen to moist deciduous forest out of total forest area is found to be highest in Sirsi taluk. A considerable share of forest area in Haliyal and Mundgod taluks is comprised of plantations of teak, acacia and bamboo.
Fig. 2. Uttara Kannada district, Karnataka state
Figure 3 depicts the land use in the district based on the analysis of IRS P6 (Indian remote sensing) multi spectral data of spatial resolution 5.8 m. Area under forest covers 72 percent of the total geographic area of the district (Fig. 4). The forest cover ranges from 50 percent in Mundgod taluk to 88 percent in Supa and Yellapur taluks. The forest was categorized as evergreen, semi evergreen to moist deciduous, dry deciduous, teak and bamboo plantations, scrub forest and grasslands and acacia plantations. Table 1 illustrates that about 53 percent of the total forest land in the district is of evergreen type followed by 21 percent of semi-evergreen to moist deciduous forests. Dry deciduous forests are very less and are found in the eastern part of Haliyal and Mundgod taluk. There has been a significant amount of forest loss owing to various developmental activities across district and conversion of natural forests into plantations. Taluks such as Ankola, Bhatkal, Honnavar, Karwar, Siddapur and Supa has rich presence of evergreen forest out of the total forest area, whereas the least share of evergreen forest is found in Mundgod and Haliyal taluks. The share of semi evergreen to moist deciduous forest out of total forest area is found to be highest in Sirsi taluk. A considerable share of forest area in Haliyal and Mundgod taluks is comprised of plantations of teak, acacia and bamboo.
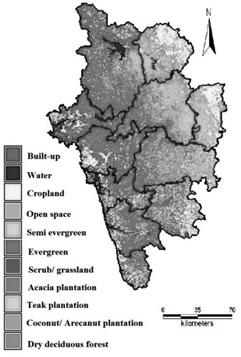 Fig. 3. Land-use classification map of Uttara Kannada district
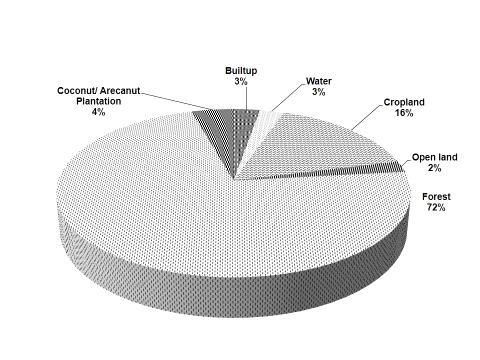 Fig. 4. Share of different land use in Uttara Kannada district
| Evergreen forest |
Semi evergreen to moist deciduous forest |
Dry deciduous forest |
Teak / Bamboo plantations |
Scrub forest/ Grass lands |
Acacia/ Eucalyptus plantations |
Total |
| 53.02 |
20.60 |
0. 19 |
4. 75 |
4. 19 |
17.24 |
100.00 |
Table 1: Vegetation Distribution in Uttara Kannada
3.2. Method
The framework for incorporating the true value of forest requires thorough valuation of the benefits derived from forest ecosystems. Taluk wise forest valuation has been done through the quantification of goods, estimation of values based on the market price, and compilation of values of ecosystem services from literatures. Total economic value of the forest ecosystems in Uttara Kannada has been done considering
i)provisioning services,
ii) regulating services,
iii) supporting services and
iv) information services (MEA 2003).
Various components of provisioning, regulating, cultural and supporting services are listed in Figure 5. The research includes compilation of data from primary (field investigations) and secondary sources (government agencies, published scientific literatures in peer reviewed journals). Data on quantity of timber and non – timber forest products harvested were collected from Divisional Office (Sirsi) of Karnataka Forest Department, Government of Karnataka. Data on the prices of various marketed forest products were collected through market survey. Data on various other provisioning goods and services were compiled from literature pertaining to ecological and socio-economic studies in the district and also through interview with the subject experts.
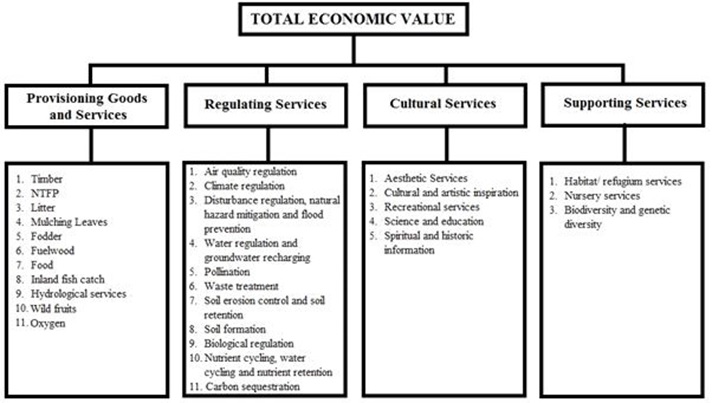 Fig. 5. Classification of forest ecosystem goods and services
3.3.Framework of Valuation
Figure 6 outlines the method adopted for valuing forest ecosystems (taluk wise) in Uttara Kannada district. The work entails:
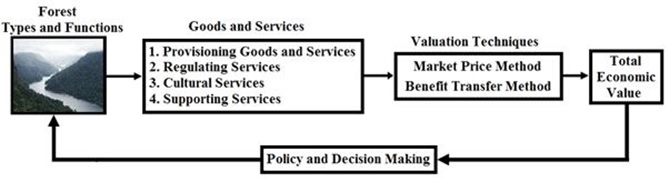 Fig. 6. Framework for valuation of goods and services from forest ecosystem
- Assessment of Different Land Uses in the District: This was done considering remote sensing data of space borne sensors (IRS P6) with spatial resolution of 5.8m. The remote sensing data were geo-referenced, rectified and cropped pertaining to the study area. Geo-registration of remote sensing data has been done using ground control points collected from the field using pre calibrated GPS (Global Positioning System) and also from known points (such as road intersections, etc.) collected from georeferenced topographic maps published by the Survey of India (1:50000, 1:250000). Remote sensing data analysis involved
i) generation of False Colour Composite (FCC) of remote sensing data (bands – green, red and NIR). This helped in locating heterogeneous patches in the landscape
ii) selection of training polygons (these correspond to heterogeneous patches in FCC) covering 15 percent of the study area and uniformly distributed over the entire study area
iii) loading these training polygons co-ordinates into pre-calibrated GPS
iv) collection of the corresponding attribute data (land use types) for these polygons from the field.GPS helped in locating respective training polygons in the field
v) supplementing this information with Google Earth(http://earth.google.com)
vi) 60 percent of the training data has been used for classification, while the balance is used for validation or accuracy assessment.
Land use analysis was carried out using supervised pattern classifier - Gaussian maximum likelihood algorithm based on probability and cost functions (Ramachandra et al. 2012, 2016a). Accuracy assessment to evaluate the performance of classifiers was done with the help of field data by testing the statistical significance of a difference, computation of kappa coefficients and proportion of correctly allocated cases. Statistical assessment of classifier performance based on the performance of spectral classification considering reference pixels is done which include computation of kappa (k) statistics and overall (producer’s and user’s) accuracies.
The forest was classified as evergreen, semi evergreen to moist deciduous, dry deciduous, teak and bamboo plantations, scrub forest and grasslands and acacia plantations. The extent of forest fragmentation was assessed for estimating the carbon sequestration potential of forests through the quantification of the extent of interior and fragmented forests at taluk level.
- Quantification of Goods and Services: compilation of data from primary (field investigations) and secondary sources (government agencies, published scientific literatures in peer reviewed journals). Data on quantity of timber and non – timber forest products harvested were collected from Divisional Office (Sirsi) of Karnataka Forest Department, Government of Karnataka.
- Valuation of Goods and Services: Various functions of forests are the results of interaction between structure and processes, which may be physical (for example, infiltration of water, sediment movement), chemical (for example, reduction, oxidation) or biological (for example, photosynthesis and de-nitrification). Further, various goods and services obtained from the functioning of forest ecosystem were classified as provisioning goods and services, regulating services, cultural services and supporting services. The study uses two approaches of valuation for the computation of TEV of forest ecosystem, namely: ‘market price’ method and ‘benefit transfer’ method of valuation.
a.Market Price: This technique estimates the economic values of those goods and services that are bought and sold in established markets. Valuation of provisioning goods and services has been done through ‘market price’ valuation. For those goods and services which do not pass through market transaction process (viz. water utilization for irrigation and power generation, ecological water, wild fruits) well adopted technique of proxy/ shadow prices have been used.
b.Benefit Transfer: This technique involves the application of value estimates, functions, data and/or models developed in one context to address a similar resource valuation question in an alternative context. The cost of surveys in terms of time and money could be avoided by this approach. Benefit transfer method of valuation is used to compute the value of regulating, cultural and supporting services. Some of the components of these services were computed based on unit values of those services for different types of forest based on the discussion and interview with subject experts.
- Quantification of Goods and Services: The detailed procedure of valuation of different components of ecosystem services is discussed below:
a. Provisioning Services from Forest Ecosystem: Goods derived from the forests are quantified as follows:
- Timber: Timber is an important component of value on forestland properties. In many cases, the value of the timber can be several times the value of the land. Timber includes rose wood, teak wood, jungle wood, etc. Timber is mainly prominent in deciduous forest while it is found in less amount in Evergreen forest patches. Plantation forest is mainly abundant in timber producing trees like Acacia, Teak etc. Industrial produce is also present from the forest which includes round wood, soft wood, match wood etc. The data regarding the quantity of timber harvested and sold was obtained from the Karnataka Forest department (KFD 2015) and the valuation is based on the current market price.
- Non Timber Forest Product: The data on the harvesting of non-timber forest product was obtained from the Forest department. The total value of NTFP includes the value of a) NTFPs extracted by Forest Department, b) NTFPs collected by households (Murthy et al. 2005), c) bamboo extracted by the Karnataka Forest department, d) annual bamboo productivity in the forest (NABARD 2015; WCPM 2016), e) cane extracted by Forest department and f) annual cane productivity in the forest .
- Litter: Litter is used as manure in horticulture and agriculture fields. Quantity of litter productivity per year for different taluks was based on the earlier work (Ramachandra et al. 2000).
- Mulching Leaves: Mulching leaves is used as manure in arecanut gardens. Per year requirement of mulching leaves from forest were quantified by the area of arecanut gardens in each taluka multiplied by the minimum quantity of mulching leaves per hectare of arecanut garden.
- Fodder: Total value of fodder supplied from forest were quantified by using the data from literature (Prasad et al. 1987a,b) on herb layer productivity in different types of forests, extent of different types of forest and unit market price of the fodder in the district.
- Medicinal Plants: Various medicinal plants used by the local people were identified (Harsha et al. 2005; Hegde et al. 2007) and the value of medicinal plants per unit area of forest area (Simpson et al. 1996; Database of Medicinal Plants 2015; SCIL 2015) was extrapolated to different types of forest in the district.
- Fuel Wood: The total value of fuel wood includes the value of fuel wood used for domestic purpose, that is, for cooking and water heating and also the value of fuel wood used for various industrial and commercial purposes like jaggery making, areca processing, cashew processing, restaurants and bakery, parboiling, cremation, etc. The quantity of fuel wood for domestic usage in different locations of the district was obtained from Ramachandra et al. (2000) and the quantity of fuel wood required for various other purpose were based on field experiments (Ramachandra et al. 2000; Ramachandra 1998).
- Food: 22 varieties of food products derived from forest were identified and the value of food extracted per unit area of forest obtained from literature (Hebbar et al. 2010; PSP 2016; SCIL 2015) was extrapolated to the total forest area in the taluk. Also, the household honey collection which is an important provisioning service from forest was quantified (Ramachandra et al. 2012) for all talukas and valued.
- Inland Fish Catch: Inland fishing is an important economic activity and a determinant of nutritional requirement of large number of people. Inland fishing happens in rivers, rivulets, streams, reservoirs, lakes, etc. which are inseparable part of the forest area in the district. The quantities of inland fish catch in different taluks were obtained from Fisheries Department, The Government of Karnataka and the economic value of it was determined.
- Hydrological Services: Most of the water resources come from the forested catchments. Hydrological services is quantified by the quantity of domestic water utilization, water for irrigation purpose (Ramachandra et al. 1999, 2012, 2016a), water for industrial use and water used for power generation (5 hydro power stations and 1 nuclear power station). The quantity of water required for sustenance of forest ecosystem that is, ecological water available for different types of forest was quantified as per the following equation (Ramachandra et al. 1999; 2016a; 2016b; Raghunath 2006; KPCL 2016; NPCIL 2016; Ray et al. 2015).
- Quantity of Ecological Water = Run off Coefficient x Annual Precipitation x Forest Area The value of ‘runoff coefficient’ for different types of forest varied from 0.1 to 0.4.
- Wild Fruits: Information on various wild fruits were obtained from literature (Hebbar et al. 2010; Bhat et al. 2003). The productivity of wild fruits was estimated based on Bhat et al. (2003), transect survey data in different types of forest and information from local people. For economic valuation of wild fruits proxy price (in comparison with the price of fruits collected as NTFP) was used.
- Oxygen Provision: Value of oxygen provision from forests was quantified based on the values of oxygen production per hectare of subtropical forest (Maudgal and Kakkar 1992).These provisioning services were valued as per the equations in Table 2 based on market price method.
| Provisioning services |
Equation |
Details |
| Timber |
VTimber = ∑11i = 1 ∑6j = 1 Qij * Pij |
Q=Quantity of timber; P = Price of timber, i= no of taluks; j = variety of timber |
| NTFP |
VNTFP = ∑11i = 1 ∑30j = 1 Qij * Pij |
Q=Quantity of litter; P = Price of litter; i = no. of taluks |
| Litter |
VLitter = ∑11i = 1 Qi * Pi |
Q=Quantity of NTFP; P = Price of NTFP; i = no.of taluks; j = variety of NTFP |
| Mulching Leaves |
VMulc = ∑11i = 1 Qi * Pi |
Q=Quantity of mulching leaves; P = Price of mulching leaves; i = no. of taluks |
| Fodder |
VFodder = ∑11i = 1 Qi * Pi |
Q=Quantity of fodder; P = Price of fodder; i = no. of taluks |
| Fuelwood |
VFuelwood = ∑11i = 1 Qi * Pi |
Q=Quantity of fuelwood; P = Price of fuelwood; i= no. of taluks |
| Food |
VFood = ∑11i = 1 ∑22i = 1 Qij * Pij |
Q=Quantity of food; P = Price of food; i = no. of taluks; j = variety of food product |
| Inland Fish Catch |
VFish = ∑11i = 1 Qi * Pi |
Q=Quantity of fish catch; P = Price of fish; i = no.of taluks |
| Hydrological Services |
VWater = ∑11i = 1 Qi * Pi |
Q=Quantity of water utilization for different purpose; P = Price of water used for different purpose; i = no. of taluks |
| Wild Fruits |
VWild Fruits = ∑11i = 1 Qi * Pi |
Q=Quantity of wild fruits; P = Price of wild fruits; i = no. of taluks |
| Oxygen |
Value of oxygen provision from forests was quantified based on the values of oxygen production per hectare of subtropical forest (Maudgal and Kakkar 1992). |
Table 2: Valuation method for comonents of provisioning services of forest
b. Regulating Services from Forest Ecosystem: Regulating services provide many direct and indirect benefits to humans. The maintenance of the Earth’s biosphere in a hostile cosmic environment depends on a delicate balance between these regulating services (de Groot et al. 2002). However, regulating services unlike provisioning services poses much greater challenges in valuation. Though regulating services are seldom marketed, the economy heavily depends upon the utility of these services. In the present study,ten variables of regulating services were quantified as per the published literatures (Costanza et al. 1997; Maudgal and Kakkar 1992; Seema and Ramachandra 2010), given in Table 3 and the value of carbon sequestration was estimated for each taluk based on the biomass stock and productivity (Ramachandra et al. 2000, 2004; Maudgal and Kakkar 1992; Seema and Ramachandra 2010).
The value of carbon sequestration has both flow and stock value. The productivity of biomass per hectare per year and the volume of standing biomass for different types of forests of Uttara Kannada were obtained from literature (Ramachandra et al. 2000, 2004; Seema and Ramachandra 2010). The volume of carbon was computed with the assumption that 50 percent of the dry biomass contains carbon (Seema and Ramachandra 2010). The value of carbon sequestration was calculated by considering 10 Euros per tonne of CO2 (EEC 2012). The total value of carbon sequestration per year for different taluks includes the value of per year increment in the carbon sequestration and per year value of interest (considering 5% interest rate) over the total stock/ volume of carbon in the forest till date.
| Regulating services |
Unit value(Rs. per hectare) |
| Air quality regulation |
6384 |
| Climate regulation |
10704 |
| Disturbance regulation, natural hazard |
217872 |
| mitigation and flood prevention Water regulation and groundwater |
261360 |
| recharging Pollination |
1200 |
| Waste treatment |
4176 |
| Soil erosion control and soil retention |
11760 |
| Soil formation |
480 |
| Biological regulation |
1104 |
| Nutrient cycling, water cycling and nutrient retention |
44256 |
Table 3: Uni t values of regulating services from forests (Rs. per hectare)
c. Cultural Services from Forest Ecosystem: Forest has a high cultural value; the main reason can be attributed to the aesthetic beauty, recreational benefit and Kan forest which are the sacred groves present in the district. Sacred groves are communally-protected forest fragments with significant religious connotations (Ray and Ramachandra 2011; Ray et al. 2015). Further, recreational benefits provided by the forest include gaming, walking, hunting etc. Aesthetic beauty of the forest is valuable, the presence of waterfalls and caves adds to the aesthetic value in the district. Science and educational value provided by the forest are also indispensable. The unit value for the services, listed in Table 4 was derived from de Groot et al. (2002) and Costanza et al. (1997), and also the values were finalized in consultation with subject experts.
| S. No. |
Cultural services |
Value (in Rs./ hectare) |
Source |
| 1.a |
Recreational services (for interior evergreen forest) |
2, 88,000 |
de Groot et al. 2002 |
| 1.b |
Recreational services (for other types of forest) |
28, 944 |
Costanza et al. 1997 |
| 2.a |
Spiritual and historic information (for interior evergreen forest) |
72, 000 |
Discussion with subject experts |
| 2.b |
Spiritual and historic information(for interior evergreen forest) |
1,200 |
de Groot et al. 2002. |
| 3 |
Aesthetic Services |
1,500 |
Discussion with subject experts |
| 4 |
Cultural and artistic inspiration |
480 |
Discussion with subject experts |
| 5 |
Science and education |
48, 000 |
Discussion with subject experts |
Table 4: Unit values of cultural services from forest
d. Supporting Services From Forest Ecosystem: supporting service provided by the forest includes the habitat/refugium function, nursery function and biodiversity and genetic diversity function. The forest provides living space for a large number of plants and animals thus, playing an important role in the refugium function. It also acts as a nursery for immense plants and animals. The forest also serves as a store house of information. To maintain the viability of this genetic library, the maintenance of natural ecosystems as habitats for wild plants and animals is essential. The unit value habitat/ refugium function and nursery function were derived from literature and the unit value of biodiversity and genetic diversity was estimated (Table 5) based on the flow value of selected provision services that represent the least value stock of biodiversity and genetic diversity.
| S. No. |
Cultural services |
Value (in Rs./ hectare) |
Source |
| 1 |
Habitat/ refugium services |
73104 |
de Groot et al. 2002 |
| 2 |
Nursery services |
9360 |
de Groot et Al. 2002 |
| 3 |
Biodiversity and genetic diversity |
40000 |
Calculated from the flow value selected provisioning services like NTFP, medicinal plants, etc. |
| 4 |
Biodiversity and genetic diversity |
40000 |
Calculated from the flow value selected provisioning services like NTFP, medicinal plants, etc. |
Table 5: Unit value of supporting services from forest
Total Economic Value
The total economic value (TEV) of forest ecosystem is obtained by aggregating provision goods and services (provisioning, regulating, cultural and supporting services).The total economic value that has been calculated for one year is divided by the area of forest in each taluk to obtain the per hectare value of forest in respective taluk.
|