Land use analysis: Land use analysis was carried out for Landsat 8 image of December 2013, the land use under each sub catchment is as depicted in fig. 7a and table 9a. The catchment is dominated by agriculture with over 45.32%, followed by forest land use encompassing an area of 33.38%. The crops in the catchment area are rain fed, and the plantations are dependent upon the lakes and ground water post monsoon.
Table 9a: Land use (all units in Ha)
Sub basin id |
1 |
2 |
3 |
4 |
5 |
6 |
8 |
9 |
10 |
11 |
Total |
Urban |
6.3 |
1.8 |
1.3 |
71.5 |
1.9 |
56.1 |
5.8 |
3.3 |
6.1 |
10.9 |
165.1 |
Water |
28.3 |
27.6 |
15.4 |
70.7 |
6.0 |
22.0 |
46.6 |
3.9 |
37.5 |
11.6 |
269.6 |
Agriculture |
1144.7 |
1159.3 |
1560.0 |
6474.7 |
1177.7 |
3412.1 |
2399.8 |
811.2 |
4275.9 |
2367.2 |
24782.6 |
Open lands |
6.2 |
4.8 |
6.6 |
88.8 |
7.3 |
45.7 |
45.5 |
19.0 |
73.0 |
77.5 |
374.5 |
Deciduous Forest |
1120.4 |
613.2 |
925.8 |
2069.6 |
451.3 |
976.0 |
574.9 |
135.3 |
2303.4 |
1105.6 |
10275.6 |
Evergreen forest |
833.0 |
461.7 |
880.5 |
2197.7 |
736.8 |
505.4 |
268.3 |
29.0 |
1749.4 |
293.3 |
7955.2 |
Scrub/Grassland |
105.5 |
58.4 |
120.1 |
75.3 |
37.6 |
22.6 |
14.9 |
5.2 |
101.5 |
32.2 |
573.2 |
Forest Plantation |
196.0 |
157.3 |
115.7 |
792.4 |
81.4 |
210.8 |
148.7 |
38.6 |
671.3 |
232.9 |
2645.2 |
Agriculture Planation |
674.3 |
427.2 |
259.9 |
2354.2 |
196.7 |
926.9 |
588.7 |
144.0 |
1306.0 |
704.5 |
7582.6 |
Total Area |
4114.8 |
2911.5 |
3885.4 |
14194.9 |
2696.7 |
6177.7 |
4093.2 |
1189.6 |
10524.2 |
4835.7 |
54623.5 |
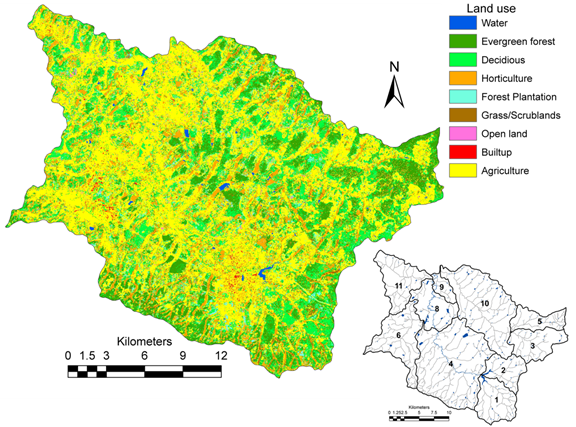
Figure 7a: Land use
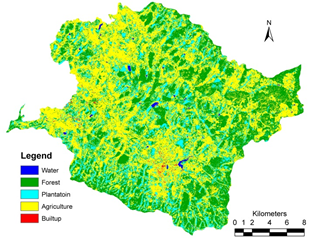
Temporal land use dynamics: The temporal land use dynamics of Varada river in sagara taluk are as depicted in figure 7b and in table 9b, the wetlands have increased from 0.1% to 0.5% due to construction of bunds across the river for providing water to cater the domestic needs, forests have declined from 45.2% to 34.5% in the past 4 decades, attributed to intense horticultural activities has increased from 10.9% to about 18.5% in the past 4 decades.
|
|
1973 |
2013 |
Figure 7b: Land use dynamics
Table 9b: Temporal land use dynamics
Land use |
1973 |
2013 |
Agriculture |
43.7% |
46.2% |
Built up |
0.1% |
0.4% |
Forest |
45.2% |
34.5% |
Plantation |
10.9% |
18.5% |
Water |
0.1% |
0.5% |
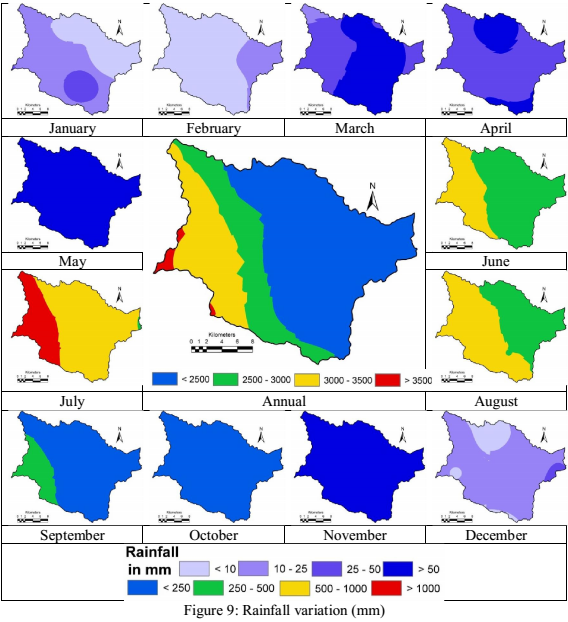
Hydrology: Around 17 rain gauge stations (fig.8) in and around the catchment were considered for the analysis. The daily rainfall data from these stations between 1961 and 2010 were analysed for each of the rain gauge every month, in order to check for missing data and also to understand the trend in the monsoon variations across years (fig. 3). The assessment show that rainfall in the catchment is depleting over time. The spatial variation of rainfall is as depicted in fig. 9, rainfall in the region starts from June up to October. The annual variations indicate that the rainfall is less than 2500mm at the plains where as it is over 3000 mm towards the southwest.
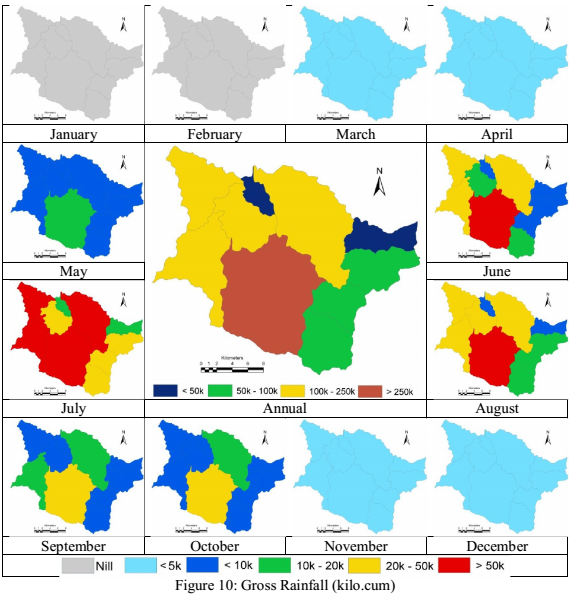
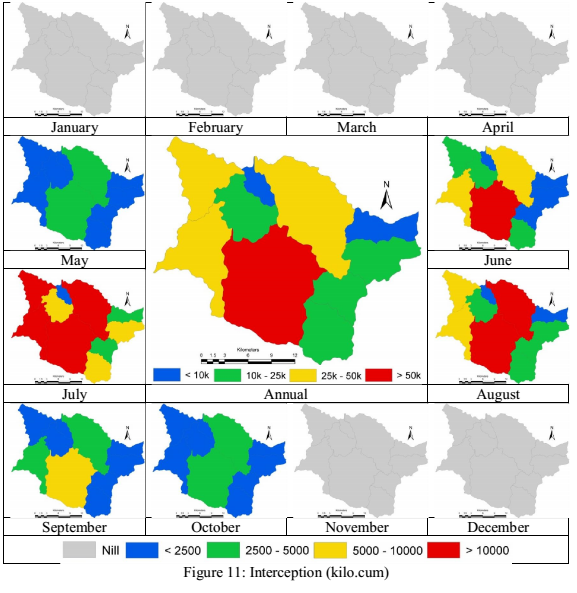
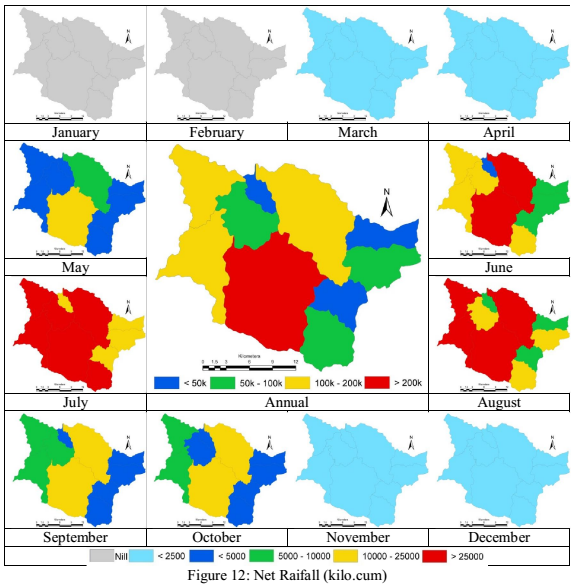
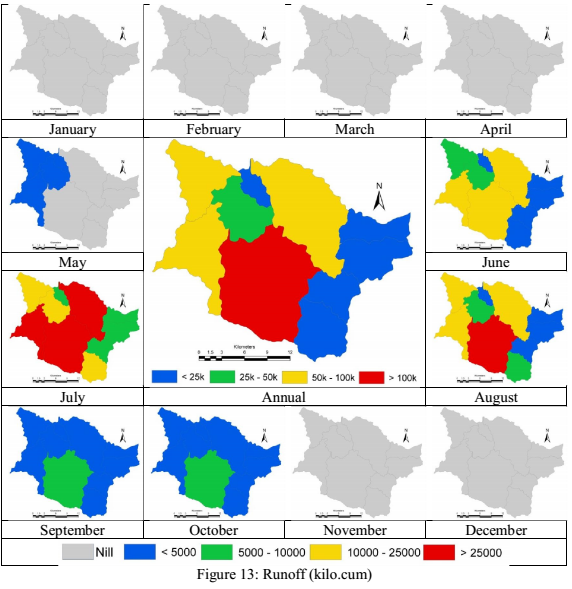
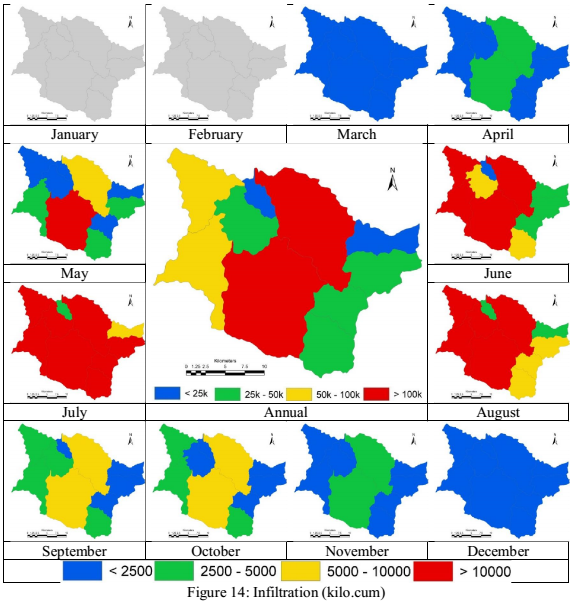
Gross rainfall yield in each of the sub basins is as depicted in fig. 10. As gross rainfall is product of precipitation and area under each sub basin, the rainfall yield shows higher values even in cases where the rainfall is low in the basin. Interception in each of the basins based on the regional land use and precipitation was derived, and is as depicted in fig. 11, regions with higher canopy cover has higher interception losses; the intercepted water contributes to evaporation during monsoon. Net rainfall is the difference between the gross rainfall and interception loss in each sub basin and is depicted in fig. 12. Runoff assessment was carried out using the empirical equation as a function of land use, precipitation and area of sub basin as is as depicted in fig. 13. Direct surface runoff in the basin is between June and October, the overall runoff in the basin is about 375 Million cubic meters (i.e., about 13 TMC of water). Infiltration in each of the sub catchment were assessed as function of net rainfall and runoff, and is as depicted in fig. 14, during non-monsoon most of the precipitation water percolates into the soils and sub strata.
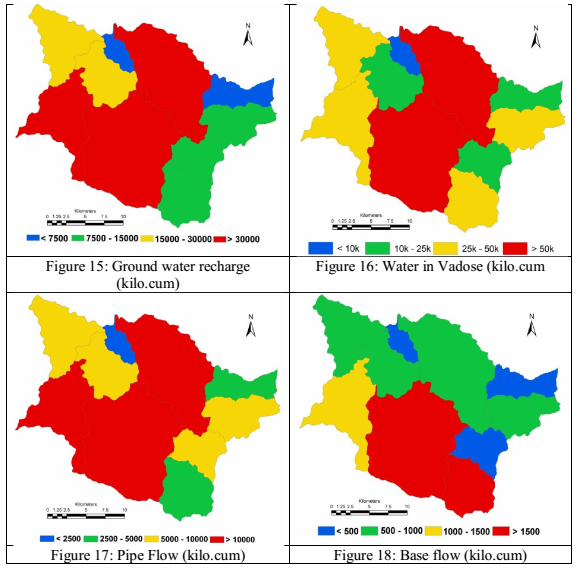
Ground water recharge was estimated based on Krishna Rao’s equation and is as depicted in fig. 15, regions with higher forest and large water cover depict higher recharge capabilities. Water in the sub surface, stored as vadose water is as depicted in fig. 16, catchments with higher forests indicate that the water is stored in a larger volume and for a longer duration. Portion of the water in vadose due to lateral movement moves as Pipeflow supporting the flow in the streams, maintaining water in lakes, fig. 17 depict the annual pipe flow in various sub catchments. The base flow depending on the ground water yield identified in other catchments and based on literature, was estimated for all the sub catchments and is depicted in fig. 18.
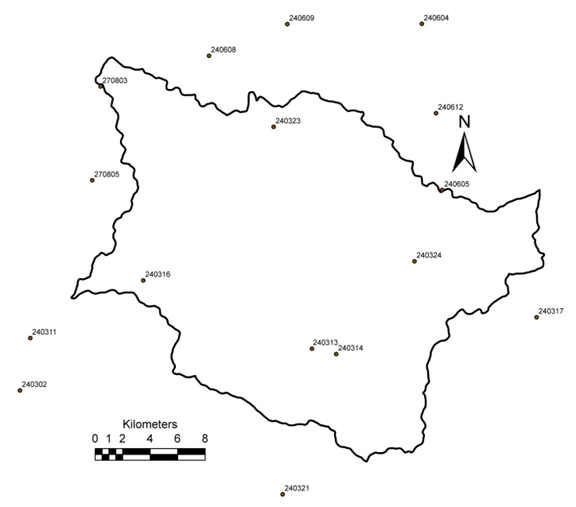
Figure 8: Rain gauge stations
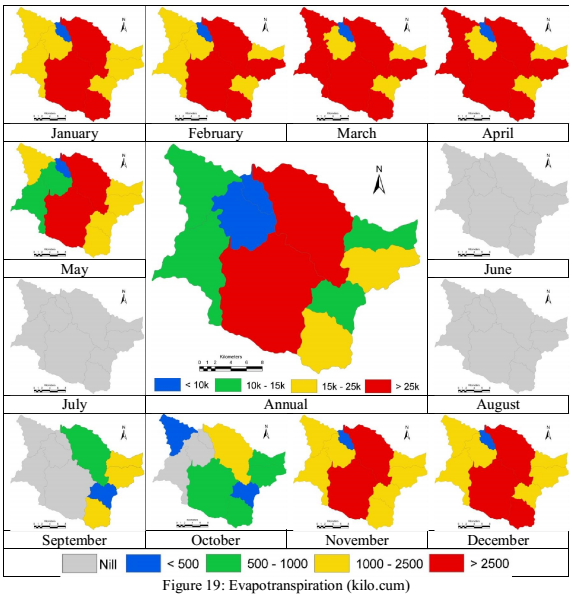
Evapotranspiration for each of the months was estimated based on the Hargreaves equation and the evaporative coefficient (FAO and other resources) for various land uses. The AET during monsoon was negligible since interception (portion of water standing on tree top, buildings, etc. inclusive of evaporation), and transpiration from the crops were considered as nill since crop water requirements were inclusive of transpiration. Fig. 19 depicts monthly evapotranspiration from various land uses.
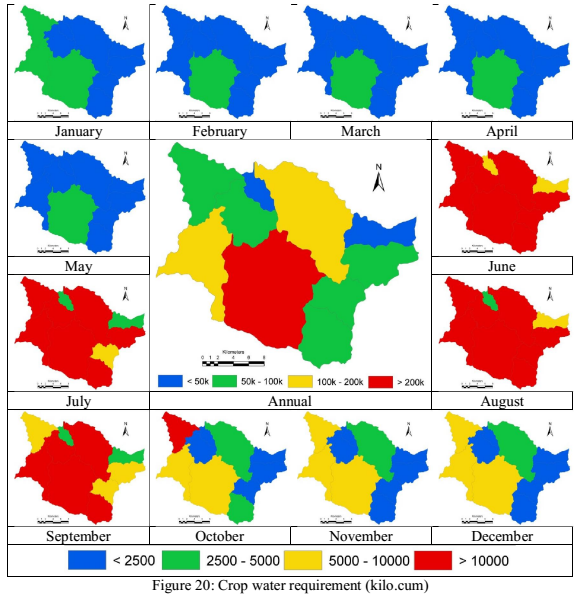
Crop water requirement was estimated based on literature, crop water data from irrigation department, agriculture portals and public interviews, it was established that most of the crops grown are only during monsoon, and few cash crops such as sugar cane, horticulture crops need long term water supply and in large quantity. The area under each crops were estimated based on the data available from district at a glance. Fig. 20 depicts monthly crop water requirements. Catchment with higher horticulture activities indicates that the crop water requirements are high in comparison with other catchments.
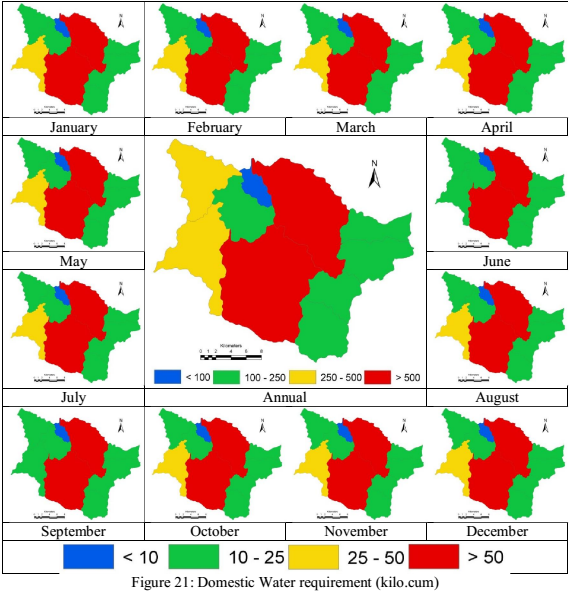
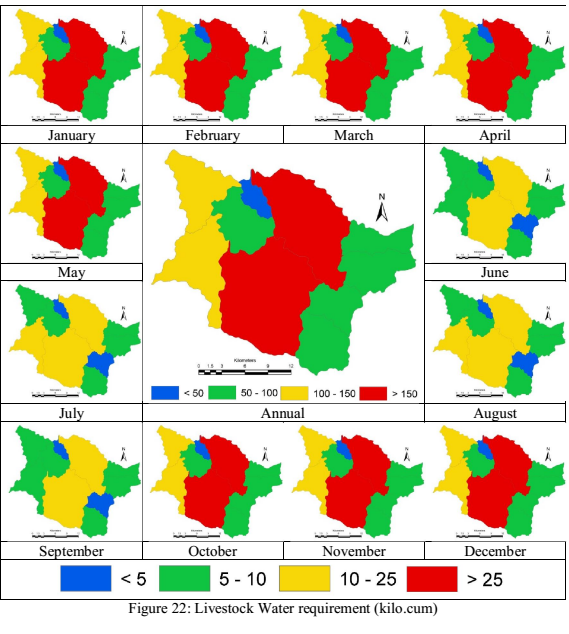
Domestic water requirements were estimated based on the population in each of the catchment, catchments with higher population demands higher water. Water requirement per person as product with population was used to derive the domestic water requirements and is depicted in fig. 21. The Livestock water requirements were quantified similar to the domestic but various categories of livestock were taken into account, fig. 22 depicts the monthly livestock water requirement.
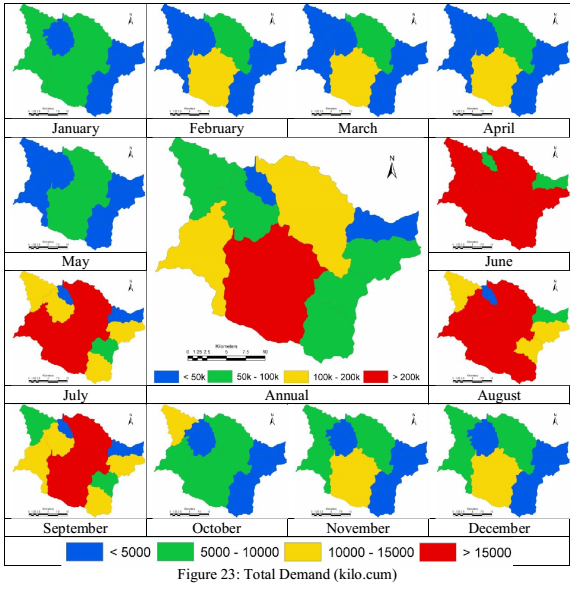
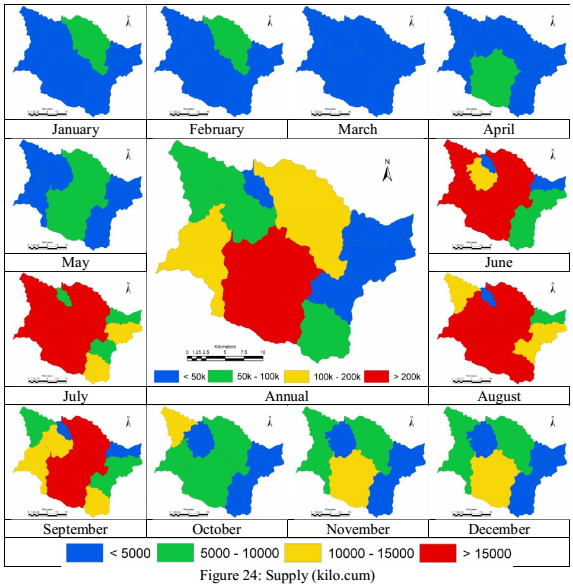
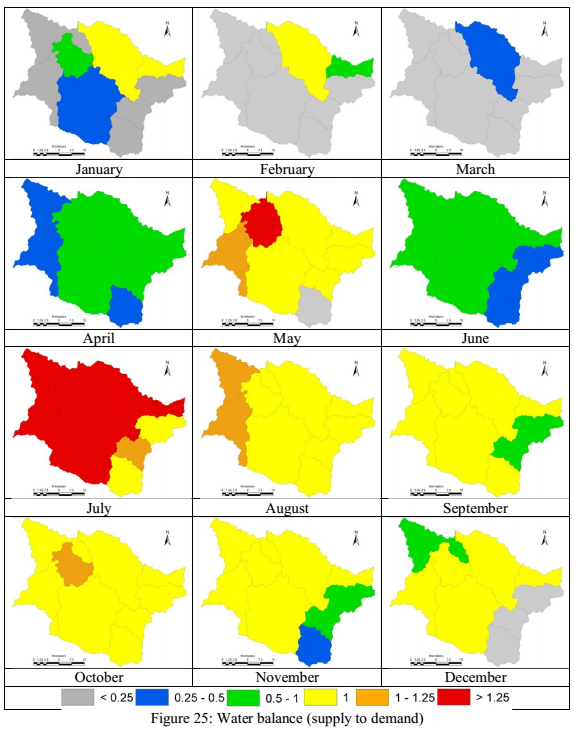
The water demand in the catchment was estimated as the sum of crop water requirement, domestic water requirement, livestock water requirement and evapotranspiration. The total demand of water in each of the catchment is as depicted in fig. 23. Catchments with higher horticulture demand more water, rather than the forest which show that they use less water. Supply of water is taken as a function of runoff during the monsoon, followed by the sub surface waters (vadose water and ground water) during the post monsoon. The water catered as a part of supply is depicted in fig. 24. The ratio of supply to the demand was calculated in order to check what portion of water demand in the region being satisfied by the water available in the basin, and is as depicted in fig. 25. The results show that in most of the sub catchments, since the demand is higher due to various agricultural and horticultural practices, associated with lower forest cover, only partial demand of water is fulfilled. The lakes in series provide water acting as source during post monsoons. In many a cases lakes with kans on their upstream have water throughout the year, catering to most of the human needs.
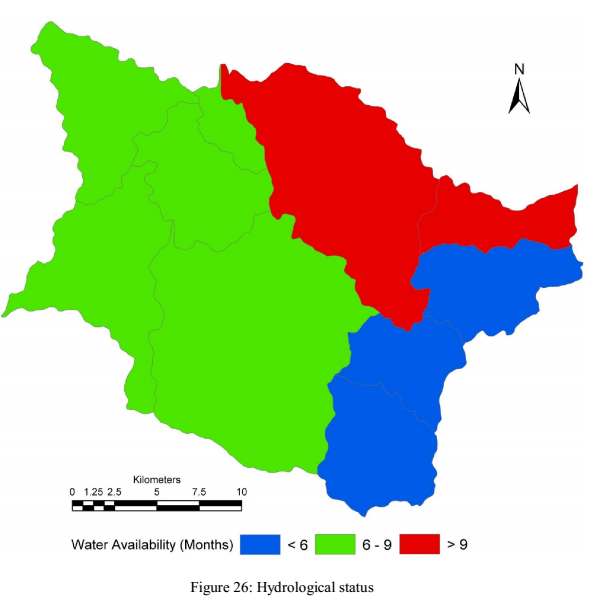
The capability of the water resource to completely cater the demand is as in fig. 26. It could be seen that, water can cater to complete demands over 6 to 9 months. But during rest of the seasons post monsoon, only partial demand can be met with the naturally available water (*naturally refers to the water in the streams, lakes and water due to lateral flow of water from sub-surface (in vadose )).