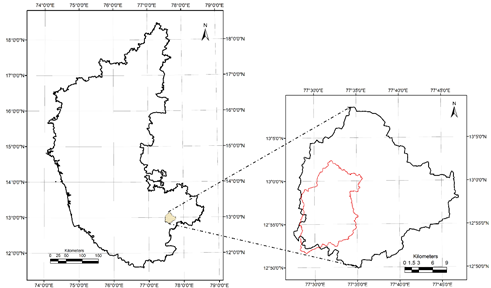
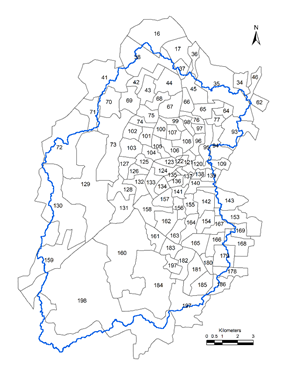
Bruhat Bengaluru (BBMP) Capital of Karnataka State, know with various names such as Silicon Valley, Garden City, City of Lakes, City of Boiled Beans (Bendakaaluru), City of Heros (Gandu Bhoomi), City of Burning Lakes (https://www.theguardian.com/), City of frothing lakes, etc. has an administrative area of 741 sq.km. The topography of Bengaluru is undulating giving rise to 3 major valleys (Vrishabhavathi Valley, K&C Valley, Hebbal Valley) and few minor valleys (Arkavathy Valley, Suvarnamuki Valley). Vrishabhavathi Valley with in the BBMP limits has a catchment area of ~170 sq.km (Figure 5.1), covering nearly 97 Wards of Bengaluru (Figure 5.2, Table 5.1). Vrishabhavathi river catered domestic (drinking water, bathing, etc.) and agricultural needs of West Bengaluru before the industrial evolution in the city (mid of 1970’s). The river had numerous interconnected lake systems such as Kempambudi Lake at Basavanagudi, Sankey Lake at Sadashivnagar, Yediyur Kere at Yediyur, etc.
Figure 5.1: Spatial extent of Vrishabhavathi Valley
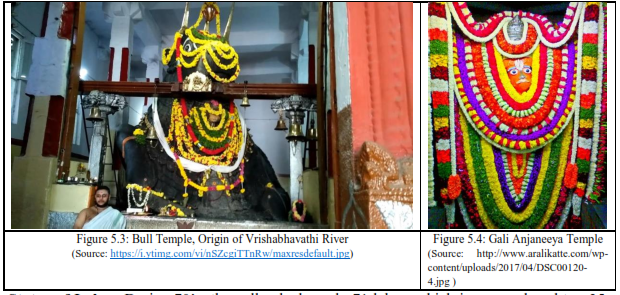
River origins at Bull temple, a small hillock next to Dodda Ganapathi Temple in Basavanagudi, Bangalore South (Figure 5.3), due to which it is known as Vrishabhavathi river (Vrishabh meaning Bull). Vrishabhavathi has 3 major streams namely Vrishabhavathi, Katriguppe and Kethamaranahalli. Vrishabhavathi valley from Basavanadudi, and its tributary originating at malleshwaram join near pipeline Gali Anjaneya temple and flow south towards Raja Rajeshwari nagar, where it joins a tributary (Kethamaranahalli) which carries sewage in to the sewage treatment. The river further travels down towards Kengeri and joins Suvarnamuhki at Byramangala River in Bidadi. Along the river network there are numerous temples namely (i) Gali Hanumantha Temple (Figure 5.4) on the banks of Vrihshabhavathi, over 600-year-old temple, constructed in 14th century (1425) in accordance with Sri Vyasaraya of Channapattana who was a Rajaguru of Vijayanagara Empire. (ii) Dodda Ganesha Temple: Located in immediate vicinity of Bull temple i.e., Origin of the river. (iii) Gavi Gangadhareshwara temple located at Gavipuram, near Ramakrishna mission Basavanagudi, (iv) Kadu malleswhara temple located at 15th cross malleshwaram, (v) Ishwara Temple at Kengeri which dates back to 1050 AD, etc. Vrishabhavathi River is getting polluted due to the sustained inflow of untreated sewage and industrial effluents.
Table 5.1: Wards along the V.Valley Catchment
Ward ID |
Ward Name |
Ward ID |
Ward Name |
Ward ID |
Ward Name |
16 |
Jalahalli |
98 |
Prakash Nagar |
141 |
Azad Nagar |
17 |
J.P.Park |
99 |
Rajaji Nagar |
142 |
Sunkenahalli |
34 |
Gangenahalli |
100 |
Basaveshwara Nagar |
143 |
Vishveshwara Puram |
35 |
Aramane Nagara |
101 |
Kamakshipalya |
153 |
Jayanagar |
36 |
Mattikere |
102 |
Vrishabhavathi Nagar |
154 |
Basavanagudi |
37 |
Yeshwanthpura |
103 |
Kaveripura |
155 |
Hanumanth_Nagar |
38 |
HMT ward |
104 |
Govindaraja Nagar |
156 |
Srinagar |
41 |
Peenya Industrial Area |
105 |
Agrahara Dasarahalli |
157 |
Gali Anjenaya Templw Ward |
42 |
Lakshmi Devi Nagar |
106 |
Dr. Raj Kumar Ward |
158 |
Deepanjali Nagar |
43 |
Nandini Layout |
107 |
Shivanagara |
159 |
Kengeri |
44 |
Marappana Playa |
108 |
Sriramamandir |
160 |
Rajarajeshwari Nagar |
45 |
Malleswaram |
109 |
Chickpete |
161 |
Hosakerehalli |
46 |
Jayachamarajendra Nagar |
120 |
Cottonpete |
162 |
Girinagar |
62 |
Ramaswamy Palya |
121 |
Binnipete |
163 |
Katriguppe |
64 |
Rajamahal Guttahalli |
122 |
Kempapura Agrahara |
164 |
Vidyapeeta Ward |
65 |
Kadu Malleshwar |
123 |
Vijayanagar |
165 |
Ganesh Mandir Ward |
66 |
Subramanya Nagar |
124 |
Hosahalli |
166 |
Karisandra |
67 |
Nagapura |
125 |
Marenahalli |
167 |
Yediyur |
68 |
Mahalakshmipuram |
126 |
Maruthi Mandir Ward |
168 |
Pattabhiram Nagar |
69 |
Laggere |
127 |
Mudalapalya |
169 |
Byrasandra |
70 |
Rajagopal Nagar |
128 |
Nagarabhavi |
178 |
Sarakki |
71 |
Hegganahalli |
129 |
Jnana Bharathi Ward |
179 |
Shakambari Nagar |
72 |
Herohalli |
130 |
Ullal |
180 |
Banashankari Temple Ward |
73 |
Kottegapalya |
131 |
Nyandahalli |
181 |
Kumaraswamy Layout |
74 |
Shakthi Ganapathi Nagar |
132 |
Attiguppe |
182 |
Padmanabha Nagar |
75 |
Shankar Matt |
133 |
Hampi Nagar |
183 |
Chikkalsandra |
76 |
Gayathri Nagar |
134 |
Bapuji Nagar |
184 |
Uttarahalli |
77 |
Dattatreya Temple |
135 |
Padarayanapura |
185 |
Yelchenalli |
93 |
Vasanth Nagar |
136 |
Jagajivanaramanagar |
186 |
Jaraganahalli |
94 |
Gandhinagar |
137 |
Rayapuram |
197 |
Vasanthpura |
95 |
Subhash Nagar |
138 |
Chalavadipalya |
198 |
Hemmigepura |
96 |
Okalipuram |
139 |
K R Market |
|
|
97 |
Dayananda Nagar |
140 |
Chamarajapet |
|
|
Figure 5.2: Ward boundaries and Catchment of V.Valley
Status of Lakes: During 70’s, the valley had nearly 71 lakes, which is now reduced to ~35 lakes in 2017 (Figure 5.5). Table 5.2 lists existing Lakes in the Vrishabhavathi valley and most of these existing lakes are encroached and abused (with dumping of solid and liquid wastes). Table 5.3 lists the disappeared lakes, due to unplanned and senseless urbanisation in the city. Anthropogenic activities particularly, indiscriminate disposal of untreated industrial effluents and sewage wastes, dumping of solid waste, dumping of construction and demolition wastes (building debris) have altered the physical and chemical integrity affecting the biological integrity, evident from the profuse growth of macrophytes weeds, exotic species of fish, etc.
Table 5.2: Existing Lakes in Vrishabhavathi valley
Anjanagara kere |
Goudanakere |
Jettiganahalli |
Nayandahalli kere |
Sunkalapalya kere 1 |
Byadralli kere |
Hegganahalli kere 1 |
Kempambudi kere |
Prashanthnagar kere |
Sunkanapalya kere 2 |
Chandranagara kere |
Hegganahalli kere 2 |
Kenchenahalli kere |
Sankey kere |
Thalaghattapura kere |
Channasandra Kere |
Hemmigepura kere |
Kengeri kere |
Somapura kere1 |
Ullal kere |
Deepanjalinagara kere |
Hosakere |
Kodigepalya kere |
Somapura kere2 |
Uttarahalli kere |
Dore kere |
Hosakerehalli kere |
Mallatalli kere |
Srinivasapura kere |
Vasantpura lake |
Dubasipalya |
Isro layout kere |
Nagarabhavi kere |
Subramanya kere |
Yediyur kere |
Figure 5.5: Distribution of lakes and lost lakes (marked in Red) between 1970 and 2017 in Vrishabhavathi valley
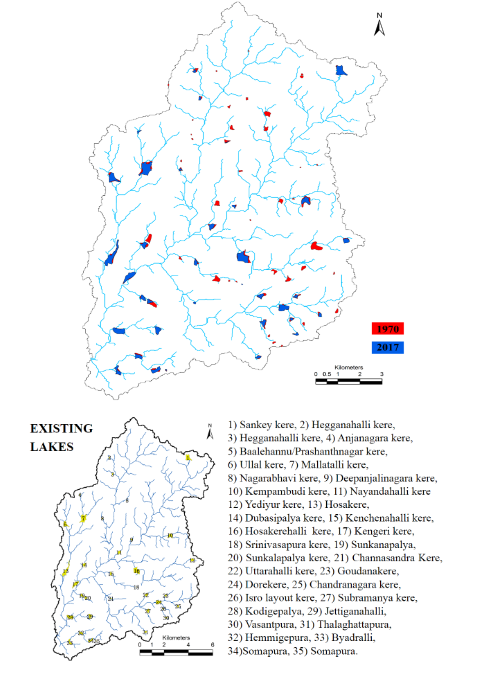
Table 5.3: Disappeared Lakes in Bengaluru in Vrishabhavathi valley
Attikoppe |
Garagnutepalya |
Hanumantanagar 2 |
Kenchanahalli |
Rajajinagar |
Avalhalli |
Gottigere |
Hegganahalli |
Kurubahalli |
Sajjepalya |
Banashankari |
Gublal 1 |
Jalvadipalya |
Laggere |
Sivanahalli |
Byatrayanapura |
Gublal 2 |
Kadarenahalli |
Nagarbhavi |
Tyagarajanagar |
Chikkakalsandra 1 |
Gublal 3 |
Kamakshipalya 1 |
Oddarapalyam |
Uttarahalli 1, 2 |
Chikkakalsandra 2 |
Guddadahalli |
Kamakshipalya 2 |
Padarayanapura |
Vasantpur |
Dasarahalli |
Hanumantanagar 1 |
Karithimmanahalli |
Papareddipalya |
Yalchenahalli |
Figures 5.6 and 5.7 present the population dynamics across time. Population density in the valley has increased from 15 persons per hectare (in 1951) to 177.3 persons per hectare (in 2011). Large scale growth was observed between 1991 and 2001 i.e., from 76 (1991) to 136 (2001) persons per hectare, almost double the growth. Estimation of Population density for the year 2017 and 2021 using Simple interest method (eq 1)
Pn = P* (1 + n.r) (1)
Where Pn : Population at nth year, P : Current population (2011), n : number of decades, r : growth rate per decade.

Figure 5.6: Population density dynamics in the Vrishabhavathi Valley Catchment
V.Valley as on 2017 has a population of ~3978862 persons with an annual demand of water of 596 MLD at a rate of 150 lpcd (liter per capita per day), and water demand is expected to reach 682 MLD (by 2021). Ward wise and catchment wise water demand is presented in Figure 5.8.
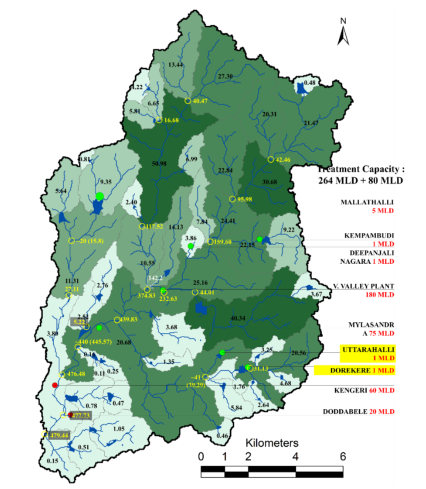
Sewage generated in the V.Valley is computed based on the water demand, considering to be 80% of the total water demand. Estimation of sewage generated (Figure 5.9) in the city shows, that ~480 MLD of sewage is generated (year 20170. This is expected to increase to 544 MLD by 2021 (based on the likely increase in population).
Figure 5.7: Ward wise population dynamics in the Vrishabhavathi Valley Catchment
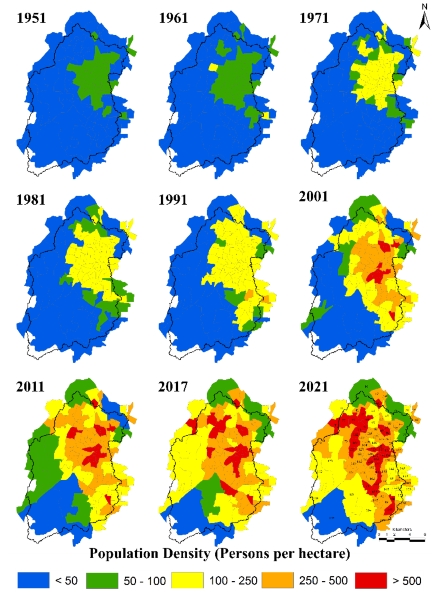
Figure 5.8: Water Demand (MLD) – ward and catchment wise
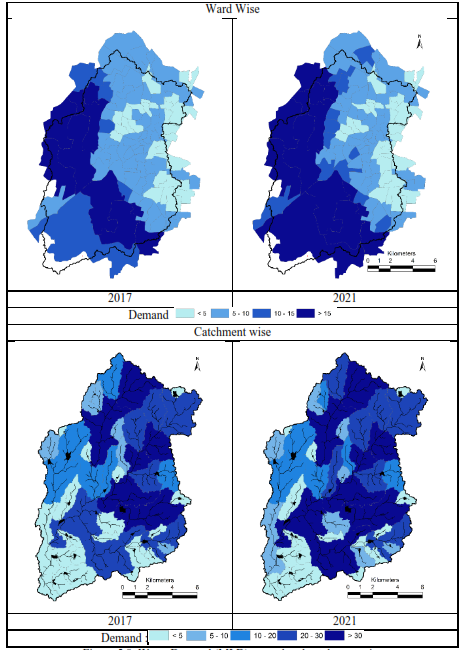
Figure 5.9: Sewage generated (MLD) – catchment wise

5.1 SEWAGE TREATMENT IN V.VALLEY: CURRENT STATUS AND GAPS:
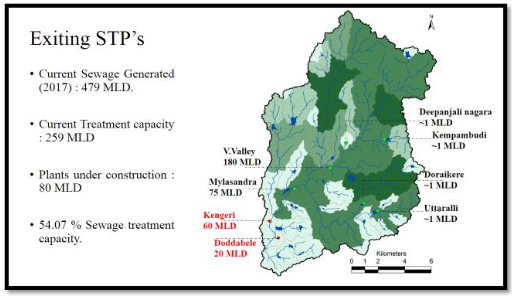
Sewage generated in the catchment are either partially treated or untreated, evident form the prevailing water and sediment quality in the lakes of V. Valley. However, there are some efforts to treat sewage (but lacks option for removal of nutrients, which constitute the major problem of sewage) with 180 MLD (at Rajarajeshwari Nagar) and 75MLD (at Mylasandra) downstream of V.Valley along the Mysore road. Two more treatment plants are being implemented at Kengeri (60 MLD) and Doddabele (20 MLD). Small treatment plans about 1 to 2 MLD scale are present at Uttaralli, Deepanjalinagar, Doraikere, Kempambudi lakes respectively and 5 MLD plant at Mallathalli. Figure 5.10 depicts the location of the existing treatment plants (+ proposed treatment plants) and quantum of sewage generated in each sub-catchment.
Figure 5.10: Quantum of Sewage Generated and location of STP’s
Current treatment capacity is about 260 MLD whereas Sewage generated is about 490 MLD i.e., 54% of the sewage generated is treated when the plants are running at their full potential. Additional 80 MLD is under construction near Doddabele-Kengeri. Catchment wise quantum of sewage generated per day is given in Figure 5.11 with the current treatment capabilities and gaps (deficiencies). Figure 5.12 depicts the location of various treatment plants in the valley.
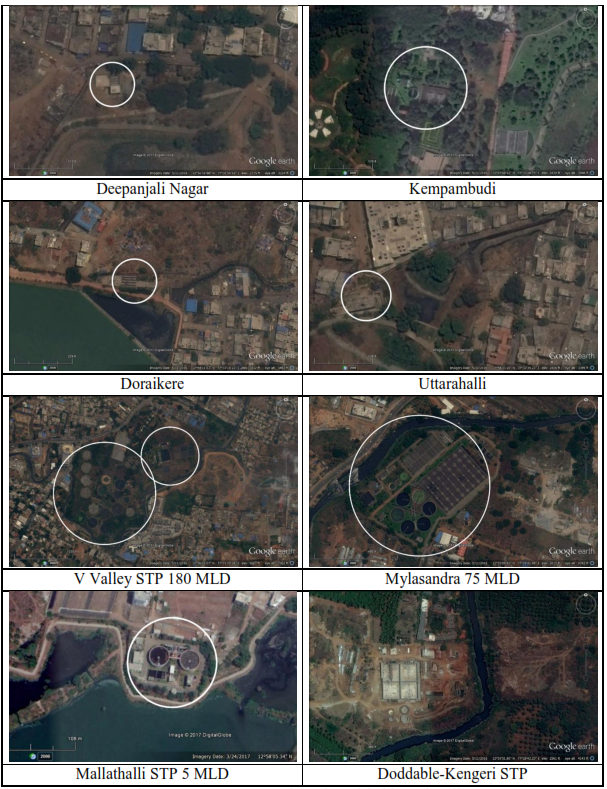
Figure 5.11: STP, Treatment capabilities and deficiencies along the valley
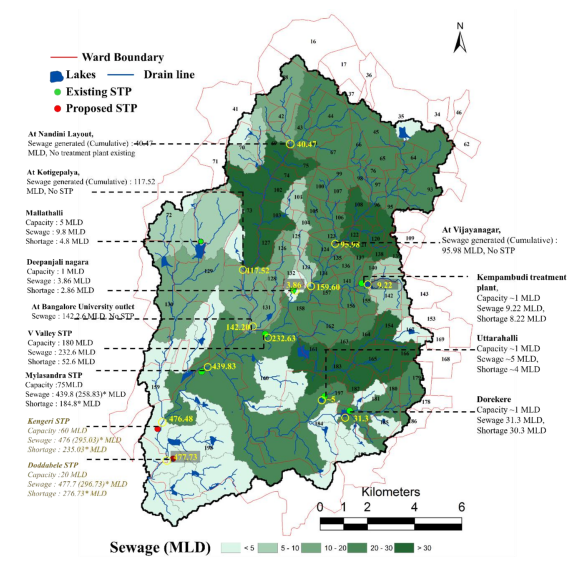
Figure 5.12: Treatment Plants in Vrishabhavati Valley
In order to treat the sewage generated in the valley, decentralized treatment option needs to be adopted, which helps in the treatment of water and also aids in catering local needs. STP’s integrated with constructed wetlands with algae pond help in the removal on nutrients as well as other chemical contaminants. Along the valley, reed beds (wetland plants) and other vegetation cover can further help in the uptake of nutrients. Similar treatment options outside BMP vicinity would revive Byramangala reservoir which can act as a source of drinking water in future. Figure 5.13 outlines the site requirements for adoption of decentralized treatment plants in the respective catchments. Quantum of sewage that can be treated locally and additional details are given in Table 5.4. Figure 5.14 indicates the sites (Green polygons) and treatment capabilities for the sub catchment of Vrishabhavathi joining at Bengaluru University Gate.
Figure 5.13: Site requirements for decentralized STP
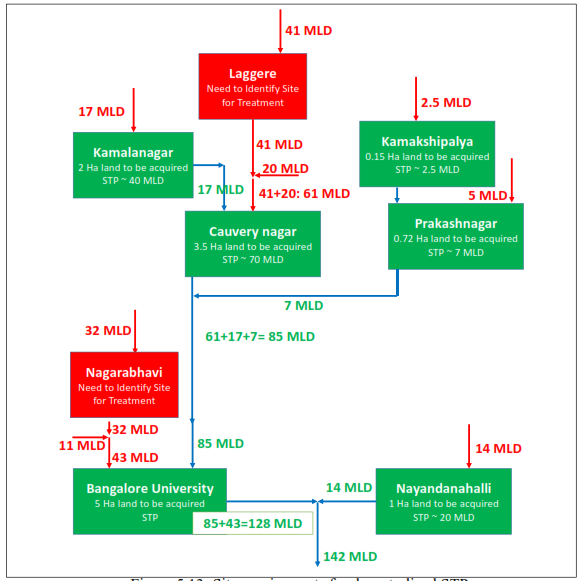
Figure 5.14: Probable sites for setting up sewage treatment plant to ensure zero waste discharge into the valley - Valley running through Bangalore University
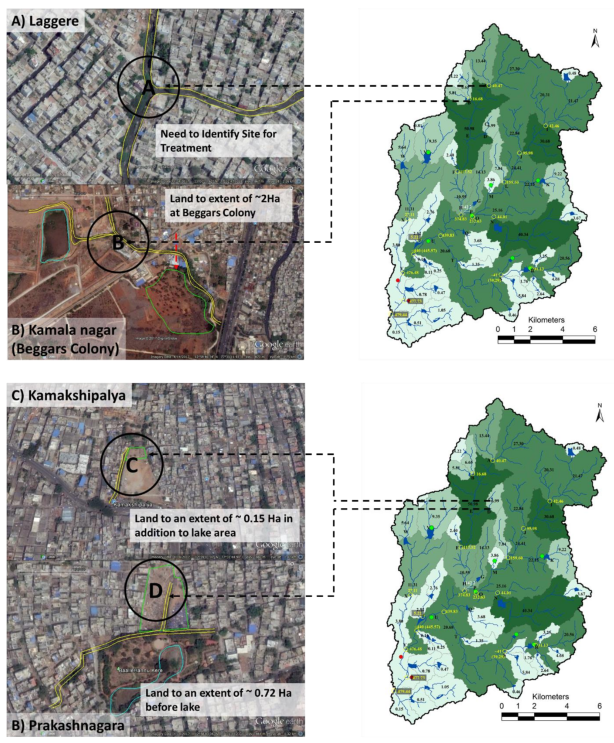
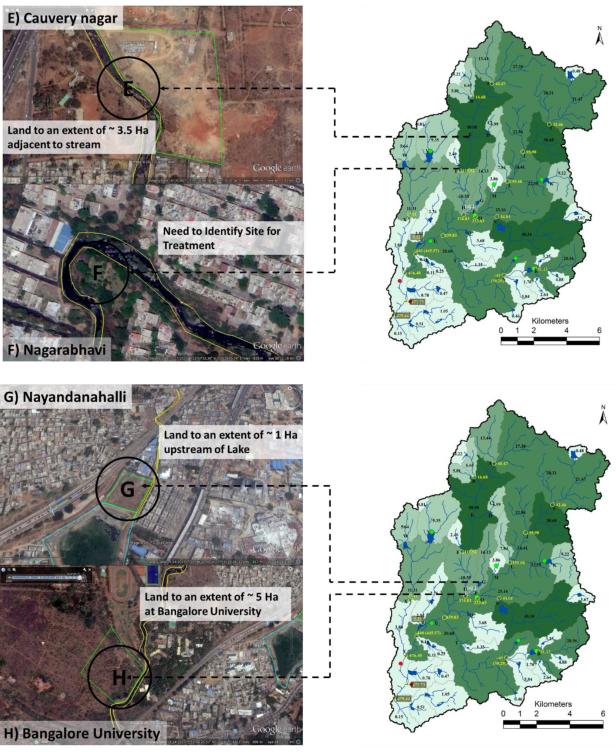
Table 5.4: Sewage Treatment along the Valley joining Vrishabhavathi at Bangalore University Gate
|
Location |
Sewage Generated |
Treatment in MLD |
Land use |
Area required |
Beneficiaries |
|
Current |
1 |
Laggere |
41 MLD |
Need to Identify Site for treatment |
Urban |
|
|
2 |
Kamalanagara |
17 MLD |
17 |
Open |
2 Ha at Beggars Colony |
Doddanna Industrial Area, Beggars Colony, recharge upstream lakes and Ground water in the vicinity |
3 |
Kamakshipalya |
2.5 MLD |
2.5 |
Open Land |
0.15 Ha u/s Lake |
Kamakshi palya lake can be revived, helps in restoring ground water in the vicinity |
4 |
Prakashnagar (Baalehannu kere) |
5 MLD |
5 |
Open Land |
0.72 Ha u/s Lake |
Prakshnagar lake can be perennial, helps recharging ground water |
5 |
Cauvery Nagar |
20 MLD
61 MLD (= 20 MLD +
41 MLD (Laggere)) |
61 |
Open Land |
3.5 Ha adjacent to Stream |
Industries in the vicinity, and other institutions, helps restoring stream and recharge Ground water |
6 |
Nagarabhavi |
32 MLD |
Need to Identify Site for treatment |
Urban |
|
|
7 |
Nayandanahalli |
14 |
14 |
Open |
1 Ha u/s Lake |
Industries, Lake would be perennial, Ground water recharge |
8 |
Bangalore University |
11 MLD
43 MLD (= 11 MLD + 32 MLD (Nagarabhavi)) |
43 |
Scrub |
5 Ha next to stream in BU campus |
Bangalore university can use water for flushing, greening and other activities, Sports authority of India for various activities, etc. |
Figures 5.15 and 5.16 provide the details of probable locations for setting up decentralized treatment options along the Vrishabhavathi valley before it reaches Bangalore university. Table 5.5 provides additional details on the same.
Figure 5.15: Treatment and Site conditions
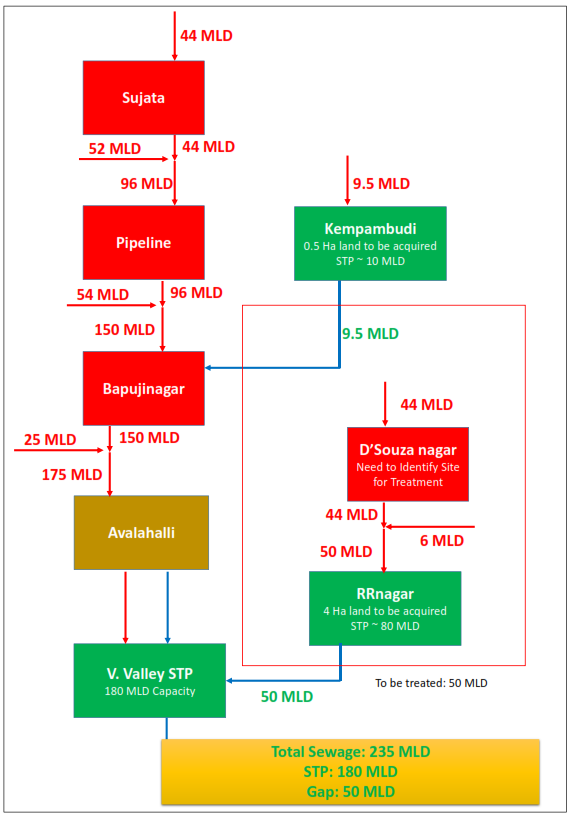
Figure 5.16: Probable sites for setting up sewage treatment plant to ensure zero waste discharge into the valley – V.Valley up to Bangalore University Gate
Table 5.5: Sewage treatment along V valley up to Bangalore University Gate
Sl.no. |
Location |
Sewage Generated |
Treatment in MLD |
Landscape |
Area requirement |
Beneficiaries |
1 |
Sujata |
44 MLD |
Need to Identify Site for treatment |
Urban |
|
|
2 |
Pipeline
(Vijayanagar) |
52 MLD
96 MLD = 52 MLD + 44 MLD (Sujata) |
Need to Identify Site for treatment |
Urban |
|
|
3 |
Kempambudi kere |
9.5 MLD |
1 MLD
-
- |
Open Land |
0.5 Ha (upstream of Lake) |
Lake can be rejuvinated, Ground water improvement water can be recycled |
4 |
Bapujinagar |
54 MLD
150 MLD (= 54 MLD + 96 MLD (Pipeline) |
Need to Identify Site for treatment |
Urban |
|
|
5 |
Avalahalli |
25 MLD
175 MLD (= 25 MLD + 150 MLD (Bapujinagar) |
65 |
Open |
|
|
|
V.Valley STP |
230
MLD |
180 |
Existing STP |
|
|
6 |
D'Souza Nagar |
44 MLD |
|
Urban |
|
|
7 |
RR Nagar |
6MLD
50 MLD (= 6 MLD + 44 MLD (D’Souza nagar) |
50 |
Open |
4 Ha (Opposite to existing STP) |
Rejuvenation of stream, Ground water recharge, Construction activities, Flushing |
Decentralised treatment options at minor catchments can further cater the downstream users needs such as for agriculture, horticulture, construction, industries (SEZ) etc. (Figure 5.17). In addition to these treatments, existing treatment facilities at Mylasandra and Doddabele (Kengeri) can be used to make sure zero waste discharge from the city.
Figure 5.17: Localized treatments at other locations

For optimal treatment and management, entire V Valley catchment is divided into 3 zones (based on topography and to ensure gravity flow) and zone wise scope for setting up decentralized treatment plants are listed in Table 5.6.
Table 5. 6: Optimal sewage management strategy in V.Valley
Zone ID
|
Node |
Location |
Sewage Generated (MLD) |
STP |
Land for setting up STP (Sewage Treatment plants) |
Cumulative (in case of lack of land) |
Zone 1
(Yeshwanthpur to BU GATE) |
1 |
Laggere |
41 |
|
Identify |
|
3 |
Cauvery Nagar |
20 |
|
4 Ha |
61* |
2 |
Kamalanagar |
17 |
|
2 Ha |
17 |
4 |
Kamakshipalya |
2.5 |
|
0.1 Ha |
2.5 |
5 |
Prakashnagar |
4.5 |
|
0.25 Ha |
4.5 |
6 |
Nagarabhavai |
32 |
|
Identify |
|
7 |
BU |
11 |
|
4 Ha |
43* |
8 |
Nayandahalli |
14 |
|
1.2 Ha |
14 |
9 |
BU Gate |
|
|
|
142* |
Zone 2
(Sadashivanagar to BU GATE) |
12 |
Kempambudi |
9.5 |
1 |
0.5 Ha |
9.5 |
10 |
Sujatha |
44 |
|
|
|
11 |
Pipeline (Rajajinagar) |
52 |
|
|
|
13 |
Bapujinagar |
54.5 |
|
|
|
14 |
Avalahalli |
24.5 |
|
|
|
15 |
V.Valley STP |
|
180 |
Existing STP |
180$ |
16 |
D'Souzanagar |
44 |
|
Identify |
44 |
17 |
RRNagar |
6 |
|
Identify |
6 |
20 |
BU Gate |
|
|
|
234.5 |
Zone 3
(BU GATE to Doddabele) |
21 |
Doraikere |
31.5 |
|
2 Ha |
31.5 |
22 |
Channasandra |
10 |
|
0.5 HA |
10 |
23 |
Global Village |
22 |
|
2 HA |
22 |
24 |
Mylasandra |
5 |
75 |
Existing STP |
75$ |
25 |
Mallatalli |
10 |
5 |
Existing STP (upgrade) |
5$ |
25 |
Ullala |
10 |
|
Identify |
10 |
27 |
Kengeri |
11 |
60 |
STP under construction |
60$ |
28 |
Doddabele |
14 |
20 |
STP under Construction |
20$ |
29 |
Cumulative |
113.5 |
|
|
|
Summary |
Zone 1 |
142 |
|
TREAT SEWAGE TO PREVENT GROUNDWATER CONTAMINATION
LAKES HELP IN GROUNDWATER RECHARGE |
Zone 2 |
234.5 |
|
Zone 3 |
113.5 |
|
V VALLEY |
490 |
340 |
Note : * - Cumulative of previous and current node , # - Partial treatment at node, $ - STP (Existing or Under construction)