| |
ENVIS Technical Report: 122, September 2017 |
 |
Rejuvenation Blueprint for Lakes in Vrishabhavathi Valley |
 |
Energy and Wetlands Research Group, Centre for Ecological Sciences, Indian Institute of Science, Bangalore – 560012, India.
*Corresponding author: cestvr@ces.iisc.ac.in
|
Lakes and water bodies also referred to as wetlands are one of the most productive ecosystems contributing to ecological sustainability thereby providing necessary linkages between land and water resources. The quality and hydrologic regime of these lakes and wetlands is directly dependent on the integrity of its watershed. In last couple of decades, rapid urbanization coupled with the unplanned anthropogenic activities has altered the wetland ecosystem severely across globe. Changes in land use and land cover (LULC) in the wetland catchments influence the water yield and water quality for the lakes. Apart from LULC changes, the inflow of untreated domestic wastewater, industrial effluents, dumping of solid wastes and rampant encroachments of catchment has threatened the sustenance of urban wetlands. This is evident from the nutrient enrichment and consequent profuse growth of macrophytes, impairing the functional abilities of the wetlands. Reduced treatment capabilities of the wetlands have led to the decline of native biodiversity, prevailing unhygienic conditions with mosquito menace, contamination of groundwater levels, affecting the livelihood of wetland dependent population. Decline in the services and goods of wetland ecosystems have influenced the social, cultural and ecological spaces as well as of water management. This necessitates a systematic lake rejuvenation paradigm and associated monitoring of wetlands to mitigate the impacts through appropriate management strategies. A combination of LULC analysis in the catchment using remote sensing data acquired through the space-borne sensors facilitates identification of valley zones and wetland area. This in turn aids in maintaining records for encroachment and consequent action. Factor like nature of the catchment, wastewater quality and quantity influx, garbage dumping etc. related to water quality are the most important pressure driving the productivity of these rapidly disappearing wetland systems and are reasons for today’s dominance of exotic organisms with increasing heterogeneity of biotic components at an intermediate spatial and temporal scale. Nutrient (C, N and P) influx being the most significant reason for the present deterioration of these wetland and water bodies. Suitable catchment management practices with strategic control of untreated industrial and domestic effluents getting into these water bodies will be key for a sustainable city management plan. Recommended de-silting and de-weeding the water bodies, complete treatment of municipal and industrial wastewater, a ban in P use in detergents, removal of encroachments, fencing and green belt around the water bodies, and growth of essential N-rich aquatic vegetation for the livelihood of nearby dependent communities and provision to retain the natural floating islands for in-situ bioremediation. Further strategic planning needs to be adopted at the higher level for increase in consensus for optimal water usage, provisions for rain water harvesting, ground water recharge etc. for fostering sustainable city management.
Vrishabhavathi Valley: Vrishabhavathi Valley is one of the three major valleys in Bengaluru, that flows south, joining Arkavathi, a tributary of river Cauvery. The catchment of V.Valley is nearly 170 sq.km covering about 90 Wards in BBMP. The catchment has about 70 lakes during the early 1970’s which has now reduced to ~35 as on 2017. Most of the lakes have been filled and converted into residential/industrial areas, the streams/rajakauveys are narrowed by dumping construction debris, solid wastes there by increasing instances of floods, mortalities in monsoons. Current population in V.Valley (2017) is about 40 lakhs with water demand of 596 MLD (150 lpcd). V.Valley generates about 480 MLD (2017) of domestic sewage which is expected to reach 544 MLD by 2021with the current growth rate before it exits the BBMP limits. The valley has current treatment capability of 265 MLD (working) and 80 MLD (under construction) which is insufficient to treat the domestic waste.
Major watersheds of V.Valley are (i) Vrishabhavathi valley, (ii) Katriguppe Valley (joins V.Valley at Rajarajeshwari nagar, before STP), (iii) Nagarabhavi Valley (joins V.Valley at Bangalore University Gate) (iv) Channasandara Valley (joins V.Valley behind RVCE/Global Village techpark, Rajarajeshwari nagar), (v) Sonnenahalli valley (joins V Valley near Vidyapeetha-Kengeri). Details describing watersheds as in Table 1
Highlights:
-
Origin - at Bull temple, a small hillock next to Dodda Ganapathi Temple in Basavanagudi, Bangalore South, due to which it is known as Vrishabhavathi river (Vrishabh meaning Bull).
-
Number of watersheds: 7 major watersheds in Vrishabhavathi valley;
-
Number of lakes: 70 (in 1970’s), now 35 (in 2017) ; after swallowing by land mafia (50% disappeared lake)
-
Domestic sewage: 480 MLD (2017) and expected to reach 596 MLD (2021)
-
Serious threats:
-
Encroachments (rampant in each lake – for example Prakashnagara / Balehannu kere and many such lakes),
-
Sustained inflow of untreated sewage and industrial effluents,
-
nexus of senseless local politicians, bureaucrats, consultants and civil contractors [evident from narrowing and concretizing storm water drains, completely ignoring hydrological functions (groundwater recharge, bioremediation, mitigation of floods) of drains and also violating NGT guidelines on storm water drains and buffer regions].
-
Health issues: Contaminated fodder, fish and vegetable (contamination of food chain) due to polluted water in the lake with untreated industrial effluents (containing heavy metals, etc.). Respiratory and cancer episodes with volatile organic compounds and aerosols in the air environment. Breeding of disease vectors and instances of Chikangunia, Dengu, etc.
Table 1: Current condition of V.Valley watersheds.
Minor Watershed |
Description |
1 |
Originating near Sankey Tank, Sadashivnagar, before it reaches Galianjaneya temple, Sewage about 120 MLD is generated and there are no treatment facilities in this minor watershed |
2 |
Originates at Nandi temple (Basvanagudi) due to which river gets its name Vrishabhavathi. Joins valley originating near Sankey tank at Gali Anjaneya temple. Sewage about 31.5 MLD is generated in this watershed. A small treatment plant ~1 MLD exists downstream of Kempambudi lake that is used for watering Park adjacent to lake.
Both Watersheds 1 and 2 combine to form V.Valley contributing about 150 MLD of Sewage. |
3 |
Kartiguppe Valley originating near Yediyur flows through Hosakere halli and Joins Vrishabhavathi Valley at RajaRajeshwari nagar. Sewage of nearly 50 MLD is generated in this watershed and there are no treatment facilities in this watershed.
Katriguppe valley and Vrishabhavathi valley both together contribute contributing to 235 MLD of Sewage.
A treatment plant about 120 MLD (Secondary)+ 60 MLD (Tertiary) is existing at Rajarajeswarinagar. |
4 |
Nagarabhavi valley originates in Yeshwanthpur, passing thorough industrial areas of Yeswhanthpur, residential areas of Laggere, Nandini layout, Nagarabhavi, and institutions such as Bangalore university and Sports Authority of India, joins V.Valley near Bangalore university Gate. Nagarabhavi Valley generated about 140 MLD of Sewage.
Both V.Valley and Nagarabhavi valley together contribute to 374 MLD of Sewage. |
5 |
Channasandra Valley contributed by minor streams of Doraikere, Uttarahalli, Srinivasapura joins V.Valley at Global Village SEZ, Rajarajeswarinagar. The valley contributes to about 61 MLD of Sewage. At this junction, V.Valley generates nearly 440 MLD of sewage.
Mylasandra Treatment plant with a capacity of 75 MLD is along the downstream of the junction. |
6 |
Sonnenahalli Valley contributed by stream of Mallathalli, Ullal, Kengeri Satellite town join V.Valley near Vidypeetha (Kengeri) contributes to 30 MLD of sewage. At this junction V.Valley generates 476 MLD of sewage. A treatment facility at Kengeri about 80 MLD is under construction downstream of this junction |
7 |
Other minor stream contribute to nearly 3 MLD of sewage to V.Valley before the valley exits BBMP limits. |
Recommendations:
Decentralised Model for treatment of sewage (similar to Jakkur Lake) |
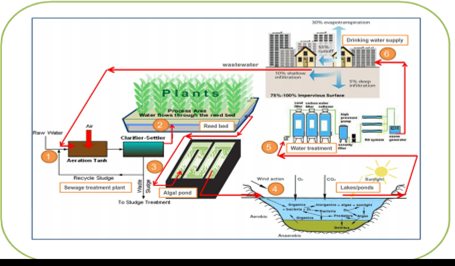
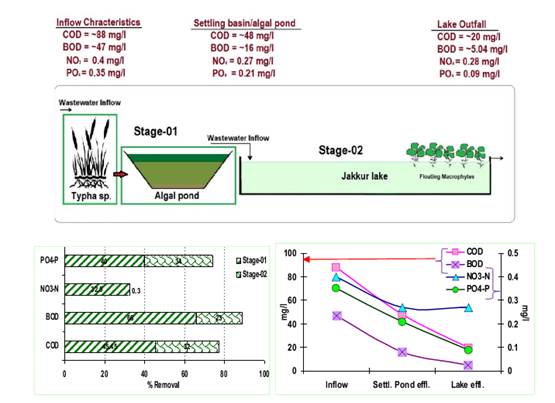
Integrated wetlands system consists of sewage treatment plant, constructed wetlands (with location specific macrophytes), algal pond integrated with a lake. This model is working satisfactorily at Jakkur. The sewage treatment plant removes contaminants ~ 76 % COD (380 mg/l – 88 mg/l); ~78 % BOD (220-47 mg/l); and mineralises organic nutrients (NO3-N, PO43—P to inorganic constituents. Integration of the conventional treatment system with wetlands [consisting of reed bed (with typha etc.) and algal pond] would help in the complete removal of nutrients in the cost effective way. Four to five days of residence time helps in the removal of pathogen apart from nutrients. However, this requires regular maintenance through harvesting macrophytes and algae (from algal ponds). Harvested algae would have energy value, which could be used for biofuel production. The combined activity of algae and macrophytes helps in the removal of ~45% COD, ~66 % BOD, ~33 % NO3-N and ~40 % PO43-P. Jakkur lake acts as the final level of treatment that removes ~32 % COD, ~23% BOD, ~ 0.3 % NO3-N and ~34 % PO43-P. The lake water with a nominal effort of sunlight exposure and filtration would provide potable water. Replication of this model in Bangalore would help in meeting the water demand and also helps in recharging of groundwater sources without any contamination. |
|
|
Constructed Wetlands: The loss of ecologically sensitive wetlands is due to the uncoordinated pattern of urban growth happening in Bangalore. This is due to a lack of good governance and decentralized administration evident from a lack of coordination among many para-state agencies, which has led to unsustainable use of the land and other resources. Failure to deal with water as a finite resource is leading to the unnecessary destruction of lakes and marshes that provide us with water. This failure in turn is threatening all options for the survival and security of plants, animals, humans, etc.
There is an urgent need for:
-
Restoring and conserving the actual source of water—the water cycle and the natural ecosystems that support it—are the basis for sustainable water management.
-
Reducing the environmental degradation that is preventing in attaining the goals of good public health, food security, and better livelihoods.
-
Improving the human quality of life that can be achieved in ways while maintaining and enhancing environmental quality.
-
Reducing greenhouse gases to avoid the dangerous effects of climate change is an integral part of protecting freshwater resources and ecosystems.
A comprehensive approach to water resource management is needed to address the myriad water quality problems that exist today from nonpoint and point sources as well as from catchment degradation. Watershed-based planning and resource management is a strategy for more-effective rejuvenation, protection and restoration of aquatic ecosystems and for protection of human health. In this regard, recommendations to improve the situation of the lakes are:
- The need for good integrated governance systems in place with a single agency with statutory and financial autonomy to act as the custodian of lakes for maintenance and action against polluters.
- Effective judicial systems for speedy disposal of conflicts related to encroachment
- Access to information for the public through digitisation of land records and availability of this geo-referenced data with query based information systems
- Measures to clean and protect lakes
- Removal of encroachments from lakes, lake water beds and storm water drains, regular cleaning of lakes.
- Proper measures such as fencing to protect lakes and prevent solid waste from going into lakes
- Install water fountains (music fountains) which enhances the aesthetic value of the lake and also aid as recreation facility to IT professionals (working in IT sector in this locality) and elderly people. This also helps in enhancing oxygen levels through aeration.
- Introduce ducks (which helps in aeration)
- Introduces fish (surface, column and benthic dwellers) which helps in maintaining food chain in the aquatic ecosystem. This has to be done in consultation with fish experts.
- No exotic fish species introduction avoid commercial fish culturing (commercial fishery)
- Decentralised treatment of sewage and solid waste (preferably at ward levels). Sewage generated in a locality /ward is treated locally and letting only treated sewage into the lake (Integrated wetlands ecosystem as in Jakkur lake). Integrated wetlands system consists of sewage treatment plant, constructed wetlands (with location specific macrophytes) and algal pond integrated with a lake. Constructed wetland aid in water purification (nutrient, heavy metal and xenobiotics removal) and flood control through physical, chemical, and biological processes. When sewage is released into an environment containing macrophytes and algae a series of actions takes place. Through contact with biofilms, plant roots and rhizomes processes like nitrification, ammonification and plant uptake will decrease the nutrient level (nitrate and phosphates) in wastewater. Algae based lagoons treat wastewater by natural oxidative processes. Various zones in lagoons function equivalent to cascaded anaerobic lagoon, facultative aerated lagoons followed by maturation ponds. Microbes aid in the removal of nutrients and are influenced by wind, sunlight and other factors (Ramachandra et al., 2014). This model is working satisfactorily at Jakkur. The sewage treatment plant removes contaminants (evident from lower COD and BOD) and mineralises organic nutrients (NO3-N, PO43- P) to inorganic constituents. Integration of the conventional treatment system with wetlands [consisting of reed bed (with typha etc.) and algal pond] would help in the complete removal of nutrients in the cost effective way. Four to five days of residence time in the lake helps in the removal of pathogen apart from nutrients. However, this requires regular maintenance through harvesting macrophytes and algae (from algal ponds). Harvested algae would have energy value, which could be used for biofuel production. The combined activity of algae and macrophytes helps in the removal of ~45% COD, ~66 % BOD, ~33 % NO3-N and ~40 % PO43- P. Jakkur lake acts as the final level of treatment that removes ~32 % COD, ~23% BOD, ~ 0.3 % NO3-N and ~34 % PO43- P. The lake water with a nominal effort of sunlight exposure and filtration would provide potable water. Replication of this model in rapidly urbanizing landscapes (such as Bangalore, Delhi, etc.) would help in meeting the water demand and also mitigating water scarcity through recharging of groundwater sources with remediation.
- Better regulatory mechanisms such as
- To make land grabbing a cognizable, non bailable offence
- Implementation of the polluter pay principle
- Ban on construction activities in the valley zones
- Restriction of diversion of the lakes for any other purposes
- Decentralised treatment of sewage and solid waste and restriction for entry of untreated sewage into the lakes
- Encouraging involvement of local communities: Decentralised management of lakes through involvement of local communities in the formation of local lake committees involving all stakeholders.
Area required for Constructed Wetlands:
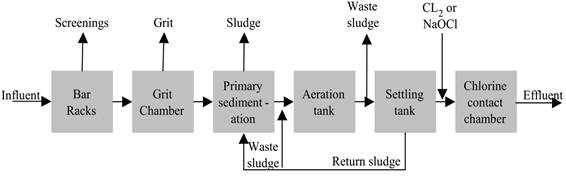
Taking advantage of remediation capability of aquatic plants (emergent macrophytes, free floating macrophytes) and algae, constructed wetlands have been designed and implemented successfully for efficient removal of nutrients (N, P, heavy metals, etc.). Different types of constructed wetlands (sub surface 0.6 m depth, surface: 0.4 m, could be either horizontal or vertical) are given in Figure 1. Area required for constructed wetlands depends on the influent sewage quality and expected treatment (BOD removal, etc) is given in equation 1 (Vymazal et.al, 1998). Estimates show that to treat 1 MLD influent, area required is about 1.7 hectares. Figure 2 gives the design of wetlands to treat 1 MLD.
A = Qd(lnCo – lnCt) / KBOD
where A = area; Qd= ave flow (m3/day); Co & Ct = influent & effluent BOD (mg/L); KBOD = 0.10
For example to treat influent (raw sewage: BOD: 60-80) and anticipated effluent (with BOD 10), area required is about 1.7 to 2 hectares. Table 1 lists bioremediation potential of macrophytes.
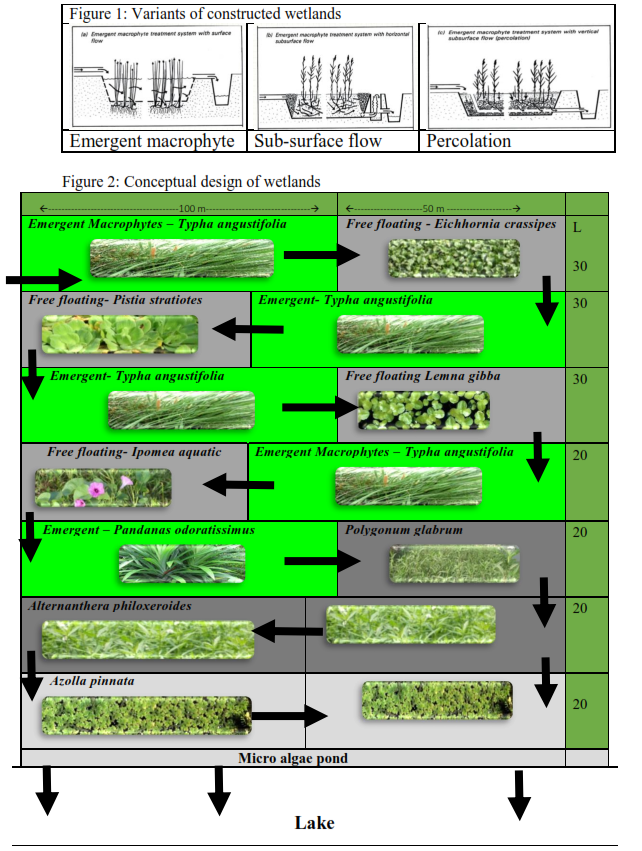
Table 1: Nutrient and heavy metal removal by Macrophytes
Macrophyte
|
Removal efficiency |
Reference |
Type of waste water/method |
N |
P |
COD/
BOD |
Heavy metals |
Water hyacinth |
65% (nitrate) |
65% (phosphate) |
75% |
|
Shahabaldin et al., 2013 |
Domestic wastewater/batch method |
50%(TN) |
50%(TP) |
50% |
|
Costa et al., 2014 |
Piggery waste with 20 days HRT |
21.78%-TN |
23.02%-TP |
64.44%-COD |
|
Jianbo Lu et al., 2008 |
Duck farm |
72%-N |
63%-P |
|
|
Tripathy et al., 2003 |
Dairy effluent |
|
|
|
Cr(95%) |
Mahmood et al., 2005 |
Textile wastewater |
|
|
|
Hg-119ng /g
Cd-3992µg/g
Cu-314 µg/g
Cr-2.31mg/g
Ni-1.68 mg/g
|
Molisani et al., 2006
KK Mishra et al., 2007
Hu et al., 2007
Verma et al., 2008 |
|
2161 mg N/m2/day or
7887 kg N/ha/yr |
542 mg P/m2/day or
1978 kg P/ha/yr |
|
|
K.R Reddy and J.C.Tucker, 1983 |
microcosm
aquaculture system |
Summer-1278 mg N/m2/day
Winter-254 mg N/m2/day |
Summer-243 mg P/m2/day
Winter-49 mg P/m2/day |
|
|
K. R. REDDY AND W. F. DE BUSK , 1985 |
microcosm retention ponds |
Pistia stratiotes |
Summer-985 mg N/m2/day
Winter-258 mg N/m2/day |
Summer-218 mg P/m2/day
Winter-72 mg P/m2/day |
|
|
K. R. REDDY AND W. F. DE BUSK , 1985 |
microcosm retention ponds |
|
|
|
Hg-0.57mg/g
Cr-2.5mg/g
Cd-2.13mg/g
Ni-1.95mg/g |
Mishra et al., 2009
Verma et al., 2008 |
|
|
Summer-292mg N/m2/day
Winter-70 mg N/m2/day |
Summer-87mg P/m2/day
Winter-18 mg P/m2/day |
|
|
K. R. REDDY AND W. F. DE BUSK , 1985 |
microcosm retention ponds |
Lemna minor |
|
|
|
Ti-221 µg/g
Cu-400 µg/g
Pb-8.62 mg/g |
Babic et al., 2009
Boule et al., 2009
Uysal and Taner 2009 |
|
194.9 ± 18.9 g TN/m2/yr |
10.4 ± 1.7 g TP/m2/yr |
3869 ± 352g COD/m2/yr |
|
Umesh et al., 2015 |
Manure slurry from dairy farm, surface flow wetland |
Summer-292mg N/m2/day
Winter-70mg N/m2/day |
Summer-87mg P/m2/day
Winter-18 mg P/m2/day |
|
|
K. R. REDDY AND W. F. DE BUSK , 1985 |
microcosm retention ponds |
Lemna gibba |
|
|
|
Ur-897 µg/g
As-1022 µg/g |
Mkandawire et al., 2004 |
|
Spirodela polyrhiza |
Summer-151mg N/m2/day
Winter-135mg N/m2/day |
Summer-34mg P/m2/day
Winter-34 mg P/m2/day |
|
|
K. R. REDDY AND W. F. DE BUSK , 1985 |
microcosm retention ponds |
Azolla |
Summer-108mg N/m2/day
Winter-48mg N/m2/day |
Summer-33mg P/m2/day
Winter-10mg P/m2/day |
|
|
K. R. REDDY AND W. F. DE BUSK , 1985 |
microcosm retention ponds |
Salvinia |
Summer-406mg N/m2/day
Winter-96mg N/m2/day |
Summer-105mg P/m2/day
Winter-32mg P/m2/day |
|
|
K. R. REDDY AND W. F. DE BUSK , 1985 |
microcosm retention ponds |
Typha angustifolia |
48-54 g/m2 |
|
|
|
Maltais-Landry et al., 2009 |
Mesocosm with daily total N loading rates 1.16 g/m2 |
|
|
|
Cr-20210 µg/g
Zn-16325 µg/g
7022 µg/g |
Firdaus-e-Bareen and Khilji, 2008 |
|
922 kg N/ha |
114 kgP/ha |
|
|
Abdeslam Ennabili et al., 1998 |
Field study: Coastal wetlands (freshwater or brackish systems) were studied in three river mouth areas in the Tingitan Peninsula |
Combination of Water hyacinth,
duckweed and blue-green
algae |
>90%(nitrate) |
>90% (phosphate) |
BOD-97% |
20-100% |
Sinha et al., 2000 |
Sewage water |
Quantities of elements that could be removed by continual culture of some aquatic plants (kg/ha/year) ( Reference:handbook of utilization of aquatic plants,FAO, http://www.fao.org/docrep/003/x6862e/X6862E11.htm)
Element |
Water hyacinth
(Eichhornia crassipes)
(kg/ha/year) |
Alternanthera philoxeroides
(kg/ha/year) |
Typha latifolia
(kg/ha/year) |
Nitrogen (N) |
1980 |
1780 |
2630 |
Phosphorus (P) |
320 |
200 |
400 |
Sulphur (S) |
250 |
180 |
250 |
Calcium (Ca) |
750 |
320 |
1710 |
Magnesium (Mg) |
790 |
320 |
310 |
Potassium (K) |
3190 |
3220 |
4570 |
Sodium (Na) |
260 |
230 |
730 |
Iron (Fe) |
19 |
45 |
23 |
Manganese (Mn) |
300 |
27 |
79 |
Zinc (Zn) |
4 |
6 |
6 |
Copper (Cu) |
1 |
1 |
7 |
RESTRICT PHOSPHATE BASED DETERGENTS IN INDIA
To mitigate Foaming or Algal Bloom in Water bodies of India
Source: Ramachandra T V, Durga Madhab Mahapatra, Asulabha K S, Sincy Varghese, 2017. Foaming or Algal Bloom in Water bodies of India: Remedial Measures - Restrict Phosphate (P) based Detergents, ENVIS Technical Report 108, Environmental Information System, CES, Indian Institute of Science, Bangalore 560012
Algal bloom or foaming is a consequence of nutrient enrichment (N and P) due to untreated sewage (mostly from human and household waste and detergents) and industrial effluents. The phosphorus from several sources reaching water bodies causes pollution leading to algal blooms, frothing, etc. Phosphorus represents both a scarce non-renewable resource and a pollutant for living systems. Primary nutrient, such as carbon, nitrogen, phosphorus, etc. contribute to eutrophication. In fresh water ecosystem, primary producers are able to obtain N from the atmosphere and hence phosphorus is the primary agent of eutrophication. Moreover, elements carbon, nitrogen and phosphorus can generate its weight by 12, 71 and 500 times, and hence phosphorous is the limiting element in primary producers. Nutrients enrichment often leads to profuse growth of invasive species (water hyacinth, etc.), which forms thick mat hindering the sunlight penetration. In absence of sunlight, photosynthetic activities cease affecting the food chain. Absence of sunlight penetration leads to the decline of primary producers (algae) in the region below the macrophyte mat. Most part of nitrogen available in the sewage and industrial effluents is assimilated by producers, while phosphorous gets trapped in the sediment. During pre-monsoon with high intensity winds, churning of lake water happens, leading to the release of phosphorous from sediments forming froth. Foaming is the manifestation of interactions among air bubble, surfactant and hydrophobic particles. The hydrophobic particles congregate at the air-water interface and strengthen the water film between air bubbles. Meanwhile, the particles also serve as collector for surfactant which stabilizes the foam. Surfactants contain slowly biodegradable surfactants and hydrophobic particles are the filamentous bacteria with a long-chain structure and hydrophobic surface. Thus, frothing is due to the presence of slowly biodegradable surfactants (eg. household detergents) from industrial or municipal wastewater, excess production of extracellular polymeric substance (by microorganisms, proliferation of filamentous organisms) and air bubble (wind).
Soaps and detergents belong to the group of chemicals - the surfactants, the group of anionic surfactants. The detergent contains the sequestering and chelating agents such as phos-phates to remove calcium and magnesium ions that are pre-sent in water and can reduce detergent action.
The surfactant nonylphenol ethoxylate (NPE), an endocrine disruptor and estrogen mimic; phosphates, which help remove minerals and food bits but cause harmful algal blooms in waterway.
|
Phosphates are low cost option to increase the efficacy of the detergent. However, phosphates act as nutrients to the environment and are largely responsible for problems to the environment. Problems are:
- excessive growth of algae, which cause eutrophication of water bodies.
- responsible for the formation of white foam which act as a barrier to entry of oxygen and light in the water, affect aquatic flora and fauna.
- Similar is the case of phosphate fertilizer used in farming, which also gets into water bodies.
|
Surface Aeration for Lakes to increase the dissolved oxygen levels in the water body.
SUGGESTIONS:
- Remove macrophytes – regularly (till the nutrient inflow into the lake is checked / or treated sewage is let into the lake)
- remove all blockades at outlets – so that water will move leading to natural aeration
- install surface fountains in the regions of stagnant water
- installation of fountains (surface aeration) enhances not only the aeration but also recreation value of the lake. Music fountains would aid in de-stressing as well as recreation
S No. |
Description |
Fountain (Surface Aeration) |
Bubble Aerator (Bottom Up Aeration) |
1 |
Oxygen transfer rate/efficiency |
Oxygen transfer upto 6 to 12”. |
10 times higher |
2 |
Cost |
Operating cost is high. |
relatively higher initial and regular maintenance cost |
3 |
Power Consumption |
Power requirement is higher |
less power when compared to surface aeration. |
4 |
Safety |
Requires insulation of cables |
Airline pipe can run to the air compressor which can be kept at some place isolated from water. |
5 |
Frothing |
No frothing |
Frothing is inherent. |
6 |
Clogging problem |
No problem of clogging. |
Clogging problem is inherent. System has a lifetime of 1-2 years. Biofilm may develop (clogging the filter). When this problem encounters, it starts consuming more energy. |
8 |
Suitability |
For shallow lakes |
For deeper lakes (Suitable to install at deeper points in our case). |
7 |
Miscellaneous |
a. Evaporation rates may increase.
b. prevents froth. |
Frequent cleaning is required. |
Waste-Water Treatment Unit Operations and Processes
The wastewater treatment bioprocesses transform minute solids and dissolved organic matter present in wastewaters into organic and inorganic solids that can be settled by application of flocculants.
Process analysis:
- Microbes as bacteria – transforms particulate carbonaceous colloidal matter and dissolved organics present in wastewater into bulkier cellular lumps/tissues and into gases as a metabolic by product.
- The gases escape into the environment
- The cellular masses are removed with the help of sedimentation tanks or clarifiers.
- The main objectives of Bio-treatments are to reduce organic matter in wastewaters mainly measured in the form of BOD, COD and TOC.
- Bio-treatments also remove nutrients (N and P) from wastewaters.
- These bioprocesses are used in tandem with other physico-chemical processes for attaining optimal effluent quality.
- Bio-processes technologies used in wastewater treatment can be broadly divided into three categories – Aerobic, Anaerobic and Anoxic
- These processes can be run either as suspended growth system or attached growth system or as a combination of both.
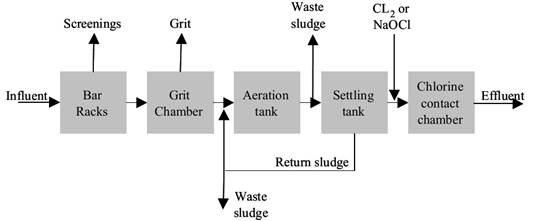
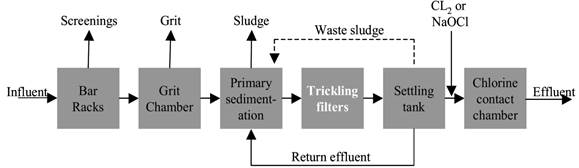
Working of Conventional Wastewater Treatment Systems: The conventional treatment set up for wastewaters comprise of primary, secondary and tertiary treatments (Table 3) that involves various steps
Screening is essentially to remove larger floating solids that take a very long tome for breakdown and decomposition. The screen comprises of an ordered array of flat metal plates that are welded to the horizontal bars at ~ 4 cm – 2 cm spacing. During the course of the water flow, the screens are juxtaposed perpendicular to the flow direction. The large amount of floating materials, sand debris, polymers etc stuck to the screen is removed manually or through other mechanical means. These floatable materials are then carried out as solid waste for proper disposal.
The grit removal process mainly intends to remove heavy and inert inorganic matter. Grit, dense coarse materials, sand, shells, gravel and other heavy inorganic matter tend to settle by sedimentation in the settling basin within a minute. The materials are then send to proper disposal sites.
The primary clarification happens in a settling basin that is intended for settling of heavier inorganic matter. These clarifiers have detention period of ~ 120 minutes and are mostly circular in shape. The settled materials on various parts of the clarifiers are scraped and pushed towards the centre with the help of rakers and the settled material mostly known as primary sludge are then transported to the through the primary sludge pump to the sludge digesters. Importantly in this exercise ~40 % of BOD and ~70 % of suspended solids are removed.
Secondary treatment involving suspended aerobic processes in carried out with the help of aerobic microbes. At this stage, the wastewater are mostly devoid of particulate inorganic and organic matter and comprise of decomposed or semi-decomposed organic matter i.e. carbohydrates, proteins, lipids, fibres etc., in the presence of oxygen and aerobic bacteria these compounds are broken down into simpler forms as carbon dioxide, ammonia, water etc. The microbial activity transforms these dissolved forms into flocculating biomass and the finer organic matter into settleable mass. The oxygen is provisioned through the help of surface aerators that helps in the growth of aerobic bacteria that are required for the decomposition of organic matter. The powerful surface aerators droves the wastewater through a mechanical churning process from the bottom of the aeration tank units and splatters it over the surface thus ensuring oxygenation mobilisation.
Secondary treatment involving attached growth processes involves of wastewater over a combination of media that acts as substrates for attachment and growth of microbes over the surfaces. In this biological process the surface grown biological microbial assembly absorbs the organic matter the wastewaters and starts multiplying of the surface of the substrates. When the weight of the surface biomass becomes critical is swept away by the trickling waters that captured in the subsequent settling units and are often recycled back. Various types of media can be used for development of the attached microbial communities as gravel, pebbles; granite of ~10-15 cm is often used in trickling filters.
The final round of settling the solids is performed by the secondary clarifiers where the microbial flocks comprising of cellular biomass and organic aggregates are made to settle. Usually these settling clarifiers are circular in shape and with a retention time of ~90-120 min. The same rakers are used to draw the settled sludge to the centre which is then carried for recirculation to the aerobic tanks or the trickling filters. The excess amount of the solid/sludge is transferred to the sludge thickeners that separate the excess water content in the sludge. This biological process ensures ~90% of BOD removal and ~90% of SS removal of the influent wastewater.
Table 3: Various wastewater treatment and process parameters
Physical |
Chemical |
Biological |
- Screening
- Comminute
- Flow equalization
- Sedimentation
- Flotation
- Granular-medium filtration
|
- Chemical precipitation
- Adsorption
- Disinfection
- Dechlorination
- Other chemical applications
|
- Activated sludge process
- Aerated lagoon
- Trickling filters
- Rotating biological contactors
- Pond stabilization
- Anaerobic digestion
- Biological nutrient removal
|
WWT Technologies working at Bangalore are
- ASP (Activated Sludge Process)
- EA (Extended Aeration)
- TF (Trickling Filters)
- UASB (Up-flow Anaerobic Sludge Blanket Reactor)
- SBR (Sequential Batch Reactor)
- MBR (Membrane Bio-Reactor)
- MBBR (Moving Bed Biofilm Reactor)
- CAB (Cascading Algal Bioreactor)
Comparative assessment of wastewater treatment process are given in Table 4.
Table: 4: Comparative assessment of wastewater treatment process
I |
Treatment Process: Activated-sludge process (ASP/EA) |
2 |
Sketch
 |
3 |
Technical details and Operation
ASP is microbial assisted wastewater stabilisation technique that runs continuously in an aerobic environment with the help of activated i.e. force suspended bacterial mass. In this process the clarified wastewater after preliminary treatment including primary settling in let into an aeration basin in which activated biomass mostly comprising of bacteria and protozoans aerobically degrade the wastewater organics into CO2, sludge mass (new cells) and other end products. The microbes that forms the activated biomass in ASP mainly comprise of gram negative bacteria, C and N oxidisers, floc/non-floc forming members, aerobic and facultative anaerobic bacteria. The other group of organisms are the protozoans that are flagellates, ciliates and amoeba. To maintain the aerobic environment for the growth and development of the above mentioned microbial communities aerobic conditions are maintained either with the help of mechanical or diffused aeration in the treatment basin. This also serves to maintain a completely mixed system essential to keep the contents in the reactor usually known as the mixed liquor distributed in the basin. With in a short retention time the organics are converted essentially into larger sludge masses and CO2, and then the mixed liquor is transferred to the secondary clarifier where the sludge/biomass is allowed to settle and the clarified effluent is all set for disposal and reuse. During this operation, a substantial part of the sludge from the secondary clarifier is recycled back to the aeration unit to maintain the activated biomass concentrations.
Land Area requirement: 0.09 Ha/MLD (0.1 Ha/MLD-Tertiary Treatment included)
Power requirement: 186 kWh/d/MLD |
4 |
Feasibility
This is the most widely used option for treatment of domestic wastewater for medium to large towns where land is scarce. ASP is only appropriate for a centralized treatment facility with the construction of long distance sewage channels, a well-trained staff, constant electricity, technical equipment (monitoring appliances), appropriate funding and a highly developed management system that ensures that the facility is correctly operated and maintained. Because of economies of scale and less fluctuating influent characteristics, this technology is more effective for the treatment of large volumes of flows of municipal wastewater from medium to large towns of 10000 - 1 million population equivalent. ASP works in almost every climate for the removal of both settable (physical primary treatment) and dissolved, colloidal and particulate organic matter and nutrients (biological removal in the activated sludge). The treatment capacity is low in colder environments. |
5 |
Economics:
Infrastructure/Capital Cost: Rs. 68 lakhs/MLD
OM Cost: Rs. 12 lakhs/MLD/Y
Running cost: 0.32 paisa/litre |
6 |
Suitability in the present context:
Unsuitable |
|
|
II |
Extended aeration (EA) |
1 |
Treatment Process: Extended aeration (EA) |
2 |
Sketch
 |
3 |
Technical details and Operation
This aerobic bioprocess can be considered as a small modification to the ASP where the untreated raw wastewater is directed straight away to the aeration basin without any primary clarification for treatment. Such simplifications tend to provide longer aeration time (thus called extended aeration) with retention and thus reduce the need for additional mechanisation. A high BOD removal through extended aeration makes it highly desirable that needs a tertiary treatment for a high effluent quality.
It is mostly preferred over ASP where the waste loads are relatively low and provides lesser needs for mechanisation. In case of ASP both clarifiers generate voluminous sludge that requires sludge treatment and processing before disposal. However EA agitates all wastewater and the sludge in a single clarifier. This results in high concentration of inert solids than in secondary sludge. Therefore a longer HRT with adequate mixing time is required for the digestion of primary solids in addition to organic matter in the dissolved form that produces an aged sludge. This requires greater energy per unit volume of the waste oxidised. Unlike conventional ASP aged sludge is produced in extended aeration process.
Land Area requirement: 0.08 Ha/MLD (0.1 Ha/MLD-Tertiary Treatment included)
Power requirement: 186 kWh/d/MLD |
4 |
Feasibility
Extended aeration is typically used to minimize design costs for waste disposal from small communities, commercial facilities and establishments, or schools. Compared to conventional ASP, a longer mixing time with aged sludge offers a stable biological ecosystem better adapted for effectively treating waste load fluctuations. In some instances C sources as sugar is added to sustain essential micro biota for treatment when the feed has no carbonaceous matter. Sludge has to periodically removed, as sludge volume approaches the storage capacity. |
5 |
Economics:
Infrastructure/Capital Cost: Rs. 68 lakhs/MLD
OM Cost: Rs. 11.75 lakhs/MLD/Y
Running cost: 0.32 paisa/litre |
6 |
Suitability in the present context: Unsuitable |
|
|
III |
Trickling Filters (TF) |
1 |
Treatment Process: Trickling Filters (TF) |
2 |
Sketch
 |
3 |
Technical details and Operation
Trickling filters are aerobic attached growth systems and are the most common biological treatment process in this category that efficiently removes wastewater organics. The TF comprises a bed made up of a highly permeable medium. This acts as a substratum to which several organisms are attached forming a bio-film, through which the wastewater percolates and falls off. The filter media are rocks or dense plastic matter used as packing material. The bio-film or the slimy layer absorbs the essential organic matter present in the wastewater and are also adsorbed on to the slimy layer. The outermost portion of the slimy layer comprise of aerobes that degrade the organic matter aerobically. With more exposure of the slimy layer with the nutrients in wastewater, the thickness of the bio-film grows and thus at deeper layers relative concentration of O2 is low, thereby promoting the growth of anaerobic microflora just near the filter medium. As the bio-film thickness increases in this attached growth process, the organic matter is completely degraded before it reaches the microbes near the surface of the filter media. This results in deprivation of nutrients which consequently leads to death of the surface micro-biota and are thus removed on their own by the velocity of the flowing liquor that is known as “sloughing”. The liquid after filtration is collected with the help of an underdrain system, in addition to bio solids, that gets detached from the surface of the medium. The collected treated water is then clarified with the help of a settling tank, where the solids are separated from the treated wastewater.
Land Area requirement: 0.25-0.5 Ha/MLD
Power requirement: 180 kWh/d/MLD |
4 |
Feasibility
This technology can only be used following primary clarification since high solids loading will cause the filter to clog. Since trickling filter only receive liquid waste, they are not suitable where water is scarce or unreliable. Moreover, trickling filters require some specific material (i.e. pumps and replacement parts) and skilled design and maintenance. A low-energy (gravity) trickling system can be designed, but in general, a continuous supply of power and wastewater is required. However, energy requirement for operating a trickling filter is less than for an activated sludge process or aerated lagoons (extended aeration).
Compared to other technologies (e.g., WSP), trickling filters are compact, but are still best suited for peri-urban or large, rural settlements. Trickling filters can treat domestic blackwater or brownwater, greywater or any other biodegradable effluent. They are typically applied as post-treatment for upflow anaerobic sludge blanket reactors or for further treatment after activated sludge treatment. Trickling filters can be built in almost all environments, but special adaptations for cold climates are required. Proper insulation, reduced effluent recirculation, and improved distribution techniques can lessen the impact of cold temperatures. |
5 |
Economics:
Infrastructure/Capital Cost: Rs. 4-5 million/MLD
OM Cost: Rs.5 lakhs/MLD/Y
Running cost: 0.141 paisa/litre |
6 |
Suitability in the present context: Unsuitable |
|
|
IV |
Up-flow Anaerobic Sludge Blanket Reactor (UASB) |
1 |
Treatment Process: Up-flow Anaerobic Sludge Blanket Reactor (UASB) |
2 |
Sketch
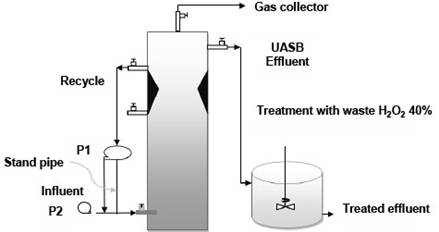 |
3 |
Technical details and Operation
Up-flow anaerobic sludge blanket (UASB) technology is an anaerobic wastewater treatment technique. The treatment process involves formation of a blanket of granular sludge that remains in suspension in the reactor. The wastewater is pumped upwards, through the blanket of sludge and in the mean time the organic matter present in the wastewater in degraded by the anaerobic microflora present in the sludge. The upward flow due to pumping in conjugation with the settling action of the sludge granules due to gravity helps in the suspension of the sludge blanket with the help of wastewater derived flocculants. The sludge forming process is slow, which initiates with the formation of small minute aggregates over which bacteria grows and eventually these aggregates form into dense and compact bio-films called granules. Anaerobic environment in conducing for the production of biogas in UASB that has high % of CH4. This gaseous by product can be captured and generate energy that reduces the running power cost. The UASB reactors are suitable for diluted wastewaters (<5 % TSS with particle size ~1 mm).
Land Area requirement: 0.1 Ha/MLD (0.11 Ha/MLD-Tertiary Treatment included)
Power requirement: 126 kWh/d/MLD |
4 |
Feasibility
A UASB is not appropriate for small or rural communities without a constant water supply or electricity and skilled labour. It is particularly adapted for densely populated urban areas as it has low land requirements. The technology is relatively simple to design and build, but developing the granulated sludge may take several months. The UASB reactor has the potential to produce higher quality effluent than Septic Tanks, and can do so in a smaller reactor volume. Although it is a well-established process for large-scale industrial wastewater treatment and high organic loading rates up to 10 kg BOD/m3/d, its application to domestic sewage is still relatively new. It is often used for brewery, distillery, food processing and pulp and paper waste since the process typically removes 80-90% of COD. Where the influent is low-strength or where it contains too many solids, proteins or fats, the reactor may not work properly. Temperature is also a key factor affecting the performance. UASB reach high treatment levels regarding organics and the produced biogas can be used for energy conversion. Pathogens, however, as well as nutrients are not removed. Due to the low nutrient removal, the effluent is adapted for reuse in agriculture after further treatment or considering some special health protection measures. UASB are not adapted for colder climates. |
5 |
Economics:
Infrastructure/Capital Cost: Rs. 6.8 million /MLD
OM Cost: Rs.11.53 lakhs/MLD/Y
Running cost: 0.28 paisa/litre |
6 |
Suitability in the present context: Suitable but requires further treatment |
|
|
V |
Sequential Batch Reactor (SBR) |
1 |
Treatment Process: Sequential Batch Reactor (SBR) |
2 |
Sketch
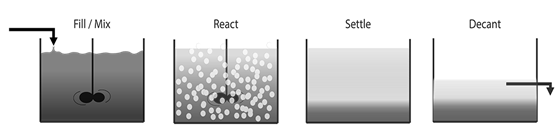 |
3 |
Technical details and Operation
A sequencing batch reactor (SBR) is a treatment process that consists of a sequence of steps that are carried out in the same containment structure, usually a tank reactor. They are also referred to as “fill-and-draw” systems. Although SBR systems exist that do not use aeration (anaerobic SBRs), a typical SBR system is designed to include aeration in the treatment step. A typical sequence for a SBR system is:
- FILL, when the tank is filled with fresh wastewater,
- REACT, when aeration and mixing are used to promote microbial removal of waste constituents,
- SETTLE, when aeration and mixing devices are turned off to allow settling of suspended solids, and
- DRAW, when clear effluent is drawn from the top of the reactor.
Waste solids can be removed from the reactor after the DRAW stage from the bottom of the tank, or during the REACT stage while the wastewater is completely mixed. The SBR treatment process requires a liquid waste input, so it is more suitable for flush systems than for scrape or pit-storage systems.
Land Area requirement: 0.045 Ha/MLD (0.05 Ha/MLD-Tertiary Treatment included)
Power requirement: 154 kWh/d/MLD |
4 |
Feasibility
SBRs are typically used at flow rates of 5 MGD or less. The more sophisticated operation required at larger SBR plants tends to discourage the use of these plants for large flow rates. As these systems have a relatively small footprint, they are useful for areas where the available land is limited. In addition, cycles within the system can be easily modified for nutrient removal in the future, if it becomes necessary. This makes SBRs extremely flexible to adapt to regulatory changes for effluent parameters such as nutrient removal. SBRs are also very cost effective if treatment beyond biological treatment is required, such as filtration. |
5 |
Economics:
Infrastructure/Capital Cost: Rs. 7.5 million /MLD
OM Cost: Rs.8.51 lakhs/MLD/Y
Running cost: 0.29 paisa/litre |
6 |
Suitability in the present context: Suitable but requires further treatment for nutrient removal |
|
|
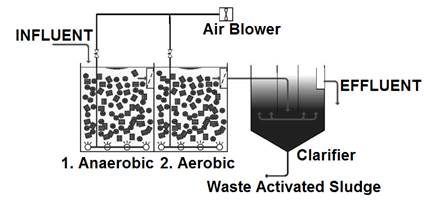
VI |
Membrane Bio Reactor (MBR) |
1 |
Treatment Process: Membrane Bio Reactor (MBR) |
2 |
Sketch
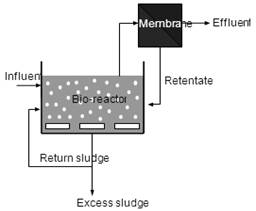 
|
3 |
Technical details and Operation
A membrane bioreactor functions with a coupled activity of membrane filtration with a biological active sludge system. Such systems help in replacement of the sedimentation basin as observed in classical biological purification and aids in separation of sludge from the effluent. This helps to ensure that all floating matter is retained, whereby sedimentation is no longer a restrictive factor for sludge concentration. A membrane reactor is thus able to process significantly higher sludge concentrations (10-20 g/l) with a lower reactor volume, compared to conventional systems.
The membrane can either be placed next to the biological basin (1. External or separate system), or in the basin (2. Internal or submerged). External systems involve continuous cross-flow circulation along the membranes. Both tubular and flat plate membranes are used to realise this. An internal system involves the effluent being extracted from the active sludge using under-pressure. This normally involves the use of hollow fibres or flat plate membranes. Micro and ultra filtration membranes are used for both types of MBR.
Land Area requirement: 0.45 Ha/MLD (No Tertiary Treatment required)
Power requirement: 302 kWh/d/MLD |
4 |
Feasibility
Membrane reactors are have been used throughout the world, for industrial as well as municipal wastewaters now. Membrane bioreactors can be used for biologically degradable wastewater flows as municipality wastewaters. The quality of the MBR permeate is greatly determined by the quality of the influent. Disruptive substances (e.g. long fibres or sharp particles) that can block or damage the membrane must be removed before wastewater is added to the MBR. Undissolved matter can normally be sufficiently removed using a simple sieve (gauze width 0.5 - 2 mm). Dissolved substances, primarily high calcium contents and aluminium salts, can also cause damage to the membranes. Specific toxic partial flows from, the chemical industry are not suitable unless sufficiently diluted with other process effluents.
Excess sludge is produced as a by-product and necessitates from the system on a regular basis. The cleaning fluids also need to be disposed of. AOX could form if cleaning is carried out using NaOCl. Pure oxygen (O2) can be used to introduce sufficient oxygen into the MBR. This will result in fewer problems with foam and odour-forming.The MBR combines a biological wastewater purification system with a physical process, which increases the complexity. Both steps require specific attention to process execution and optimisation of control parameters.
Full-scale MBR systems are normally thoroughly automated. Close follow-up is needed to allow the process to run correctly. |
5 |
Economics:
Infrastructure/Capital Cost: Rs. 30 million/MLD
OM Cost: Rs. 1.2 lakhs/MLD/Y
Running cost: >2 paise/litre |
6 |
Suitability in the present context: Suitable but can only used at decentralised levels |
|
|
VII |
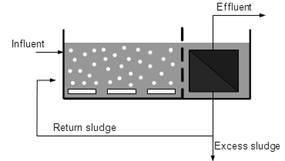
Moving Bed Biofilm Reactor (MBR) |
1 |
Treatment Process: Moving Bed Biofilm Reactor (MBR) |
2 |
Sketch
 |
3 |
Technical details and Operation
A Moving Bed Biofilm Recator (MBBR) reactor consists of a tank with submerged but floating plastic (usually HDPE, polyethylene or polypropylene) media having specific gravity less than 1. The large surface area of the plastics provide abundant surface for bacterial growth. Biomass grows on the surface as a thin film whose thickness usually varies between 50-300 μm. Medium or coarse bubble diffusers uniformly placed at the bottom of the reactor maintains a dissolved oxygen (DO) concentration of > 2.5-3 mg/L for BOD removal. Higher DO concentrations are maintained for nitrification. To retain the media flowing out of the tank, screens are placed on the downstream walls. A clarifier or a DAF is placed downstream of the MBBR tank to separate the biomass and the solids from the wastewater. No sludge recycle is required for this process.
Wastewater enters the Moving Bed Biofilm Reactor MBBR where the biomass attached to the surface of the media degrades organic matter resulting in BOD removal and/or nitrification depending on the type and characteristic of the wastewater. Organic carbon is converted to carbon dioxide and leaves the system while the ammonia and nitrogen in the organics are converted to nitrates through nitrification process. Oxygen required for the process is provided through the diffusers installed at the bottom of the reactor. The treated wastewater then flows through the screens to the downstream clarifier/DAF where the biomass and solids are separated from the wastewater.
Land Area requirement: 0.045 Ha/MLD (0.55 Ha/MLD-Tertiary Treatment included)
Power requirement: 224 kWh/d/MLD |
4 |
Feasibility
It is stable under load variations, insensitive to temporary limitation and provides consistent treatment results
Normally it generates low solids and requires no or minimum polymer for solid/liquid separation
MBBR requires a small footprint that is typically 1/3 rd the space required for ASP. Involves a low capital cost and is comparable to cost of ASP and is much is cheaper than the MBR process.
This has provisons for up-gradation i.e. existing plants can be upgraded easily with MBBR.
MBR is easy to operate, has automatic sludge wasting, has no sludge Return and no MLSS, and there no issue of media clogging. |
5 |
Economics:
Infrastructure/Capital Cost: Rs. 7.5 M/MLD
OM Cost: Rs.0.06-0.12 M/MLD/Y
Running cost: Rs.0.35/m3 |
6 |
Suitability in the present context: Suitable but can only used at decentralised levels |
|
|
VIII |
Cascading Algal Bioreactor (CAB) |
1 |
Treatment Process: Cascading Algal Bioreactor (CAB) |
2 |
Sketch
 |
3 |
Technical details and Operation
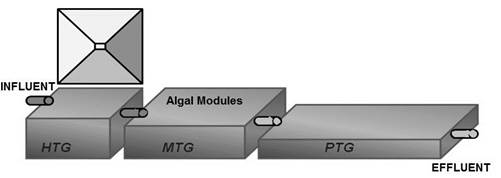
A cascading Algal bioreactor consists of a series of reactors mainly comprisisng of an initial anaerobic reactor, followed by micro aerophilic reactor and an aerobic reactor. This reactor is entirely gravity driven and works on spilling over after retention of 3-4 days. This basically works with an array of microbes working differently in various reactors as a function of nutrient concentration and redox. The open surface areas in the reactors 2 and 3 allows for aeration and sunlight penetration that helps in growth of select algal species. This bioprocess uses a combination of both attached and suspended algal consortia for wastewater treatment and solids removal. The water at the effluents requires a minimum detention for clarification. High DO levels upto 200 % saturation, is achievable with high nutrient removal ability. 99.99 % bacteria removal also takes place due to a higher retention and high light penetration together with photosynthesis aided pH increase mechanism. The initial reactor with a high C load becomes anaerobic and largely works with algal bacterial symbiosis. A baffled clarifier is used to separate the biomass from the effluent. This algal biomass that is often found to be valorisable can be further used as a feedstock for biofuel. No sludge recycle is required for this process and bulk of the biomass used is algae. However a small algal population can be recycled for efficient algal retention in the system.
Land Area requirement: 0.3 Ha/MLD (0.31 Ha/MLD-Tertiary Treatment included)
Power requirement: 6 kWh/d/MLD |
4 |
Feasibility
These bioreactors require a slightly higher area and open spaces for their operation. CAB can also be used to treat other categories of waste water as dairy, tannery, agricultural, poultry, aquaculture waste water etc. at a higher efficiency with a minimal cost. Such type of systems can be more adaptable due to its provisions for revenue generation by selling algal biomass as bio-diesel feed-stocks, single cell proteins, commercially important metabolites and pigments. These systems have chances of washouts and thus proper flow regulations are required. There are chances of bio-fouling and growth of undesired anoxic bacteria in the aerobic zones due to overloading. Seasonal grazer attacks are also possible due to favourable physico-chemical environment. |
5 |
Economics:
Infrastructure/Capital Cost: Rs. 2 lakhs/MLD
OM Cost: Rs.4.46 lakhs/MLD/Y
Running cost: 0.11 paisa/litre |
6 |
Suitability in the present context: Suitable at decentralised levels |
Figure 3 provides comparative account of performance of various wastewater treatment options. Table 5 lists the treatment efficiency and area requirement for WWTP, while Table 6 lists the relative advantages of various treatment technologies and Table 7 gives the comparative assessment of capital and OM Cost. Proposed wastewater treatment set-up for sewage influx is given in Figures 4 and 5 respectively.
Table 5: Treatment efficiency and area requirement for WWTP
Parameter |
Treatment Technologies |
ASP/EA |
UASB+EA |
SBR |
MBR |
MBBR |
CAB |
Treatment efficiency |
BOD, mg/l |
<20 |
<20 |
<10 |
<5 |
<30 |
<30 |
COD, mg/l |
<250 |
<250 |
<100 |
<100 |
<250 |
<100 |
TSS, mg/l |
<100 |
<100 |
<10 |
<5 |
<100 |
<100 |
Bacterial removal (log orders) |
~2-3 |
~2-3 |
~3-4 |
~5-6 |
~2-3 |
~4-5 |
TN rem. Efficiency (%) |
10-20 |
10-20 |
70-80 |
70-80 |
10-20 |
70-80 |
TP rem. Efficiency (%) |
- |
- |
80-90 |
- |
- |
60-70 |
Area Requirements |
Area Requirement (Ha/MLD) |
0.09 |
0.1 |
0.045 |
0.045 |
0.045 |
0.3 |
Sec + Tertiary Treatment |
0.1 |
0.11 |
0.05 |
0.045 |
0.055 |
0.31 |
Table 6: Relative advantages of various treatment technologies
Criteria |
ASP/EA |
UASB+EA |
SBR |
MBR |
MBBR |
AP |
Comm |
Comments |
Quality of Treated effluent |
++ |
++ |
+++ |
++++ |
++ |
++ |
|
++++ è very high |
Nutrient Removal potential |
+ |
+ |
+++ |
++ |
+ |
+++ |
|
+++ è high |
Low Land Requirement potential |
++ |
+ ++ |
+++ |
+++ |
+++ |
+ |
|
++è medium |
Low Capital Cost potential |
+++ |
+++ |
++ |
+ |
++ |
+++ |
|
+è low |
Low Power Requirement potential |
++ |
++++ |
+++ |
+ |
++ |
++++ |
|
++++ è very high |
Electricity generation potential |
+ |
++ |
+ |
+ |
+ |
+ + |
|
+++ è high |
Low O & M Skills potential |
+++ |
+++ |
++ |
+ |
+++ |
++++ |
|
|
Table 7: Capital and OM Cost
Cost estimation |
Treatment Technologies |
ASP/EA |
UASB+EA |
SBR |
MBR |
MBBR |
CAB |
Capital Cost |
Capital Cost in Rs. (Lakhs/MLD) |
68 |
68 |
75 |
300 |
68 |
2 |
OM Cost |
Power (kWh/d/MLD)
(Tech. + Other Use) |
186 |
126 |
154 |
302 |
224 |
6 |
Power cost [@ Rs. 6 per kWh] Rs./MLD/h |
46 |
31 |
38 |
76 |
56 |
6 |
Annual Power Cost (Lakhs/MLD) |
4.07 |
2.75 |
3.37 |
6.65 |
4.9 |
0.5 |
Annual Repair Costs (Lakhs/MLD) |
2.38 |
2.48 |
1.84 |
-- |
1.94 |
1.76 |
Annual Chemical Costs (Lakhs/MLD) |
5.3 |
6.3 |
3.3 |
-- |
5.3 |
7.2 |
Total Annual OM Costs (Lakhs/MLD) |
11.75 |
11.53 |
8.51 |
-- |
12.14 |
4.46 |
*Annual Man Power Cost (Lakhs) |
14.04 |
14.04 |
8.64 |
-- |
10.32 |
10.68 |
Treatment Cost, paisa/litre (Sec. levels) |
0.32 |
0.28 |
0.29 |
-- |
0.33 |
0.11 |
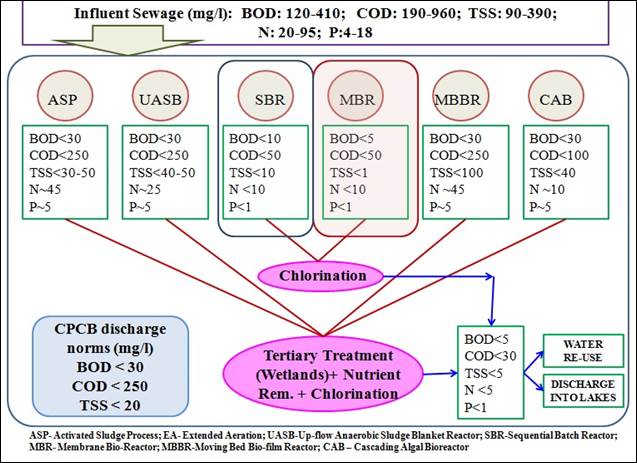
Figure 3: A comparative account of treatment performance of the WWT technologies
Figure 4: Proposed wastewater treatment set-up for lakes in V. Valley
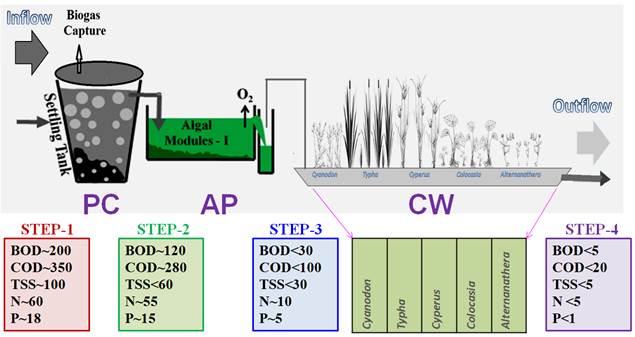
Figure 5: Proposed wastewater treatment set-up for downstream lakes receiving partially treated sewage
|
T.V. Ramachandra
Centre for Sustainable Technologies, Centre for infrastructure, Sustainable Transportation and Urban Planning (CiSTUP), Energy & Wetlands Research Group, Centre for Ecological Sciences, Indian Institute of Science, Bangalore – 560 012, INDIA.
E-mail : tvr@iisc.ac.in
Tel: 91-080-22933099/23600985,
Fax: 91-080-23601428/23600085
Web: http://ces.iisc.ac.in/energy
Vinay S
Energy & Wetlands Research Group, Centre for Ecological Sciences, Indian Institute of Science, Bangalore – 560 012, INDIA.
E-mail: svinay@iisc.ac.in
Asulabha K. S.
Energy & Wetlands Research Group, Centre for Ecological Sciences, Indian Institute of Science, Bangalore – 560 012, INDIA.
E-mail: asulabhas@iisc.ac.in
Sincy V.
Energy & Wetlands Research Group, Centre for Ecological Sciences, Indian Institute of Science, Bangalore – 560 012, INDIA.
E-mail: sincyv@iisc.ac.in
Sudarshan P Bhat
Energy & Wetlands Research Group, Centre for Ecological Sciences, Indian Institute of Science, Bangalore – 560 012, INDIA.
E-mail: sudarshanb@iisc.ac.in
Durga M. Mahapatra
Energy & Wetlands Research Group, Centre for Ecological Sciences, Indian Institute of Science, Bangalore – 560 012, INDIA.
E-mail: durgam@iisc.ac.in
Bharath H. Aithal
Energy & Wetlands Research Group, Centre for Ecological Sciences, Indian Institute of Science, Bangalore – 560 012, INDIA.
E-mail: bharathh@iisc.ac.in
| | |