| |
ENVIS Technical Report: 122, September 2017 |
 |
Rejuvenation Blueprint for Lakes in Vrishabhavathi Valley |
 |
Energy and Wetlands Research Group, Centre for Ecological Sciences, Indian Institute of Science, Bangalore – 560012, India.
*Corresponding author: cestvr@ces.iisc.ac.in
|
Bangalore city and Greater Bangalore: Bangalore is located in the Deccan plateau, toward the south east of Karnataka state extending from 12o49’5”N to 13o8’32”N in latitude and 77o27’29” E to 77o47’2”E in longitude (Figure 1). Spatially Bangalore urban area has spatially increased from 69 sq.km (1901), 161 sq.km (1981), 221 sq.km (2001) to 741 sq.km (2006, Greater Bangalore). The decadal (2001 to 2011) population increase in urban India is 31.8% and in Karnataka is 31.5%. However, Bangalore witnessed dramatic decadal increase of 44%. The population has increased from 4.3 Million (Bangalore city in 2001) to 8.4 Million (in 2011, Greater Bangalore) and the population density has increased from 7880 persons per square kilometre to over 11330 persons per square kilometre. Bangalore receives an annual average rainfall of 750-850 mm. Bangalore located on the ridge with the topography undulating from 700 m to about 962 m AMSL. Taking the advantage of undulating terrain, earlier administrators of the region constructed interconnected water bodies (lakes/tanks) to meet the domestic and irrigation demand in the region. This is evident from historical records, Ganga rulers (870 AD) had constructed Agara, Bellandur and Varthur lake systems to facilitate irrigation, agriculture and other needs (District Gazetteer of Bangalore, Chapter 4, 214-215,http://gazetteer.kar.nic.in/gazetteer/distGazetteer). Similarly earlier sensible rulers had constructed and managed many lakes [Mayisandra (1245 AD), Ramasandra (1340), Allalasandra (1544 AD), Tippasandra (Anekal taluk- 1614 AD), Tirumalapura (1766), Mattikere (1834)] to sustain irrigation, domestic and other anthropogenic needs. Integrated lake management through regular desilting activities were also reported at Ramasandra Lake (1515 AD). The interconnected lake system in Bangalore also aided in transporting storm water from the city centre to outskirts. Bangalore City (spatial extent in 1980’s is 161 sq.km) had about 274 lakes and was aptly known as city of lakes, which helped in recharging groundwater resources, moderating micro climate, supported local livelihood (fish, fodder, etc.), irrigation and domestic water demand apart from recreation facilities.
Bangalore landscape with undulating terrain forms three major watersheds (Figure 1) namely Koramangala and Challaghatta valley (K C Valley), Hebbal Valley and the Vrishabhavati Valley (V Valley). K&C valley is the largest catchment (255 sq. km.) in Bruhat Bengaluru (with spatial extent of 741 sq.km), followed by Hebbal valley (207 sq. km.) and Vrishabhavati valley (165 sq. km.). Interconnected lakes in KC and Hebbal valleys’ join at Nagondanahalli village (BBMP Ward 94 – Hagadur) and finally joins Dakshina Pinakin River. Interconnected lake systems in Vrishabhavathi valley joins Arkavathi River which is a tributary of the river Cauvery.
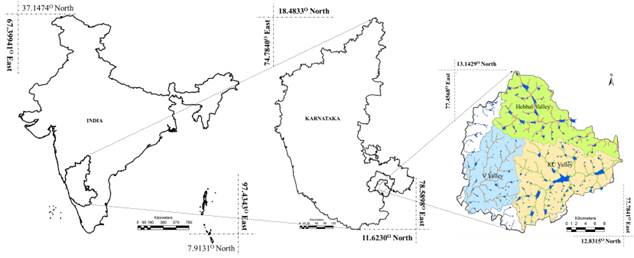
Figure 1: Location of KC-Valley (source: http://ces.iisc.ac.in/energy)
Bangalore is experiencing unprecedented rapid urbanisation and sprawl in recent times due to unplanned unrealistic concentrated developmental activities. This has led to large scale land cover changes with the serious environmental degradation, posing serious challenges to the decision makers in the city planning and management process involving a plethora of serious challenges such as loss of green cover and water bodies, climate change, enhanced greenhouse gases (GHG) emissions, lack of appropriate infrastructure, traffic congestion, and lack of basic amenities (electricity, water, and sanitation) in many localities, etc.
Urbanisation and loss of natural resources (wetlands and green spaces): Urbanisation during 1973 to 2017 (1028% concretization or increase of paved surface) has telling influence on the natural resources such as decline in green spaces (88% decline in vegetation), wetlands (79% decline), higher air pollutants and sharp decline in groundwater table. Figure 1 depicts the unrealistic urban growth during the last two decades. Quantification of number of trees in the region using remote sensing data with field census reveals that there are only 1.5 million trees to support Bangalore's population of 9.5 million, indicating one tree for every seven persons in the city. This is insufficient even to sequester respiratory carbon (ranges from 540-900 g per person per day). Geo-visualisation of likely land uses in 2020 through multi-criteria decision making techniques (Fuzzy-AHP: Analytical Hierarchal Process) reveals calamitous picture of 93% (Table 1) of Bangalore landscape filled with paved surfaces (urban cover) and drastic reduction in open spaces and green cover. This would make the region GHG rich, water scarce, non-resilient and unlivable, depriving the city dwellers of clean air, water and environment
(Source: Ramachandra T V and Bharath H. Aithal, 2016. Bangalore’s Reality: Towards unlivable status with unplanned urbanisation trajectory, Current Science (Guest Editorial)), 110 (12): 2207-2208, 25 June 2016)
Unplanned Urbanisation in Bangalore: Non-resilient and Unlivable with Unabated Senseless Concretisation
1028% increase in paved surface during 1973 to 2017
Solution: Enough is Enough, DECONGEST BANGALORE.
- SHIFT MAJOR INSTALLATIONS TO OTHER CITIES IN KARNATAKA,
-
STOP FURTHER INDUSTRIAISATION AND COMMERCIAL ESTABLISHMENTS IN BANGALORE.
-
PROTECT OPEN SPACES – LAKES, PARKS, ETC.
-
STOP FURTHER GROWTH OF DYING CITY – WITH WATER AND OXYGEN SCARCITY
-
BWSSB SHOULD STOP ISSUING NOC (No Objection certificate) TO MAJOR BUILDING PROJECTS AS THERE IS NOT SUFFICIENT WATER (either Cauvery water or Groundwater) IN THE CITY.
Bangalore is experiencing unprecedented rapid urbanisation and sprawl in recent times due to unrealistic concentrated developmental activities. This has led to the large scale land cover changes with serious environmental degradation, posing serious challenges to the decision makers in the city planning and management process involving a plethora of serious challenges such as climate change, enhanced emissions of greenhouse gases (GHG), lack of appropriate infrastructure, traffic congestion, and lack of basic amenities (electricity, water, and sanitation) in many localities, etc.
BENGALURU LAND USE, LAND COVER DYNAMICS
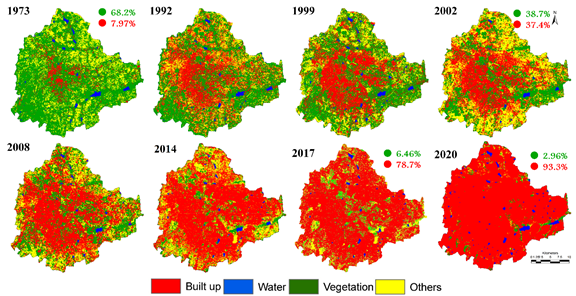
Figure 1: Land use dynamics in Bengaluru
Table 1: Land use dynamics of Bangalore - BBMP
Area |
Land use \ Class |
1973 |
1992 |
1999 |
2002 |
2008 |
2014 |
2017 |
2020 |
Hectare |
Built up |
5683 |
19452 |
25202 |
26890 |
35301 |
46626 |
56046 |
66455 |
Vegetation |
48650 |
32937 |
32616 |
27590 |
20090 |
5986 |
4603 |
2108 |
Water |
2424 |
1867 |
1608 |
1317 |
613 |
527 |
734 |
1491 |
Others |
14503 |
17004 |
11834 |
15462 |
15256 |
18121 |
9877 |
1206 |
Percentage |
Built up |
7.97 |
27.30 |
35.37 |
37.74 |
49.54 |
65.43 |
78.65 |
93.26 |
Vegetation |
68.27 |
46.22 |
45.77 |
38.72 |
28.19 |
8.40 |
6.46 |
2.96 |
Water |
3.40 |
2.62 |
2.26 |
1.85 |
0.86 |
0.74 |
1.03 |
2.09 |
Others |
20.35 |
23.86 |
16.61 |
21.70 |
21.41 |
25.43 |
13.86 |
1.69 |
DECONGEST BANGALORE - STOP UNPLANNED & IRRESPONSIBLE URBANISATION
Land use analyses carried using temporal (1970’s to 2016) remote sensing data shows an increase in built-up (paved surfaces; buildings, roads) from 5.39% (1973) to 89.56% (2016) with the decline in vegetation cover (92.3% to 8.94%), water bodies (1.05% to 0.26%) and other (open lands, agriculture) land uses (21.86% to 13.97%). There has been 1720% increase in concrete area during 1973 to 2016 with 68.6% loss of vegetation (Table 2). Predication of likely land uses reveals that 95% of the catchment would be concretised by 2020.
Table 2: Land use dynamics of V Valley
Area |
Land use \ Year |
1973 |
1992 |
1999 |
2003 |
2008 |
2012 |
2016 |
2020 |
Hectare |
Urban |
8451 |
50405 |
82904 |
94113 |
115523 |
153348 |
150316 |
180621 |
Veg |
144817 |
110271 |
77667 |
54308 |
45487 |
24390 |
14999 |
5690 |
Water |
1645 |
591 |
832 |
180 |
297 |
181 |
439 |
1488 |
Others |
34288 |
27934 |
21876 |
40600 |
27894 |
11282 |
23446 |
1402 |
Percentage |
Urban |
5.39 |
30.87 |
50.74 |
62.49 |
70.74 |
85.23 |
89.56 |
95.15 |
Veg |
92.31 |
67.54 |
47.53 |
36.06 |
27.85 |
13.56 |
8.94 |
3.00 |
Water |
1.05 |
0.36 |
0.51 |
0.12 |
0.18 |
0.10 |
0.26 |
0.78 |
Others |
21.86 |
17.11 |
13.39 |
26.96 |
17.08 |
16.27 |
13.97 |
0.74 |
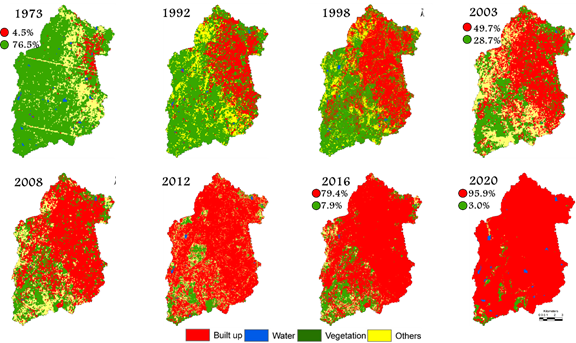
Figure 2: Land use dynamics in V Valley
References
- Ramachandra, T.V., Bharath, H.A. and Barik, B., Urbanisation Pattern of Incipient Mega Region in India, TEMA. Journal of Land Use, Mobility and Environment, 2014, 7(1), 83-100.
- Ramachandra, T.V., Bharath H. A.,and Durgappa, D. S., Insights to urban dynamics through landscape spatial pattern analysis, Int. J Applied Earth Observation and Geoinformation, 2012,18,329-343,.
- Ramachandra, T.V., Bharath, H. A.and Sreejith, K., GHG footprint of major cities in India, Renewable and Sustainable Energy Reviews, 2015, 44,473–495
- Ramachandra, T.V., Bharath, H. A., Vinay, S., et al., Trees of Bengaluru, ENVIS Technical Report 75, ENVIS, Centre for Ecological Sciences, IISc, Bangalore, 2014. 75p.
- Smart cities, Url: http://smartcities.gov.in/ (Last accessed on 20th May 2016)
3.0 VIOLATIONS IN VALLEY ZONES AND BUFFER ZONES OF WATER BODIES
Solution: evict all encroachments to restore and maintain hydrological integrity of valley zones and flood plains
Valley zones: Bangalore has the distinction of having inter connected lake systems. Valley zones connecting two lakes are to be protected to ensure the continuation of hydrological functions of the drains and flood plains. These have been designated as sensitive regions as per the revised master plan 2015 (RMP 2015 of BDA). However, valley zones in Bangalore are being abused despite norms to protect these fragile ecosystems. Wetland ecosystem and valley zones have been experiencing threat due to the large scale catchment alterations with changes in the land use land cover. The region forms a part of primary valley, which is sensitive regions as per the revised master plan 2015 (RMP 2015 of BDA). The landscape forms an integral part of the protected area (as it is in valley zone) as per the CDP 2015. The alterations of these wetlands initiated by filling the low lying areas with excavated earth debris, followed by other construction activities. The land fillings have breached both rajakaluve and lakes. Major violations are:
- LAND USE CHANGES WITH THE CONSTRUCTION ACTIVITIES IN THE PRIMARY VALLEY – SENSITIVE REGIONS (as per RMP, 2015 of BDA: Primary valleys in Bangalore are sensitive regions as per sensitive zone notification - Circular/35/BBMP/2008, dated: 26/11/2008) and buffer zone for primary valley is 100 m.
- KARNATAKA LAKE CONSERVATION AND DEVELOPMENT AUTHORITY ACT, 2014 - KARNATAKA ACT NO. 10 OF 2015; KAR. ACT 12, pg 462; National Wetland Atlas, SAC Ahmedabad, 2009; Wetland rules, MoEF, Govt of India, 2010, 2016; RAMSAR Definition of wetlands.
- Removal of wetlands affects Intergeneration Equity.
- Depriving local residents of water: Wetlands helps in recharge of groundwater in the region.
- Encroachment of Rajakalve and streams.
- Deprives local residents of clean, air and water (as per Article 21 of the Constitution of India).
- Dumping of building debris and excavated earth in Wetlands.
- Number of lakes in this catchment are reduced by 50% (from 70 to 35)
LAKES: CONTEMPORARY RELEVANCE
Lakes (wetlands) have been aiding in recharging groundwater resources, moderating micro climate, supported local livelihood (fish, fodder, etc.), irrigation and domestic water demand apart from recreation facilities. Washing, household activities, vegetable cultivation and fishing are the regular activities in the lake for livelihood. Multi-storied buildings have come up on some lake beds intervening the natural catchment flow leading to sharp decline and deteriorating quality of water bodies. Unauthorised construction in valley zones, lakebeds and storm water drains highlight the weak and fragmented governance. This is correlated with the increase in unauthorized constructions violating town planning norms (city development plan) which has affected severely open spaces and in particular water bodies. Problems encountered by Bangaloreans due to mismanagement of water bodies in Bangalore are:
- Decline in groundwater table: Water table has declined to 300 m from 28 m and 400 to 500 m in intensely urbanised area such as Whitefield, etc. over a period of 20 years with the decline in wetlands and green spaces.
- Recurring episodes of fish mortality: Large-scale fish mortality in recent months further highlights the level of contamination and irresponsible management of water bodies. Sustained inflow of untreated sewage has increased the organic content beyond the threshold of remediation capability of respective water bodies. Increasing temperature (of 34 to 35 °C) with the onset of summer, enhanced the biological activities (evident from higher BOD and Ammonia) that lowered dissolved oxygen levels leading to fish death due to asphyxiation.
- Floods: Conversion of wetlands to residential and commercial layouts has compounded the problem by removing the interconnectivities in an undulating terrain. Encroachment of natural drains, alteration of topography involving the construction of high-rise buildings, removal of vegetative cover, reclamation of wetlands are the prime reasons for frequent flooding even during normal rainfall post 2000. Causal factors and remedial measures to mitigate impacts of flooding are:
- Loss of interconnectivity among lakes due to encroachment of drains or dumping of solid wastes, Construction and Demolition (C & D) wastes
- Encroachment of flood plains and wetlands (construction in valley zones, flood plains and lake bed) and de-notifying lakes (under the guise of ‘dead lakes’ – no lake can be dead as it does the job of ground water recharge at least for few months)
- Narrowing and concretising storm water drains impairing hydrological functions of the natural drains
- Loss of pervious areas - reduction of open spaces, wetlands and vegetation cover
- Increased paved surfaces in the city (78% paved surface and likely to be 94% by 2020) due to unplanned irresponsible urbanisation by senseless decision makers.
- Heat island: Surface and atmospheric temperatures are increased by anthropogenic heat discharge due to energy consumption, increased land surface coverage by artificial materials having high heat capacities and conductivities, and the associated decreases in vegetation and water pervious surfaces, which reduce surface temperature through evapotranspiration. An increase of ~2 to 2.5 ºC during the last decade highlights implication of explosive urban growth on local climate, necessitating appropriate strategies for the sustainable management of natural resources.
- Ecosystem goods and services: Valuation of tangible benefits (fish, fodder, drinking water, etc.) reveal that wetlands provides goods worth Rs. 10500 per hectare per day (compared to Rs 20 in polluted lake), and sustains the local livelihood. This also emphasises the need for rejuvenation and sustainable management of water bodies.
Due to the sustained influx of fresh sewage over the last several decades, nutrients in all lakes in the V. valley catchment are now well over safe limits. This valley has been receiving about ~45% of the city sewage for over last 70 years resulting in eutrophication. There are substantial algal blooms, Dissolved Oxygen (DO) depletion and malodor generation, and an extensive growth of water hyacinth that covers about 70–80% of the lake in the dry season. Sewage brings in large quantities of C, N and P which are responsible for eutrophication, profuse growth of macrophytes and algal bloom. The restoration and conservation strategies has to be implemented for maintaining the ecological health of aquatic ecosystems, aquatic biodiversity in the region, inter-connectivity among lakes, preserve its physical integrity (shorelines, banks and bottom configurations) and water quality to support healthy riparian, aquatic and wetland ecosystems. The regular monitoring of water bodies and public awareness will help in developing appropriate conservation and management strategies.
The success of rejuvenation depends on:
- Good governance (too many para-state agencies and lack of co-ordination). Single agency with the statutory and financial autonomy to be the custodian of natural resources (ownership, regular maintenance and action against polluters (encroachers as well as those contaminate through untreated sewage and effluents, dumping of solid wastes). Effective judicial system for speedy disposal of conflicts related to encroachment.
- Digitation of land records (especially common lands – lakes, open spaces, parks, etc.) and availability of this geo-referenced data with query based information system to public;
- Removal of encroachment of lakes / wetlands, lake beds and storm water drains (connecting feeders) after the survey based on reliable cadastral maps; Ensure proper fencing of lakes and to make land grabbing cognizable non-bail offence;
- Restriction of the entry of untreated sewage and industrial effluents into lakes; Decentralised treatment of sewage (preferably at ward levels). Letting only treated sewage into the lake (as in Jakkur lake model); Ensure that sewage generated in a locality /ward is treated locally;
- Removal of nutrient rich sediments – to enhance the storage capacity, improve groundwater recharge, to minimise further contamination of treated water, etc.;
- Ban on use of phosphates in the manufacture of detergents; will minimise frothing
- Regular removal of macrophytes (Eichhornia sp., Alternanthera sp. etc.) in the lakes;
- Implementation of ‘polluter pays’ principle as per water act 1974;
- Plant native species of macrophytes in open spaces of lake catchment area;
- Stop solid wastes dumping into lakes / in the lake bed; Banning of filling of a portion of lake with building debris.
- Restrictions on the diversion of lake for any other purposes;
- Complete ban on construction activities in the valley zones.
- Decentralised management of lakes through local lake committees involving all stakeholders
|
Solutions: Ecological Management of Storm Water Drains and Wetlands to Mitigate Frequent Flooding in Bangalore |
- Reestablish interconnectivity among lakes by removing all blockades (encroachments, solid waste dumping)
- Protect Valley zones and Buffer regions of wetlands: protect valley zones considering ecological function and these regions are ‘NO DEVELOPMENT ZONES’ as per CDP 2005, 2015
- Stop narrowing and concretising natural drains
- Vegetation in the drain takes the load during peak monsoon, there is no need to concretise the channel.
- Vegetation allows groundwater recharge while treating the water (bioremediation);
- Drains with vegetation without any bottlenecks (hindrances) would be the best option to mitigate floods.
- Narrowing channel and concretizing would only increase the quantum of water and velocity, which would be disastrous.
- Objective should be towards mitigation of floods and not to generate high overland flows (with increased quantum and flow velocity)
- Experts should think sensibly with holistic knowledge (considering all subject knowledge) than fragmented narrow sectorial knowledge. Advice by pseudo experts would be detrimental as the society would be deprived of ground water, frequent floods and unnecessary livelihood threats.
- Decongest Bangalore
- Shift major installations to other cities in Karnataka,
- Stop further industriaisation and commercial establishments in bangalore.
- Protect open spaces – lakes, parks, etc.
- Stop further growth of dying city – with water and oxygen scarcity
- BWSSB should stop issuing senselessly NOC (no objection certificate) to major building projects as there is not sufficient water in the city.
- Environment clearance as per the norms of Environment Protection Act (2016), Wetlands (Conservation and Management) Rules, 2016, SWM 2016, C & D Wastes, 2016, Air act 1981, Water (prevention of Pollution) Act, 1974.
|
|
T.V. Ramachandra
Centre for Sustainable Technologies, Centre for infrastructure, Sustainable Transportation and Urban Planning (CiSTUP), Energy & Wetlands Research Group, Centre for Ecological Sciences, Indian Institute of Science, Bangalore – 560 012, INDIA.
E-mail : tvr@iisc.ac.in
Tel: 91-080-22933099/23600985,
Fax: 91-080-23601428/23600085
Web: http://ces.iisc.ac.in/energy
Vinay S
Energy & Wetlands Research Group, Centre for Ecological Sciences, Indian Institute of Science, Bangalore – 560 012, INDIA.
E-mail: svinay@iisc.ac.in
Asulabha K. S.
Energy & Wetlands Research Group, Centre for Ecological Sciences, Indian Institute of Science, Bangalore – 560 012, INDIA.
E-mail: asulabhas@iisc.ac.in
Sincy V.
Energy & Wetlands Research Group, Centre for Ecological Sciences, Indian Institute of Science, Bangalore – 560 012, INDIA.
E-mail: sincyv@iisc.ac.in
Sudarshan P Bhat
Energy & Wetlands Research Group, Centre for Ecological Sciences, Indian Institute of Science, Bangalore – 560 012, INDIA.
E-mail: sudarshanb@iisc.ac.in
Durga M. Mahapatra
Energy & Wetlands Research Group, Centre for Ecological Sciences, Indian Institute of Science, Bangalore – 560 012, INDIA.
E-mail: durgam@iisc.ac.in
Bharath H. Aithal
Energy & Wetlands Research Group, Centre for Ecological Sciences, Indian Institute of Science, Bangalore – 560 012, INDIA.
E-mail: bharathh@iisc.ac.in
| | |