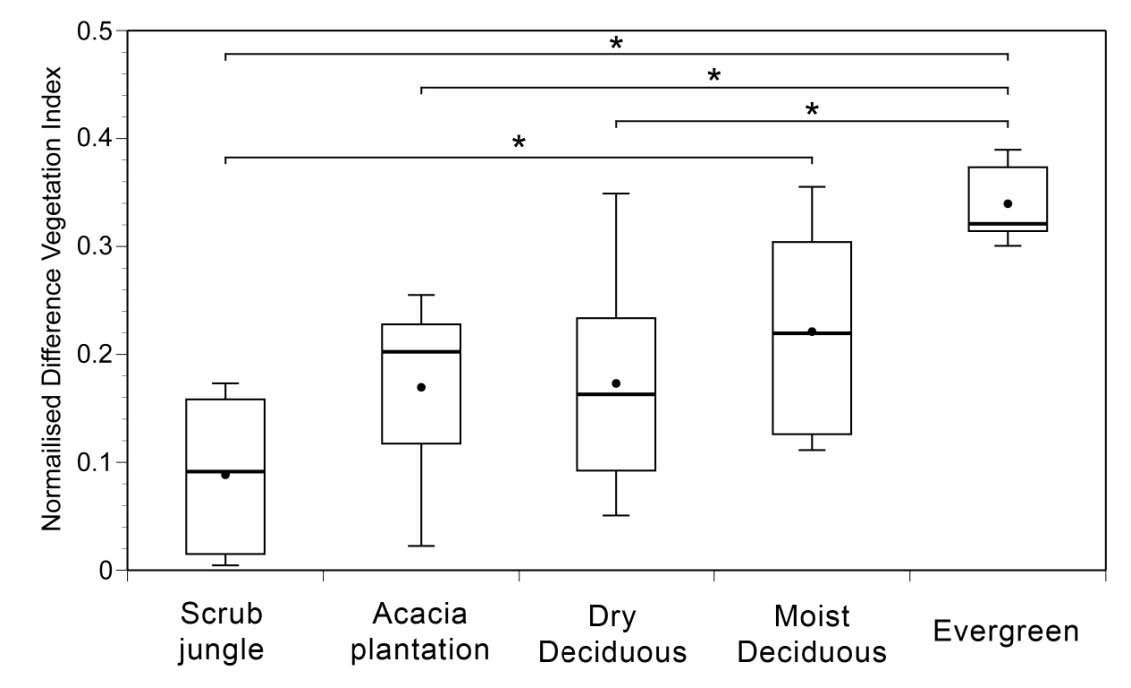
Our first analysis shows that LISS-derived NDVI
values mirror the general trend in supposedly
increasing biomass from scrub jungle to evergreen
forest (P < 0.001; F4,53= 6.5322, ANOVA; Fig. 2).
Evergreen forests habitats had NDVI values that
differed significantly from all habitats except moist
deciduous forests. NDVI values between scrub
jungles and moist deciduous forests were also
significantly different.
Nest site NDVI at the level of functional
groups was significantly different (P < 0.001,
F5,106=14.1029, ANOVA; Fig. 3). Hot Climate
Specialists and Opportunists occupied a narrow
range of NDVI niche, while Generalised
Myrmicinae occupied the broadest range. Posthoc>
tests revealed that NDVI at the nest sites of
Tropical Climate Specialists, Cryptic Species and
Specialist Predators did not differ and were
comparatively high (Fig. 3). NDVI at nest sites of
Opportunists were significantly different from nest
sites of Cryptic Species, Specialist Predators and
Tropical Climate Specialists but were similar to
Generalised Myrmicinae. NDVI at nest sites of Hot Climate Specialists were comparatively low and
were found to be similar to the niche occupied by
Opportunists and Generalised Myrmicinae. Our
results suggest that in terms of NDVI the
Opportunists and Hot Climate Specialists group
occupy a very narrow niche within the broad
habitat range of Generalised Myrmicinae (Fig. 3).
Analysis of nest site NDVI at the species
level revealed large differences (P < 0.001,
F12,118=9.2476, ANOVA; Fig. 4). Nesting sites of C.
taprobanae, O. smaragdina, H. saltator, L.
processionalis and P. diversus were found in areas
with a high mean and an intermediate variance in
NDVI. Nesting sites of Crematogaster sp. 1,
Pheidole sp. 2 and M. brunnea exhibited an
intermediate mean and a particular high variance
in NDVI. Nesting sites of A. gracilipes, P.
longicornis, T. albipes and M. bicolor were found
in areas with a low mean in NDVI and these species
displayed the lowest variance in NDVI at their nest
sites.
The above findings reflect fairly well the
habitat preferences of the studied ant species –
except for one of the specialist predators,
Pachycondyla rufipes (Fig. 5), whose nest sites
showed surprisingly low NDVI values (0.09 ± .069;
mean ± SD; n=11) and differed significantly (P <
0.05; t = – 2.046; t-test) from the ensemble NDVI of
all other nest sites examined (0.201 ± 0.106; mean ±
SD; n = 49). The nest site NDVI analysis suggests
that P. rufipes prefers to nest in scrub jungle – a
completely unexpected result, since we collected
P. rufipes only from deciduous and evergreen
forests, but never from scrub jungles or acacia
plantations. In the search for an explanation we
realized that previously we had observed the nesting locations of P. rufipes to be in dense
vegetation patches that had large gaps in the
canopy. We wondered if canopy breaks in dense
forests were indeed nesting sites of P. rufipes and
if these locations could be identified using NDVI.
Our subsequent analysis showed that prevalence
of P. rufipes in the NDVI range in which the species
was initially observed (0.015 – 0.1779), was not
significantly different between our validation and
initial dataset (P = 0.6223, U=28.0; Mann-Whitney
test). In fact, we found P. rufipes nests in all of the
17 new locations, which strongly supports our
hypothesis of P. rufipes’ preference for canopy
gaps in nest site selection. Our subsequent
analysis showed that prevalence of P. rufipes in
the NDVI range in which the species was initially
observed (0.015 – 0.1779), was not significantly
different between our validation and initial dataset
(P = 0.6223, U=28.0; Mann-Whitney test). In fact,
we found P. rufipes nests in all of the 17 new
locations, which strongly supports our hypothesis
of P. rufipes’ preference for canopy gaps in nest
site selection.