Taxonomy
The study area provides habitat for 93 species of
ants representing 36 genera (Narendra et al. in
review). Of these we here focus on the nesting
site characteristics of 13 species that represent
the major functional groups in this region
(Narendra et al. in review): Generalised Myrmicinae
(represented by Myrmicaria brunnea Saunders,
Crematogaster sp. 1, Pheidole sp. 2), Tropical
Climate Specialists (Cataulacus taprobanae Smith,
Oecophylla smaragdina (Fabr.)), Specialist
Predators (Harpegnathos saltator Jerdon,
Leptogenys processionalis (Jerdon),
Pachycondyla rufipes (Jerdon)), Opportunists
(Anoplolepis gracilipes (Smith), Paratrechina
longicornis (Latr.), Technomyrmex albipes (Smith),
Hot Climate Specialists (Meranoplus bicolor
(Guérin-Méneville)) and Cryptic Species
(Pheidologeton diversus (Jerdon)). Species
designation to functional groups was carried out
following Brown’s (2000) detailed distribution,
biology and ecology of world ant genera.
Ant sampling techniques
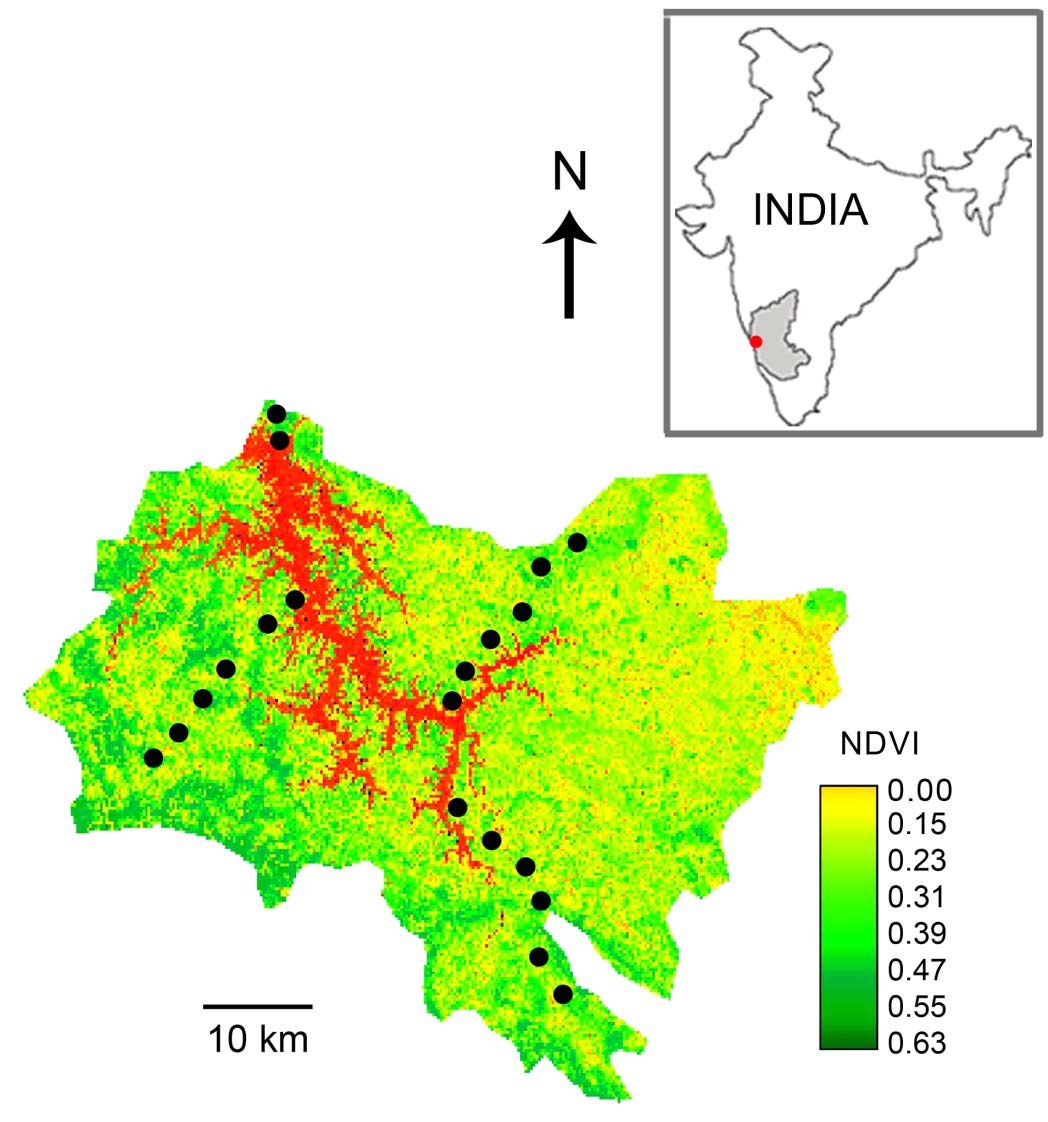
We sampled along three 20 km transects along
South, East and West sides of the reservoir and
one 4 km transact along the North side of the
reservoir (Fig. 1). The transect towards the North
was short as it was close to the reservoir. At 4 km
intervals along each transect we established three
sampling plots, each measuring 30 x 30 m. These
plots were along a mini-transect at 200 m intervals
and set perpendicular to the main transact. This
resulted in a total of 60 sampling plots, distributed
across five forest types: scrub jungles, acacia
plantations, dry deciduous forests, moist
deciduous forests and evergreen forests.
Between 2000 and 2002 we located nest sites
of the 13 focal ant species in each sampling plot. A
systematic visual sampling was carried out at each
plot during 09:00-11:00 h and 15:00-17:00 h which
involved checking under tree bark, rotting logs
and leaf litter. To increase our chances of locating
the nest we set up terrestrial and arboreal bait traps
and followed either the ant trail or individual
foragers that were returning to the nest with food.
Baits consisting of 70% honey, tuna fish and fried
coconut were provided as both terrestrial and
arboreal baits. Terrestrial baits were placed on the
ground and the arboreal baits were tied to a tree at
a height of two metres from the ground. The bait
traps were laid at 07:00 h and retrieved at 17:00 h.
The baits were checked once every 30 minutes
and ants that had visited the bait were recorded
and their nests were located. Presence or absence
of nests of each of the 13 species was determined
by a one-time sampling at each of the 60 plots.
Ants collected from the two methods were sorted,
cleaned in saltwater solution, preserved in 70%
ethyl alcohol and identified using keys provided
by Bingham (1903) and Bolton (1994). Scientific
names are based on the current nomenclature
(Bolton 1995) and were cross verified with the
online ant database (Agosti & Johnson 2005).
Specimens have been deposited at the Insect
Museum, Centre for Ecological Sciences, Indian
Institute of Science.
Remote sensing data
We used a single cloud-free multispectral satellite
image acquired on 5 March 1999 (Path 97 – Row
63) captured by the Linear Imaging Self-scanning
Sensor (LISS) onboard the Indian Remote sensing
Satellite IRS-1D. Data were purchased from the
National Remote Sensing Agency, Hyderabad,
India. The image covers the entire study area.
Bands 2 and 3 (VIS: 0.62 – 0.68; NIR: 0.77 – 0.86)
were extracted and geo-referenced by means of
ground control points, established during
fieldwork using a GPS receiver. Both bands feature
a spatial resolution of 23.5 m. Our use of the
satellite imagery acquired before the sampling
period is justifiable, since land cover in this region
had not changed significantly between these two
dates. Evidence for this comes from our analysis
of 2002 satellite imagery for this region
(unpublished results).
NDVI as surrogate for vegetation status
From these two bands we calculated the NDVI
following the established formula :
NDVI = (NIR-RED)/(NIR+RED)
(Lillesand et al. 2004). Using NDVI as a surrogate
for vegetation status in this region is justifiable
since the terrain in this region is very hilly and
NDVI is one of the vegetation indices that minimises topographic effects in vegetated areas
(Lillesand et al. 2004). Its value ranges from –1 to
+1; negative or near-zero values indicate nonvegetated
areas (e.g. soil, water), while positive
values represent vegetated areas.
Analyses
We identified five major habitats, without using
remote sensing data, to sample ants. Our first
question was hence to assess the correlation
between LISS-derived NDVI values at the visited
ant nest sites and the five habitat types. Our
motivation behind this was to validate the remotely
sensed NDVI data as a descriptor of the predefined
habitat types, before using it in support
of our interpretation of the relationship between
ant nest site choice and habitat type. To evaluate
this correlation, we extracted the NDVI values from
all nest sites using GIS software, grouped all ant
nest sites according to their designated habitat
type, and carried out an analysis of variance
(ANOVA) of the corresponding NDVI values
followed by a post-hoc Tukey test to assess
whether differences in NDVI were significant
between these groups.
Our second question was to find out
whether the ant functional groups to which the 13
species belong establish their nests at locations
characterised by different NDVI values. To test
this we grouped ant nest sites according to their
designated functional group (Brown 2000; also
see Andersen 1995, 2000). We then carried out an
analysis of variance (ANOVA) of the associated
NDVI values, followed by a post-hoc Tukey test
to assess whether differences in NDVI were
significant between these groups.
Our third question was to test whether
differences in NDVI values associated with ant
nesting locations were distinct at the species level.
To test this we carried out the same analysis as for
the functional groups using nest site NDVI values
grouped at species level.
Our fourth question was established in response
to the results we obtained from the three
analyses above. Most ant nests were found to be
associated with NDVI values that corresponded
well with the expected habitat type for the species
(see results section for details). For one of the 13
species, Pachycondyla rufipes, we obtained nest site NDVI values that were surprisingly low and
did not match the NDVI range of the habitat type
in which the species occurred. We tested this
against the NDVI values observed at all other nestsites.
To consolidate our interpretation of this result
(see discussion section for details), we conducted
an assessment of the robustness of P.
rufipes prevalence in this NDVI range using independent
data obtained from additional fieldwork.
We randomly selected 25 locations from previously
un-sampled regions with NDVI values in
the same range in which we had found P. rufipes
nests before (0.015 – 0.1779) and conducted a visual
all-out search for the nests of this species at
these sites. Due to topographical limitations only
17 of the 25 plots were visited. Next, we calculated
the respective prevalence value for our original
dataset, using only those locations, which featured
NDVI values within the same range (0.015 –
0.1779). We then compared both values to assess
whether the difference in prevalence was significant.
Non-parametric tests were used when data
was not normally distributed.