|
METHODOLOGY
Bioenergy resource assessment in the district level
Bioenergy resource availability
We employ an integrated approach of compiling data from government agencies and biomass inventorying of fuel wood, agro and animal residues. Primary data includes information from ground survey and remote sensing data. Secondary data are collected from respective government departments and literatures of previous studies.
Multispectral moderate resolution (30 m) cloud–free satellite images from Landsat (TM/ETM/ETM+ sensors) obtained in September/October months of 1989/90, 2000 and 2005/2006 covering the three districts of Solan, Shimla and Lahaul Spiti are collected from Global Land Cover Facility [http://glcfapp.glcf.umd.edu]. Since boundaries of the districts derived from Survey of India (SOI) toposheets cover more than one scene, mosaicking (combining the satellite images) and subsequent histogram matching (synchronizing the spectral reflectance of different images) corrections are performed. Bands of geo–corrected (geographic coordinates of satellite images are compared with ground control points) satellite images are masked and cropped with the district boundary. Land use analysis is performed on the satellite images using supervised Gaussian Maximum Likelihood Classification (GMLC) method categorizing the natural features like vegetation, water bodies, snow and open spaces. Training data were obtained from field and higher resolution (at least 15 m) spatial images from Google Earth (http://earth.google.com) were used for pre–classification error correction and post–classification validation. Although we tried to distinguish the land used for agriculture from total vegetation cover and built–up from open space, the varying spectral reflectance in the complex hill terrain due to high relief and shadow deteriorated the performance of the classification algorithm. The extent and temporal change of tree cover (also including horticulture plantation crops like apple, orange, peach etc), short vegetation (shrubs, crops, grassland), water and others (barren land, fallows, rocky terrain, built–up etc) are quantified from the classified satellite images with overall accuracy in the range of 75–90%. Vegetation is observed to vary primarily based on altitudinal gradients although species mixing towards upper and lower ranges have occurred in due course of time due to anthropogenic activities and climatic changes [14]. Training data corresponding to the land use types were derived from field (using Global Positioning System – GPS) and Google Earth (http://www.googleearth.com) along with the elevation contours generated from DEM. Remote sensing data (2005/06) of these districts were classified using these training data with the Gaussian maximum likelihood classifier. Classified data were validated with field data and accuracy assessment (Figure 3). This provided the extent and type of vegetation in the district.
The Aboveground Net Productivity of tree biomass (ANPtree) in forest vegetation has been quantified to assess the woody matter available for extraction. 70–90 % of the total forest biomass productivity is shared by trees and the rest by undergrowths of shrubs and herbs [17]. Nearly 60% and above of the total productivity of trees are attributed to the above ground biomass increment in the forests of Himachal Pradesh. Hence, ANPtree of three practical scenarios of high (75%), medium (50%) and low (25%) for availability of resources are considered.
The Net Calorific Values (NCV) of different tree species is above 4000 kcal/kg (dry weight) as per the literatures [48]. This value is used as energy equivalent in the total bioenergy estimation of woody biomass. The annual bioenergy available (Etree) from tree biomass resource of a particular vegetation type is calculated by equation 1
BEtree = Area * ANPtree * NCV (1)
The extent of agricultural land use mapped from the remote sensing data and the data from Department of Economics and Statistics, Ministry of Agriculture, Government of India [37]. The agriculture data includes crop types (cereals, vegetables, pulses, oilseeds, horticulture plantation, oilseeds, cotton, sugarcane, fodder crops and narcotics) with yield of crops (final product) for the years 2000 to 2005 in the three districts. Horticulture plantations of apple, orange, peach etc have been included in the woody biomass estimated using remote sensing data. Biomass residues from vegetables are negligible on field. The agro residues (cereals, pulses, oilseeds, cotton and sugarcane) and their production are calculated from the Residue to Product Ratio (RPR) considering the yield of respective crops [49]. The NCV of crop residues identified in the region are observed to range from 3000 – 4200 kcal/kg [49–53] and NCV of crop residues for three scenarios (viz. 3000, 3500 and 4000 kcal/kg) were considered assuming efficient energy conversion. Considering the multiple uses of crop residues as fodder, manure, mulch etc, the final residue production per area (R) available as fuel is accounted for high (75%), medium (50%) and low (25%) availability scenarios. The annual bioenergy from a particular crop residue is computed by equation 2.
BEcrop = Gross cropped area *R* NCV (2)
Table 4: Crop types, productivity, residue types, residue to product ratio and energy equivalents considered
| Crop |
Type |
Productivity
(t/ha/yr) |
Residue type |
Residue to product ratio |
Energy equivalent (kcal/kg) |
| Cereals |
Rice |
1.84 |
Husk |
0.29 |
3000 |
| Stalk |
1.5 |
3000 |
| Wheat |
1.47 |
Stalk |
1.6 |
3500 |
| Bajra |
0 |
Cobs |
0.33 |
3500 |
| Husk |
0.3 |
3000 |
| Stalk |
2 |
3500 |
| Maize |
1.97 |
Cobs |
0.27 |
3500 |
| Husk |
0.2 |
3000 |
| Stalk |
2 |
4000 |
| Barley |
0.86 |
Stalk |
1.3 |
3000 |
| Others |
0 |
Stalk |
1.4 |
3000 |
| Pulses |
Gram |
0.88 |
Stalks |
1.1 |
3500 |
| Tur/arhar |
0 |
Husk |
0.3 |
3000 |
| Stalk |
2.5 |
3000 |
| Kharif |
0.76 |
Husk |
0.18 |
3000 |
|
Stalk |
1.1 |
3500 |
| Rabi |
0.67 |
Stalk |
1.2 |
3500 |
| Oilseeds |
Groundnut |
0.9 |
Shell |
0.33 |
4000 |
| Stalk |
2 |
4000 |
| Sesamum |
0.2 |
Stalk |
1.5* |
3000 |
| Rapeseed & Mustard |
0.49 |
Husk & Stalk |
1.5 |
3500 |
| Soyabeen |
1.37 |
Stalk |
1.7 |
3000 |
| Others |
0.2* |
Stalk |
2 |
3500 |
| Others |
Cotton |
0.72 |
Shell & husk |
2.2 |
3000 |
| Stalk |
3t/ha |
3000 |
| Sugarcane |
0.87 |
Bagasse |
0.33 |
3500 |
| Top & leaves |
0.05 |
3500 |
| *Data for which no references were available and hence approximated based on the conservative values |
The district wise livestock population of cattle, buffaloe, yak, mithun, sheep, goat, horse, pony, mule, donkey and pig are collated from the livestock population census 2007, Department of Animal Husbandry, Government of Himachal Pradesh [54]. The dung yield per livestock type are given in Table 5 [15, 48, 56–58] and lower, moderate (average of lower and upper) and upper dung yield cases are considered. Biogas generated based on animal dung vary from 0.036 to 0.042 m3/kg [15]. However, cold conditions in the study region suggest lower value of 0.036 m3/kg biogas generation. NCV of biogas is consistently over 5000 kcal/m3 [55]. Alternative uses of animal dung as direct manure and constraints of dung collection during grazing restrict its availability for biogas generation. Here three scenarios of high (75%), medium (50%) and low (25%) animal dung availability are considered for biogas generation. The annual bioenergy yield from livestock is calculated as
BElivestock= Total annual dung yield from livestock * Volume of biogas per mass of dung * NCV (3)
Table 5: Livestock in the study region and dung yield
| Livestock |
Dung yield (kg/head/day) |
Reference |
| Cattle |
2.87 |
[48] |
|
10 |
[56] |
|
3–7.5 |
[15] |
| Buffaloe |
2.65 |
[48] |
|
15 |
[56] |
|
12–15 |
[15] |
| Yak |
4.5 |
[57] |
| Mithun (Bos frontalis) – |
[48] |
| Sheep |
0.32 |
[48] |
|
0.1 |
[15] |
| Goat |
0.35 |
[48] |
|
0.1 |
[15] |
| Horse |
1.72 |
[48] |
|
6.08 |
[58] |
| Pony |
– |
– |
| Mule |
0.94 |
[48] |
| Donkey |
– |
– |
| Pig |
0.34 |
[48] |
| Camel |
2.49 |
[48] |
Total annual bioenergy available from bioresources including forests, agriculture residues and animal residues in a region is calculated using equation 4
BEavailable = BEtree +BEcrop + BElivestock (4)
The different scenarios of low (25%), medium (50%) and high (75%) fuel based availability of the bioresources account for practical constraints in satisfying alternative needs.
Bioenergy resource demand
The PCFC in Solan, Shimla and Lahaul Spiti was computed from the data compiled from household surveys and literatures (Table 3). Bioenergy resource availability is assessed for the period 2005/2006 and the district–wise population is projected for the year 2006 from 2001 census [59, 60]. Considering 4000 kcal/kg energy equivalence of woody biomass, the domestic heating and cooking energy (majorly bioenergy) demand is given by
BEdemand = Annual PCFC*Population* NCV (5)
Bioenergy resource status
The total woody biomass production in each district compared to the heating and cooking energy demand of the population indicate the ecological health of the region. The total bioenergy availability (including woody biomass, agro residues and animal dung) to bioenergy demand ratio gives the bioenergy resource status of the region.
BEstatus = BEavailable / BEdemand (6)
The different scenarios of high (75%), medium (50%) and low (25%) biomass availability are compared with the lower, moderate and upper case bioenergy demand. If the value of Estatus is above one, the region is surplus in bioenergy resources while a ratio below one denotes deficit. A bioenergy deficit status emphasizes adopting innovative and sustainable practices of enhancing the resources while improving the end use efficiency of the devices [15].
Bioenergy resource assessment in the village level
Bioresource assessment at district level provides an overview of the bioenergy status. However, the availability and consumption vary spatially and regionally. In order to understand the bioresource availability dynamics, the ecological status of the forest as well as the actual availability of the bioresources in the villages for meeting their bioenergy requirements have been studied. Fragmentation of forests is one of the decisive parameters in the availability of bioresources. Also an attempt is made to spatially analyse the degradation levels with the demand centre – villages in the watersheds of Solan and Shimla districts.
Fragmentation of forests
Forest fragmentation is a process by which a contiguous area of forest is reduced and divided into multiple fragments ultimately leading to deforestation. Fragmentation of forests is assessed using remote sensing data for Moolbari and Mandhala watersheds of Shimla and Solan districts respectively.
Multispectral and temporal satellite images covering Moolbari watershed (1341 ha) are downloaded from GLCF (http://glcf.umiacs.umd.edu/data/) and also procured from National Remote Sensing Agency, Hyderabad, India. These include images with diverse spatial and spectral resolutions acquired from Landsat MSS (1972), Landsat TM (1989), Landsat ETM+ (2000) and IRS LISS–III (2007). SOI toposheets of 1:50000 and 1:250000 scales are digitized to derive boundary layer of the watershed which is used to mask and crop the region out of the satellite image. Land use (type of features like crops, built–up etc associated to human activities) and land cover (natural features like tree cover, water body, snow etc) analyses are performed on these satellite images using various classification algorithms like GMLC. Ground control points (GCPs) for geo–correction and training data for classification of remote data are collected through field investigations using a handheld GPS (Global Positioning System). Google Earth data (http://earth.google.com) are used for pre–classification and post–classification validation. Similar methodology is followed for Mandhala watershed (1453 ha) in Solan district. The extent of forest fragmentation is assessed using FRAGSTATS®
Biomass degradation analysis
Biomass degradation analysis maps the resource availability with respect to the bioenergy demand of inhabiting villages in the vicinity. The extent of woody biomass meeting the bioenergy requirements of 7 villages in Moolbari watershed is mapped using remote sensing (IRS LISS III) and Geographical Information Systems (GIS) tools. Classification of remote sensing data provided the land use and also helped in mapping the resource availability around each village. The watershed is divided in to 7 zones using theissen polygon method (based on the proximity of the village to the resource availability) such that each zone represents corresponding villages’ proximity area (village zonation theme). Multiple ring buffers are drawn around villages at 100 m interval up to 1000 m (10 rings). The buffer themes are clipped using village zonation theme and those falling on other village zones are deleted. ANPtree of forest cover is taken to be 3.6 t/ha/yr and PCFC as 2.3 kg/day and 1.9 kg/day in lower and upper case demand scenarios respectively. Finally, thematic maps are created for both the scenarios to understand the level of bioresources degradation.
DSS for regional bioenergy resource planning
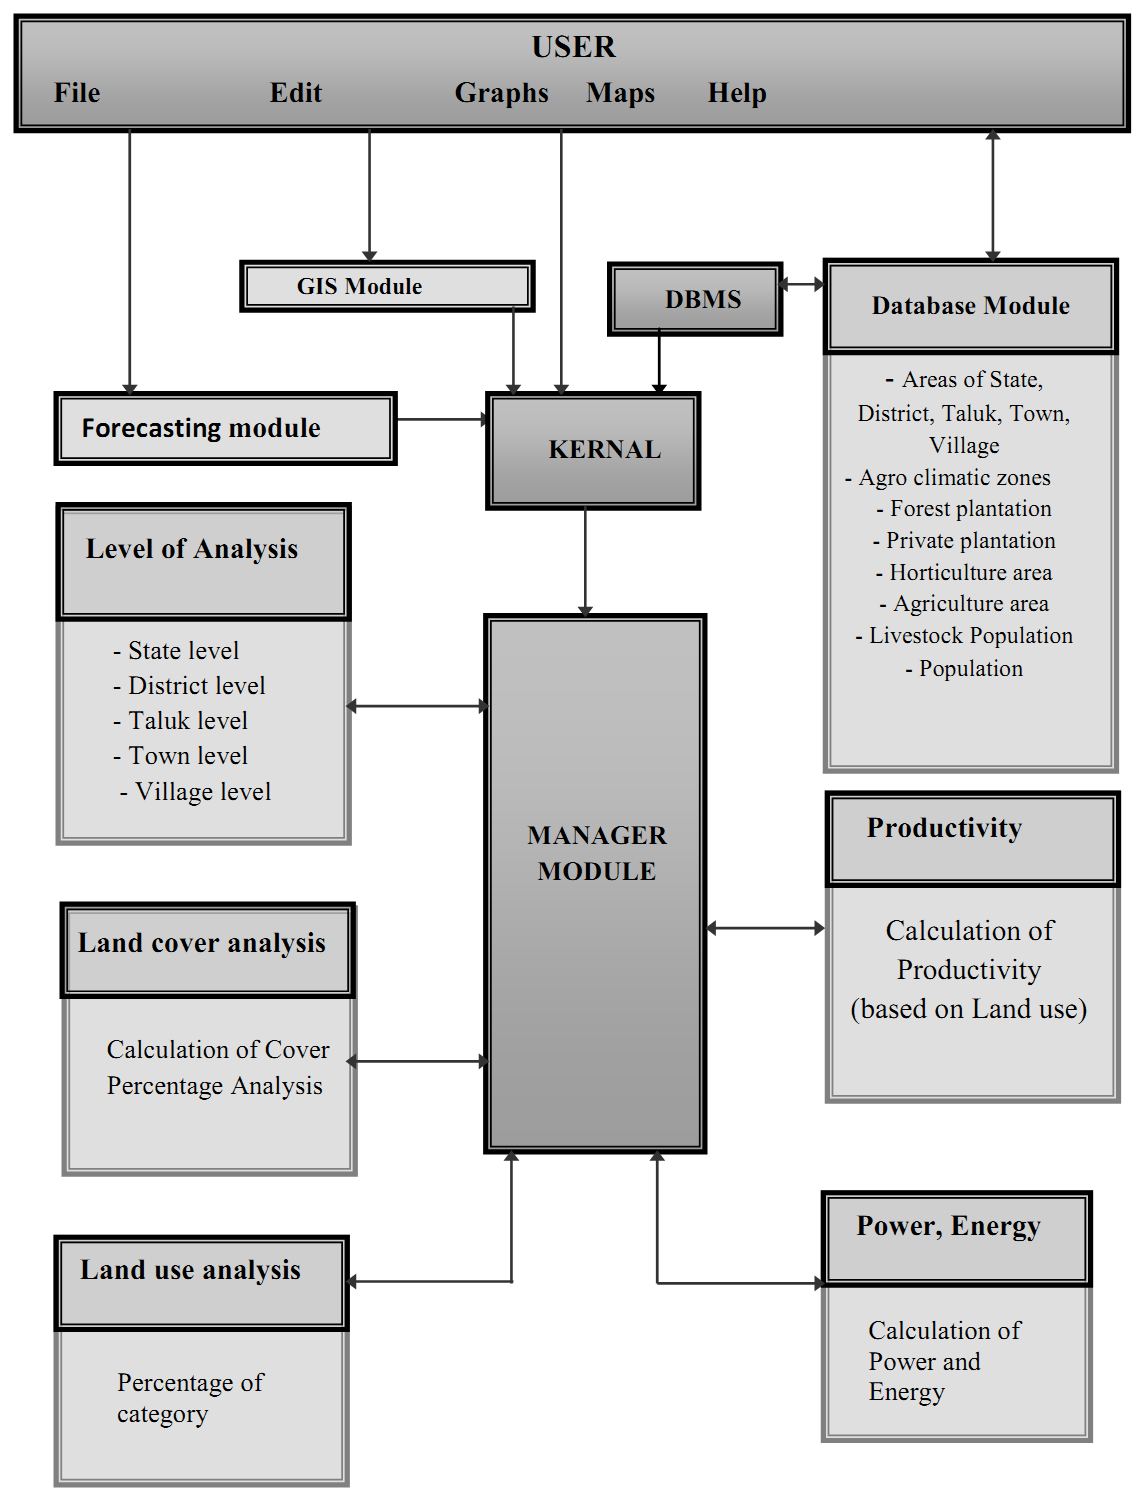
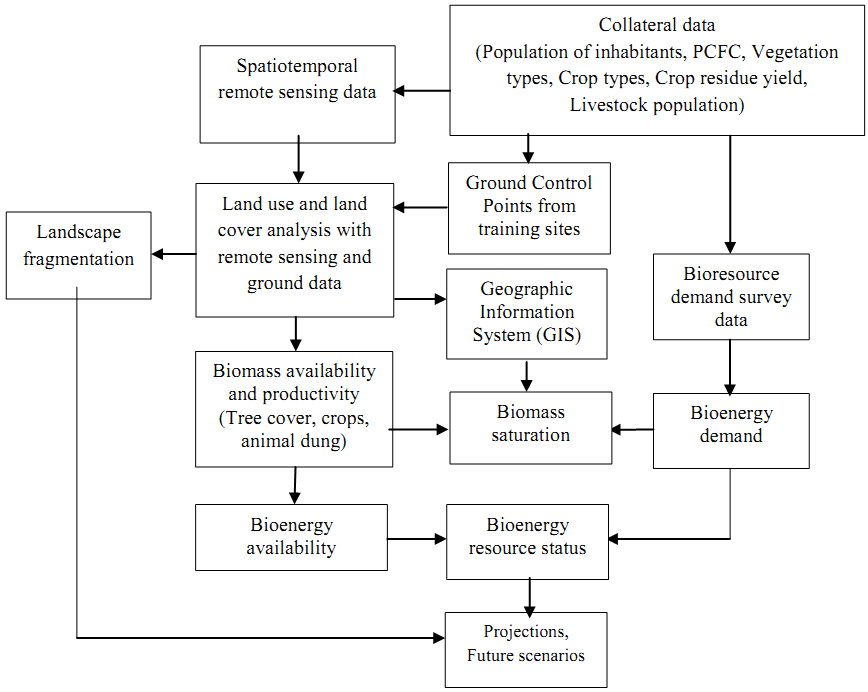
A DSS for assisting regional bioenergy resource planning is developed using Microsoft Visual Basic 6.0 as frontend and Microsoft Access database as backend [6, 7]. It comprises of different modules enabling data management, processing, interpretation, modeling, projection and visualization (Figure 2). In the database module, the data collected from primary (ground surveys, spatial data) and secondary sources (Government departments, records, literatures) are stored in a database which is easily accessible for retrieval, updating or editing. This includes information on forest vegetation, plantation, crops, cattle and other sources of bioenergy. Data redundancy is minimized through normalized data tables. GIS provides the capabilities such as spatial and temporal analysis, querying and visualization which helps the location based decentralized planning. Land cover land use (LCLU) analysis module calculates the extent of vegetation cover in a region using remote sensing data. Temporal changes in land cover have been analyzed for studying trends of resource availability or degradation. Land use module helps in mapping the extent of different land use pattern (agriculture, plantation, forests etc.) in a region. The flexibility to enrich the database with spatial aspects helps to identify and quantify the local constraints in the resource management. Level of analysis module helps in hierarchical data input and analysis. Bioresource yield module computes sector–wise resource yield based on spatial extent (forest, agriculture, plantation etc.) and productivity. Energy module computes the available energy for the selected bioresource at selected level. Forecasting module helps in projecting the resource status to future conditions and facilitates alternative approaches so as to reduce possible resource crunch. This enables the planner to access and study bioenergy resource status in the village level to national level in a bottom up approach of resource planning [7]. The method flow diagram of DSS designed for regional bioenergy resource estimation and planning is given in Figure 3.

Figure 2: Design of DSS for bioenergy resource assessment and planning
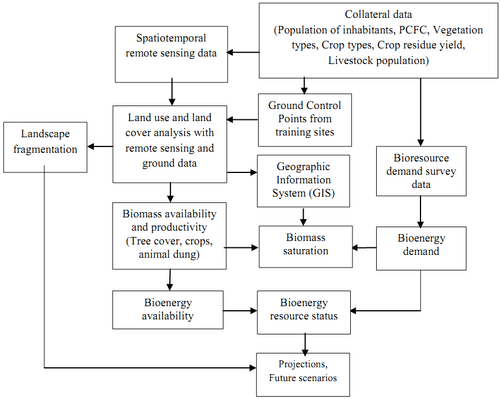
Figure 3: DSS methodology for bioenergy resource assessment and planning
|