Results and discussion
5.1 Solar energy potential (Seasonal variations of solar insolation) assessment in Uttara Kannada
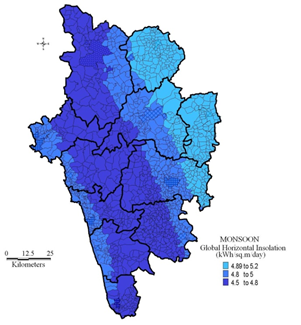
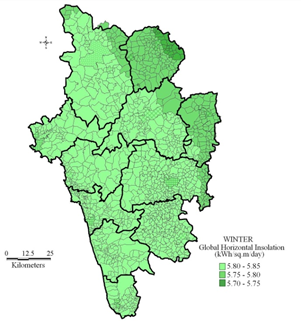
The monthly average GHI (Global Horizontal Irradiance) datasets from NASA and NREL were compared and validated with surface data based model. Figure 5 illustrates the monthly variability of solar radiation. The values indicate that adequate solar energy is available in the region. Higher resolution NREL GHI data were used to study the solar energy potential in Uttara Kannada. Solar maps generated for monsoon, winter and summer seasons, show seasonal availability and regional variability of GHI (Figure 6). The seasonal average GHI is highest in summer (6.65 – 6.95 kWh/m2/day), moderate in winter (5.70 – 5.85 kWh/m2/day) and lowest in monsoon (4.50 – 5.20 kWh/m2/day). Annual average GHI values were considered for assessing the technical potential of solar energy in Uttara Kannada.
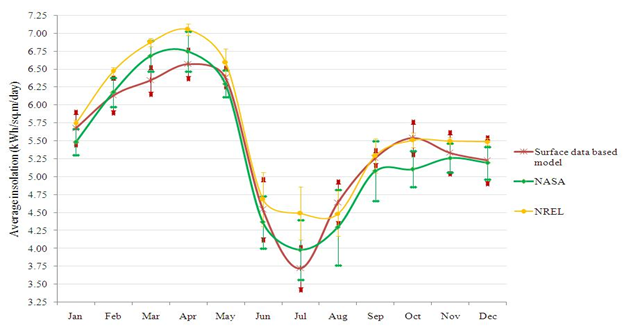 |
Figure 5: Comparison of different available solar data for Uttara Kannada |
 |
 |
 |
|
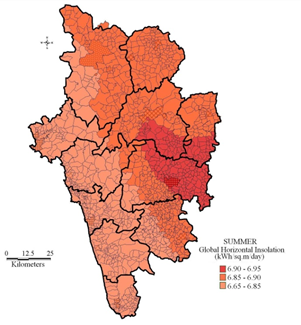
Figure 6: Seasonal variations of solar radiation in Uttara Kannada |
|
Figure 6 illustrates the seasonal variations of solar insolation in Uttara Kannada. Solar insolation
ranges from 4.5 to 6.95 kWh/m2/day in the districts throughout the year. During Monsoon season, district gets the
insolation ranges from 4.5 to 5.2 kWh/m2/day. Coastal and the eastern part of the central (moist deciduous) region
receives insolation of 4.8-5 kWh/m2/day. The central region (Evergreen) gets the lowest insolation ranges from 4.5
to 4.8 kWh/m2/day during monsoon. Eastern most part (dry deciduous) receives higher insolation of
4.89-5.2 kWh/m2/day.
In winter, insolation in the district ranges from 5.70 to 5.85 kWh/m2/day. Most of the parts in the district
receive insolation of 5.80-5.85 kWh/m2/day. Eastern region of the district (dry deciduous) gets insolation ranges from
5.75 to 5.80 kWh/m2/day. Some parts in this region receive insolation of 5.70-5.75 kWh/m2/day also.
Uttara Kannada gets higher insolation ranges from 6.65 to 6.95 kWh/m2/day in summer. Western part of the district
receives insolation of 6.65-6.85 kWh/m2/day. Most of the eastern part (central) gets insolation of 6.85-6.90
KWh/m2/day. In summer, some parts of the district get higher insolation of 6.90-6.95 kWh/m2/day.
Uttara Kannada has a good solar potential and can meet the energy demand in the domestic sector. Energy harvesting through
PV based solar system mounted on rooftops of individual houses would help in meeting the respective house’s energy
demand while bringing down the dependency on the State’s grid.
5.2 Land use Dynamics in Uttara Kannada
Figure 7 shows the land use details of a sampled village in Uttara Kannada. Classification of all sampled villages provided built-up and waste land areas. Based on the rooftop areas already calculated, rooftop to built-up ratio ![]() was derived for sampled villages and averaged over each agro-climatic zones respectively (Table 1).
was derived for sampled villages and averaged over each agro-climatic zones respectively (Table 1).
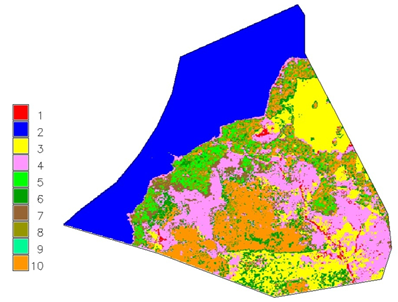
Figure 7: Land use in Aghanashini village of Kumta taluk, Uttara Kannada
Table 1: Average values of R/H and R/B ratios for different agro-climatic zones
Agro-climatic zone |
R/H |
R/B |
Coastal |
72 |
0.4 |
Dry deciduous |
141 |
0.5 |
Evergreen |
139 |
1.6 |
Moist deciduous |
82 |
0.5 |
Based on methods 1 and 2 (data and methods section, equations 1 and 2), the averaged R/H and R/B values were used to derive total rooftop areas in all regions and represented in Figures 8 and 9 respectively. It is observed that Method 1 provides a lower estimate of region-wise rooftop area compared to Method 2.
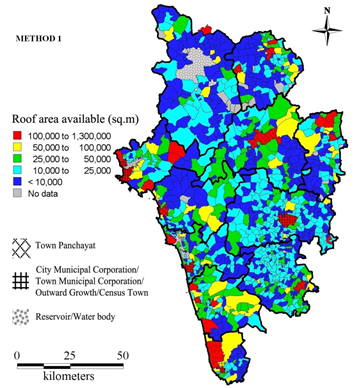
Figure 8: Region wise rooftop area available based on Method 1
From Figure 8 (Method 1: Extrapolation) it is seen that in most of the villages, total roof area available is less than 10,000 m2 or it is about 10,000 to 25,000 m2. There are very few villages where the total roof area is more than 50,000 m2. By the knowledge of total number of households in the particular village available rooftop area of each house can be determined.
Figure 9 (Method 2: land use) gives the total roof top area available in the villages of Uttara Kannada. It shows that total rooftop area available is more than 1,00,000 m2 in most of the villages. There is significant number of villages where the total roof area of the village is less than 10,000 m2. In some of the villages total roof area available ranges between 50,000 to 1,00,000 m2. Method 2 is based on the signature values of the land use (LU) over estimate the total roof area due to the approximation and lower pixel resolution. However both the results are comparable in the present case and the error is less.
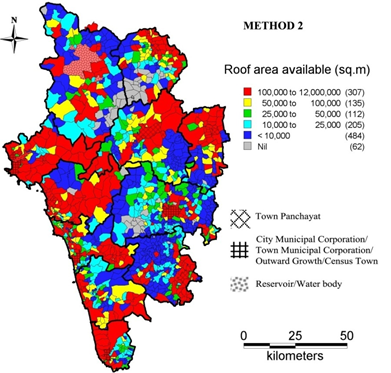
Figure 9: Region wise rooftop area available based on Method 2
5.3 Domestic electricity consumption
Table 2 summarises taluk-wise monthly average domestic electricity consumption based on the data compiled
from the government agencies and from sampled households. Average monthly energy consumption of electricity for domestic
purposes is about 34±8 kWh per month per household and irrigation requirement is about 3218±2412 kWh/hectare/year.
Monthly domestic electricity consumption ranges from 23 (for Haliyal) to 44 (Honnavar) kWh. These values were used for
calculating the region wise electricity demand for domestic and irrigation. Coastal taluks (Ankola, Kumta, Karwar, Bhatkal
and Honnavar) have higher household electricity consumption. Siddapur and Sirsi taluks with vast extent of horticulture
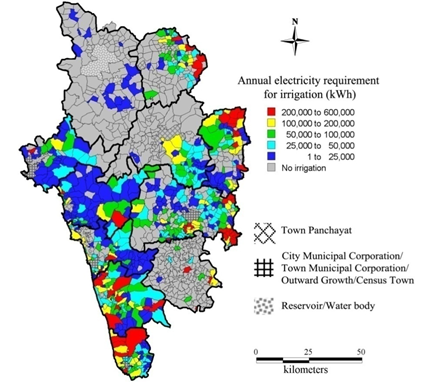
crops lead in the per hectare consumption of electricity for irrigation. Figure 10 gives the monthly average
household electricity consumption and Figure 11 shows the annual average electricity consumption for pump
irrigation. A large part of Uttara Kannada except the coast is rainfed and hence do not rely on irrigation for agriculture.
The electricity consumption ranges from 1,000 - 5,000 kWh/month. There are about 80 villages, which have the domestic
consumption of 10,000 to 1,00,000 KWh of electricity in a month.
Table 2: Domestic electricity consumption
Taluk |
Household consumption (kWh/month) |
Agricultural consumption (kWh/ha/year) |
Ankola |
34 |
2900 |
Kumta |
42 |
3200 |
Karwar |
40 |
3100 |
Bhatkal |
40 |
3100 |
Honnavar |
44 |
1800 |
Haliyal |
23 |
1800 |
Mundgod |
37 |
2100 |
Siddapur |
26 |
7700 |
Sirsi |
34 |
7900 |
Yellapur |
25 |
900 |
Supa |
25 |
900 |
max |
44 |
7900 |
min |
23 |
900 |
average |
34 |
3218 |
std. |
8 |
2412 |
Figure 10: Domestic household electricity consumption
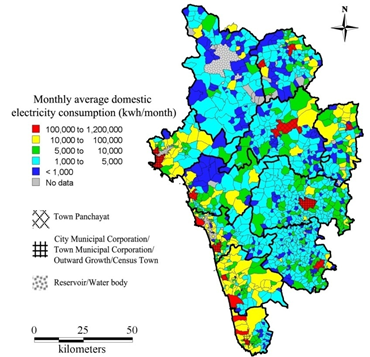
Figure 11: Electricity requirement for pump irrigation
5.4 Scope for rooftop PV systems to meet domestic electricity demand
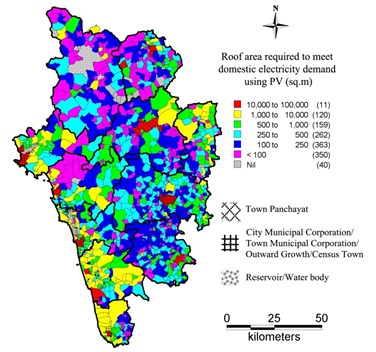
The monthly average electric energy consumption per household is about 50 to 100 kWh in Uttara Kannada. This electricity demand can be met through solar rooftop PV system, which ensures continuous supply of electricity compared to the current system of depending on grid with uncertainties. The rooftop area required to generate the electric energy using PV which will meet the domestic electricity demand in respective villages is given in Figure 12. Majority of the villages require rooftop area less than 250 m2 to meet the electric energy demand using solar PV system. Around 26% (350) of the villages in the district require rooftop area less than 100 m2 and about 27% (363) places need rooftop area ranges from 100 to 250 m2. Hence more than 54% of the villages require rooftop area less than 250 m2 to meet the current domestic electricity demand. In very few places total rooftop area required is 10,000 to 1,00,000 m2 which are normally the city or town municipal corporations or census towns.
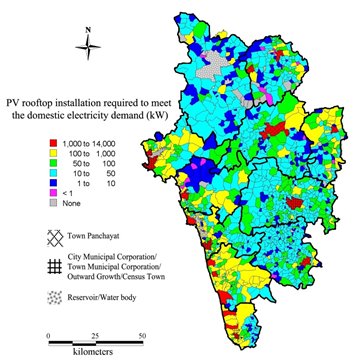
Rooftop area requirement for PV modules was computed and mapped (Figure 12) with the knowledge of region-wise household electricity demand considering the solar PV panels of efficiency (η) 14% with modules of quality factor (Q) 0.5 as discussed in Methods section. In most of the regions, except for towns, less than 10,000 m2 of rooftop area was sufficient to meet the village’s household electricity demand. Figure 13 shows the PV capacity required to meet their demand. Most of the villages required installations within 1,000 kW while towns demanded larger installations upto 14,000 kW per region. Figures 14 and 15 provide information on the share of available rooftop area required to meet household electricity demand, based on methods 1 and 2 respectively.
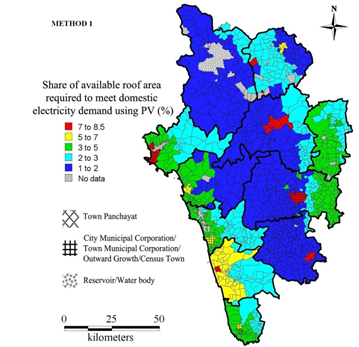
Figure 14 (Method 1: Extrapolation) gives the share of (% of) available roof area required to meet the domestic electricity demand of household using rooftop PV system. In almost all the villages in the central part (Evergreen region) of the districts, only 1-2% of the available roof area is required to meet the electric energy demand of the household using rooftop PV system. In few villages in coastal region (HonnavarTaluk), 5-7% of the available rooftop area is needed to meet the present household electricity demand. In all other villages, roof area required is less than 5% (or 2-5%) of the total area to meet the demand using solar rooftop PV system. Hence study reveals that, a small part (less than 7%) of the roof area is sufficient to meet the electrical energy demand of the household using rooftop PV system in the district.
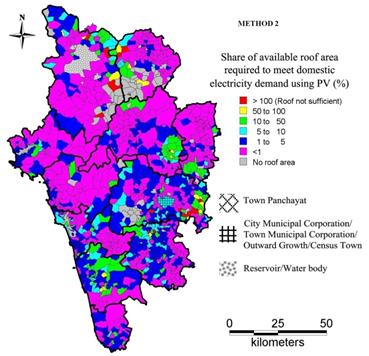
As mentioned before, availability of rooftop area according to method 1 was a lower estimation. Based on this method, less than 7% of the available rooftop area in any region can meet its household electricity requirement using PV. As expected, due to the higher estimation of available rooftop area by method 2, less than 5% can meet this demand using PV in most of the regions. In certain regions where the built-up areas were not classified (due to dense tree canopy, covering the rooftops) and hence rooftop areas were not available according to method 2, it is shown as “roof not sufficient” to meet the demand (Figure 15).
Figure 15 (Method 2: LULC-Land Use and Land Cover) gives the percentage of roof area required to meet the domestic electricity demand using PV. It also shows that in most of the villages, the roof area required to meet the electricity demand of the household using rooftop PV is less than 1%. In some places area required ranges from 1-5 and in few places it is 50-100%. But overall the roof area required is less than 5% to meet the domestic demand of the household using rooftop PV system.
Figure 12: Region-wise rooftop area required to meet household electricity demand using PV (η=14%, Quality factor=0.5)
Figure 13: Region-wise PV rooftop installation required to meet the household electricity demand
Figure 14: Share of rooftop area required to meet household electricity demand
Figure 15: Share of rooftop area required to meethousehold electricity demand based on method 2
5.5 Meeting the electricity demand of irrigation using Solar PV in waste/open land
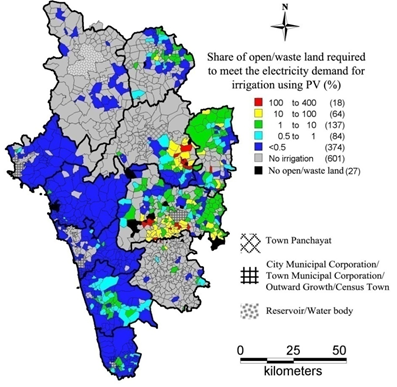
Village-wise land uses were estimated using IRS (Indian remote Sensing) P6 data of 5.6 m spatial resolution. This analysis provided the details of the extent of wasteland in each village of the district. The proportion of wasteland required to meet electricity demand for irrigation was calculated as discussed earlier (Method section). Figure 16 shows the waste land required to meet the annual electrical energy demand for irrigation considering SPV Standalone panels of efficiency (η) 14% and quality factor (Q) 0.5. Most part of the district is practices rain-fed cultivation without much irrigation. Villages in the coastal zone can meet the irrigation demand with less than 0.5% of the available waste land area. In most of the villages’ total electrical energy required for irrigation ranges from 1 to 25,000 kWh per annum. In some places energy requirement is more than 25,000 kWh and less than 50,000 kWh annually. There are few places where the total electrical energy required for irrigation is more than 1,00,000 kWh per annum. The land requirement analysis shows that the electricity demand for irrigation purpose can be met using less than 0.5% of wasteland area in the district. In few places waste/open land area required is more than 0.5% of the totalwaste/open land area available. However, in Uttara Kannada waste/open land area required will be less than 10% to meet the electricity demand of irrigation by installing PV modules.
Figure 16: Share of waste land area required to meet electricity demand for irrigation using PV