|
Carbon footprint of municipal wastewater
Carbon Footprint refers to the amount of greenhouse gases (GHG) produced due to human activities, measured in units of carbon dioxide. ‘Carbon footprint’ assessment has gained importance in recent years and has been used as a benchmark for quantitation of greenhouse gas emissions in context of climate dynamics aided by anthropogenic, unregulated resource usage and consumption practices (Wiedmann and Minx 2007; East 2008; Finkbeiner 2009; Peters 2010). Carbon footprint (C footprint) is a sub set of “Ecological footprint” (Wackernagel 1996), which implies the land resources needed to immobilise/sequester the total GHG as CO2 generated by anthropogenic activity. C footprint estimations have become more prevalent with towering GHG emissions leading to global warming with rapid changes in the climate, (East, 2008). C footprint is a measure of the exclusive total amount of CO2 emissions that is directly and indirectly released by an activity or is accumulated over the life stages of a product (Wiedmann and Minx, 2007). This is comparable to life cycle impact assessment and is an indicator of global warming potential and global sustainability. Although there has been great deal of environmental deterioration, but awareness on quantifying the magnitude of C foot print are scarce. However the measurement of C footprint requires clarity on (i) inclusion of indirect emissions required for upstream production process, (ii) direct and on site emission of the production process, (iii) accounting for all stages of the life cycle of a process in terms of services and goods, (iv) systems boundary and quantification approaches.
The science of C footprint though very often talked about (Kleiner 2007) and variant terminologies to C footprint are climate footprint, GHG footprint, embodied carbon, carbon flows (Courchene and Allan 2008; Edgar and Peters 2009). The term carbon footprint comprise of two words the former carbon which is the life line of all living organisms and constitutes the most dominant bio polymer in every single living organism. On an average living organisms comprise of ~ 40 to 50 % of C on a dry weight basis. The C forms the most abundant bio polymers globally and comprises the bulk of any living organic matter. For every organism the food mostly comprise of C in some form. Ex. The food source of human beings comes from plants and animals. The plants capture/immobilise CO2 form the atmosphere by using solar energy to combine it with water to create sugars from which they build their cytoskeleton (photosynthesis).
Term ‘footprint’ explains the measurement or the impression of C and represented as global hectares (Browne et al. 2009). However the C footprint can have a variety of quantifying scales as to gauze the impact or the stress/quantity of C emission (tonnes)/quantity normalised over CO2 as CO2 equivalents (tonnes of CO2-eq.) an in case of GHG potential/area for land measurements. For wastewater sector it is attributed to the sum of all emissions associated with the collection, treatment, and ultimate disposal of wastewater. Significant sources of these emissions include the indirect emissions from the purchase of electricity, direct emissions resulting from the treatment process, fugitive emissions from the waste itself, and transportation related emissions.
1.1 Importance and Need for assessment
The last two centuries have witnessed a soaring increase in atmospheric concentrations of GHGs. Human activities such as industry, agriculture, deforestation, waste disposal and especially unprecedented use of fossil fuel have been producing increasing amounts of GHGs. For example, the concentrations of CO2 increased from approximately 280 part per million by volume (ppmv) in pre-industrial age to 372 ppmv in 2001 and has continued to increase at about 0.5% per year (IPCC, 2007) whereas current CH4 atmospheric concentration is going up at a rate 0.02 ppmv per year. Similarly there has been a substantial increase in sources of N2O by anthropogenic activities of about 40–50% over pre-industrial levels. This rapid increase in GHG concentrations in the atmosphere, due to human induced activities, the entire humanity is under the threat of global warming (rise in global temperature) and associated climate change and it’s far reaching consequences.
The magnitude of impact of GHG differs and is based on the radiative forcing together with the mean time span of the existence of GHG gas in the atmosphere, which is jointly expressed as the global warming potential and is mostly expressed as carbon dioxide equivalent (CO2-e). The most significant contributors to global warming are the six Kyoto gases and to a lesser extent the chloro-fluoro carbons (highlighted during the Montreal protocol; IPCC, 2006; 2007). The largest share of the GHG is contributed by CO2 (~60 %) followed by methane and nitrous oxide and the largest GHG producing sector being the energy supply (~26%) (IPCC, 2007). The global anthropogenic GHG emissions and the GHG emissions by sector (IPCC, 2007) have been elucidated in Fig. 1.
Anthropogenic GHG emissions grew at an average annual rate of 2.2% over 2000-2010, compared with a growth rate of 1.3% per year over the period of 1970-2000. CO2 emissions from fossil fuels and industrial processes contributed 65% of global GHG emissions in 2010. The increase in anthropogenic GHG emissions comes from energy supply (47%), industry (30%), transport (11%), and buildings (3%) sectors. Globally, population and economic growth continue to be the most important drivers of increases in CO2 emissions from fossil fuel combustion (IPCC, 2014: https://www.dieselnet.com/news/2014/04ipcc.php).
The greenhouse effect of these gases is estimated by their GWP that depends on radiative forcing and the timeframe of consideration (usually taken as 100 years). The GWP factors for a 100 year horizon for a) CO2 is 1 (base/reference), b) CH4 is 21 and c) N2O is 298 (IPCC Fourth Assessment Report, 2007). In other words over a time period of 100 years one tonne of CH4 will have a warming effect equivalent to 25 tonnes of CO2 (IPCC 2006).
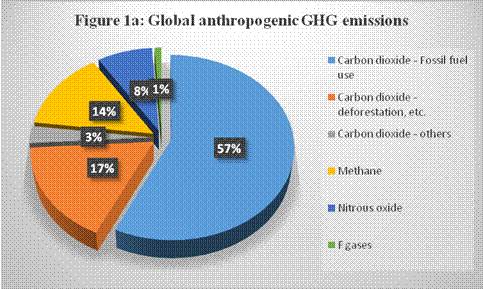 Figure 1 a) Global anthropogenic GHG emissions Figure 1 a) Global anthropogenic GHG emissions
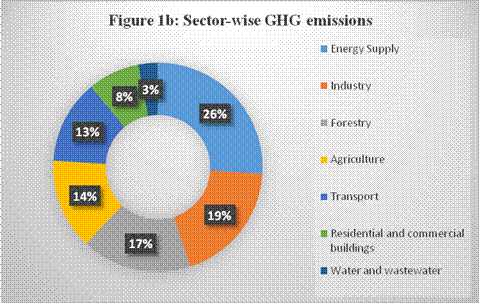
Figure 1 b) GHG emissions by sector (source: IPCC, 2007)
Increase in the emission levels has led to 0.74° C rises in the mean global temperature (IPCC 2007), that can lead to global warming resulting in glaciers melting followed increase in Sea levels rise and submersion of coastal and low lying areas (Kerr 2007). The imbalance in nature is evident through recent episodes of cyclones, tsunamis and extreme weather conditions. The C footprint accounted as a quantitative expression of the GHG emissions (Carbon Trust 2007b) from various activities aids in devising tools/methods for emission management and figuring out appropriate mitigation measures. Today it becomes imperative for a detailed GHG inventory on a global sale and specific methods have to be devised for C abatement for reduced C footprint and GHG emission and have to be evaluated. The C foot printing exercise will enable quantification of emissions, tracing important sources of emissions for which appropriate management and emission reduction techniques can be developed along with increasing the efficiency of the process. Stringent legislative measures should be followed for accounting C footprint and identification of C footprint reduction methods for regions and organisations (Courchene and Allan 2008).
1.2 Definition of carbon footprint: A brief review
The term carbon footprint have been used to account the GHG emissions that a particular product or service generates during its life time, and is mainly expressed as CO2 equivalents (CO2e) that comprises of emissions of CO2, CH4 and N2O. The C footprint can be a subset of LCA, emphasising only the global warming potential part (Weidema et al. 2008; Finkbeiner 2009). However the C foot printing calculations and representation has been inconsistent and divergent and the utility and potential of such methods/strategies have been questioned. Most of the recent literatures studied recently have dealt with either sectoral C footprint assessments or region specific C footprint analysis. The C foot print terminology has been also widely observed and reported as a measure of GHG expressed as CO2 equivalents.
According to EPA (2010), carbon footprint is the total amount of greenhouse gases that are emitted into the atmosphere each year by a person, family, building, organization, or company. This includes greenhouse gas emissions from fuel that an individual burns directly, such as by heating a home or riding in a car. It also includes greenhouse gases that come from producing the goods or services that the individual uses, including emissions from power plants that make electricity, factories that make products and landfills where trash are disposed. Grub and Allis (2007) defines it as a measure of the amount of carbon dioxide emitted through the combustion of fossil fuels. In the case of a business organization, it is the amount of CO2 emitted either directly or indirectly as a result of its everyday operations. It also reflect the fossil energy used in the manufacture of a product or commodity reaching market. Considering the impact human activities on the environment in terms of the amount of greenhouse gases produced, it is measured in tonnes of carbon dioxide (ETAP, 2007). C foot print reflects the total emission of greenhouse gases (GHG) in carbon equivalents from a product across its life cycle from the production of raw material used in its manufacture, to disposal of the finished product (excluding in-use emissions). It is also a technique for identifying and measuring the individual greenhouse gas emissions from each activity within a supply chain process step and the framework for attributing these to each output product. According to the global Footprint network, 2007 “the demand on bio-capacity required to sequester (through photosynthesis) carbon dioxide (CO2) emissions from fossil fuel combustion." (GFN 2007; see also text). The parliamentary office of Science and Technology (POST 2006) reports “A ‘carbon footprint’ is the total amount of CO2 and other greenhouse gases, emitted over the full life cycle of a process or product. It is expressed as grams of CO2 equivalent per kilowatt hour of generation (gCO2eq/kWh), which accounts for the different global warming effects of other greenhouse gases."
1.3 Issues related to quantification methodological issues
i. Green house gas records and measurements
a. GHGs: The choice of the GHG’s depend upon the nature, requirement and the guidelines of the sector/activities. For example, in the case of wastewater, most important gas that’s emitted is CO2 as an outcome of bacterial metabolism and along with it are the emissions of CH4, NO2. In the case of any industry e.g. coal based power plant CO2 becomes the most important GHG compared to CH4 and other gases are in traces. Many earlier studies account only CO2 emissions for measurements of C foot print (Wiedmann and Minx 2007; Craeynest and Streatfeild 2008) and major six GHG emissions (Bokowski et al. 2007; Energetics 2007; Garg and Dornfeld 2008; Matthews et al. 2008a,b; Peters 2010)
b. Systems boundary: The system boundary delineates the targeted region and considers those activities with in the boundary. This depends on the organisational, and operational boundaries. The organisational boundary can be ascribed as the boundary of the organisation on the economic and business grounds and its associated activities under the study. The operational boundary involves the direct and indirect emissions (WRI/WBCSD 2004; Carbon Trust 2007b; BSI 2008)
The operational boundary considers (i) direct emissions (on-site) and (ii) Indirect emission sources (embodied emissions – consumption of purchased power). All indirect emissions – difficult to quantify, for example, in the case of wastewater direct emissions sources include all direct GHG emissions, except the direct CO2 biogenic emissions (fixed biologically during treatment). Indirect emissions are ascribed to the consumption of purchased energy i.e. acquired electricity, heating, cooling etc. such emissions are an outcome of activities within the organisational boundary but are emitted from sources controlled or owned by some other organisation, as central electricity supply etc. This constitutes one of the largest sources of emissions for wastewater pumping and treatment facilities due to high energy intensive pumping process (Fig. 2). Thus wastewater treatment units have to ensure energy efficient initiatives to reduce indirect GHG emissions.
Other indirect emission sources are:
- Supply-chain GHG emissions as upstream/downstream transport of chemicals, materials, and fuels and upstream production.
- Bio-solids reuse, including land application or other methods that are outside the organizational boundary;
- Landfilling of bio-solids;
- Emissions from services contracted with outside vendors as bio-solids hauling fuel emissions or contracted wastewater treatment by adjacent municipalities
- Emissions from employee commuting and business travel.
All these are difficult to quantify and requires additional guidelines for facilitating inventories. Whatever C footprint studies conducted till date have emphasised and accounted for the quantity of GHG removal but gross sequestration of GHG has been not addressed (Peters 2010). Therefore C sequestration becomes very vital in all such calculations and is to be incorporated in C footprint measurements.
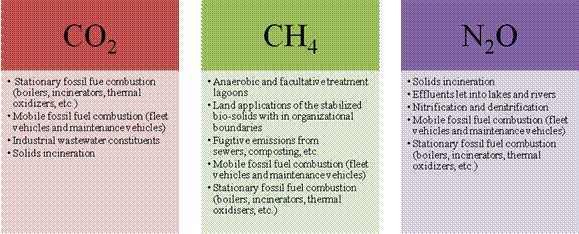 Figure 2: Method of accounting indirect emissions Figure 2: Method of accounting indirect emissions
c. Compilation of GHG emission data: Emissions have been quantified either directly through on-site real-time measurements or through estimations based on the emission factors and various empirical models. The emission factors or the model based data generation are the most used means for acquiring data. These emission are calculated from specific emission factors using the data on fuel consumption, efficiency of the process, energy and other activities resulting in emissions (CO2 in particular). Emission factors for various sectors and industrial processes and land uses are available in PAS-2050, IPCC, 2006 (IPCC 2007). Country specific emission factors developed in many countries as national laboratories under UNFCC, US EPA etc. (IPCC 2007; WRI/WBCSD 2004). However the verification of these is highly required at varied organisational, operational and geographical contexts. The region specific emission factors and models have been precisely developed (WRI/WBCSD 2004; IPCC 2006). In cases of fugitive emissions, the direct measurements are done through specialised GHG capture techniques such as optical, biochemical, IR sensors and quantitative measurements through IR spectroscopy and gas chromatography (USCCTP 2005; Berg et al. 2006). Many other advanced techniques include flux towers (Velasco et al. 2005); cavity ring-down spectrometers for measurements in air (Kelly et al. 2009). Apart from the primary data collection techniques, a wide variety of secondary data sources are accessible at the global scale in recent times. On a much larger scale a CO2 emission database from different countries are now obtainable with various national level GHG inventories with adequate data on fuel and energy usage, IEA, UNDP (Brown et al., 2009). These direct methods are most precise and accurate but the cost incurred for the data acquisition through experiments and analysis are quite expensive (Ramachandra et al., 2013). In such cases the secondary databases are economic and yield acceptable results (WRI/WBCSD 2004). As an example, the GHG calculation tool provides guidelines for setting and customising the tools for calculating the GHG flux specific to sector/organisation (USCCTP 2005; WRI/WBCSD 2006). Space borne sensors (optical, microwave) have been used for data acquisition and are coupled with GHG inventories that would result in a vivid and complete coverage for acquisition of data (USCCTP 2005, Ramachandra et al., 2013; Chambers et al., 2007). NASA and US department of Energy etc are engaged in satellite based data acquisition and inventorying GHG and associated information. The flux measurements are taken with respect to a base year (starting year) as 1990 in regards to the obligation for reduction of CO2-eq. emissions level under UNFCCC. The base year is of prime importance for analysis of variations/magnitude of change in the extent and quantity of GHG gases and often needs to have reproducibility and reliability (Carbon Trust 2007b; Brewer 2008a, b)
d. Calculation of C footprint: This is done for all GHG gas quantities/flux as CO2-e considering emission factors (WRI/WBCSD 2004; BSI 2008; Wiedmann and Minx 2007). There are two approaches followed for quantification of C foot print a) bottom up - based on process analysis and b) top-down considering environment input-output analysis. The bottom-up approach inherits the understanding of environmental impacts of individual product/region/category from source to sink. This approach has disadvantage for identification of appropriate system boundary and is based only on-site and most first order impacts (Lenzen 2001). This approach becomes far fetching with increase in the systems area such as sectors/governments etc. In contrast, the top-down or the environmental input-output analysis (Wiedmann et al. 2006) is most commonly applied in economics and provides majority of the economic activities at sectoral scales. This approach can result in a robust economic set up as the boundary. Input Output approach is largely carried out for sectoral C foot-printing assessment and might not be suitable for small operations/processes. Hybrid approach integrates process analysis with the environmental input-output approach (Suh et al. 2004, Heijungs and Suh 2006).
e. Carbon footprints assessment of a product: Carbon footprints assessment of a product is done either through bottom-up, based on Process Analysis (PA) or top-down, based on Environmental Input-Output (EIO) analysis considering the full life cycle impacts (Life Cycle Analysis - LCA).
- Bottom-up method involves a process analysis (PA) considering the environmental impacts of individual products from cradle to grave. However, this will have a problem of a system boundary - only on-site, emphasises the need for identification of appropriate system boundaries. PA-based LCAs run into difficulties for larger entities such as government, households or particular industrial sectors.
- Top down approach involving environmental input-output (EIO) analysis provides a picture of all economic activities at the sector level. This with consistent environmental account data aid in a comprehensive and robust way taking into account all impacts of the whole economic system as boundary. Application of this approach to assess micro systems such as products or processes is limited, as it assumes homogeneity of prices, outputs and their carbon emissions at the sector level. Advantage of input-output based approaches is a much smaller requirement of time and manpower once the model is in place.
The best option for a comprehensive and robust analysis is to combine PA and input-output methods. Such an approach allows to preserve the detail and accuracy of bottom-up approaches in lower order stages, while higher-order requirements are covered by the input-output part of the model.
f. Carbon Footprint Standards for Products: Carbon Footprint (CF) of a product involves measuring, managing and communicating greenhouse gas (GHG) emissions related to the product’s goods and services. This is based on a life cycle assessment (LCA) from global warming perspective. This helps in enhancing market reputation, engaging with suppliers, clients and other stakeholders, and more importantly this constitutes a first step towards a more comprehensive environmental assessment. Three commonly used carbon footprint standards applicable to the product are: PAS 2050, GHG Protocol and ISO 14067 (Kulkarni and Ramachandra, 2009; http://www.pre-sustainability.com/product-carbon-footprint-standards-which-standard-to-choose).
- PAS 2050 has been developed by the British Standards (BSI) and came into effect in October 2008. PAS 2050 has already been applied by many companies worldwide.
- The GHG Protocol product standard developed by the WRI/WBCSD and tested by 60 companies in a road test in 2010. The GHG Protocol product standard was launched in October 2011.
- ISO DS 14067 specifies principles, requirements and guidelines for the quantification and communication of the carbon footprint of a product (CFP), based on International Standards on life cycle assessment (ISO 14040 and ISO 14044) for quantification and on environmental labels and declarations (ISO 14020, ISO 14024 and ISO 14025)
All three standards developed on existing life cycle assessment methods established through ISO 14040 and ISO 14044provide requirements and guidelines on the decisions to be made when conducting a carbon footprint study. Decisions involve LCA issues, like goal and scope definition, data collection strategies, and reporting. Moreover, these standards provide requirements on specific issues relevant for carbon footprints, including land-use change, carbon uptake, biogenic carbon emissions, soil carbon change, and green electricity.
1.4 GHG emissions from wastewater sector:
GHGs produced during wastewater treatment are CO2, CH4 and N2O. Globally wastewater is the 5th largest emitter of CH4 and 6th largest emitter of N2O that contributes ~10 % of the total CH4 emissions and 3 % of N2O emissions respectively. CH4 and N2O emissions are expected to grow by ~20 % and 13 % by 2020 (US EPA, 2006). GHG like CO2 are emitted due to a) treatment process and b) electricity consumption (Ramachandra et al., 2014a). Next section, discusses GHG due to wastewater treatment based on field experiments. Bangalore city generates ~1200 million litres per day (MLD) of domestic wastewater that gets either partially treated or untreated and joins receiving surface waters at various locations in the city. This has contributed towards carbon footprint.
The GHG emissions of the select treatment plants were estimated based on conventional treatment technologies and the energy units consumed during the operation of the treatment plants. The direct GHG emissions were accounted for CO2 generated through organic matter degradation (aerated tanks-aerobic process); CH4 generated from the clarifiers and also from the basins; N2O emissions from the effluent discharge into surface water bodies and the diesel generator used in the treatment units. Indirect emissions were calculated from offsite generation of electric power that is consumed at wastewater treatment plant, which is explained in the section 2.
Wastewaters generated from domestic households are a source of nutrients to growth and development of algae and consequent lipid extraction. The CO2 sequestration in algae is accomplished by a) direct sequestration, which comprises the capture of CO2 from the wastewaters before its emission to atmosphere, and its subsequent storage and ii) indirect sequestration, based on the capture of CO2 that is already in the atmosphere, through photosynthesis. C present in wastewater can be either inorganic C (carbonic acid/bicarbonates/carbonates) or organic C (dissolved organic acids etc.). Many wastewater algae are capable of consuming both C forms and are called mixotrophic algae and are extremely beneficial in rapid C fixation and reduction of wastewater C footprint. Often bulk of the wastewater C fixed in the algal biomass is stored in the form of lipids (neutral) that can be potentially used as feedstock for biofuel as biodiesel and gasoline. Sequestration aspect of microalgae is discussed in Section 3.
Increased and unprecedented population growth has resulted in enormous stress on potable water from a daily consumption point of view and also in regards to increased wastewater generated by the city. Land use analyses show 584% growth in built-up area during the last four decades with the decline of vegetation by 66% and water bodies by 74%. Apart from these, rapid urbanisation in recent times has led to the mammoth wastewater generation. Untreated or partially treated wastewaters are fed to surface water leading to GHG emissions. The sustained inflow of untreated or partially treated sewage to wetlands leads to the enrichment of nutrients such as carbon (C), nitrogen (N), etc. Installation of conventional treatment plants has helped in the removal of dissolved and suspended biological matter and the effluents are still nutrient rich and needs further treatment and stabilization (Ramachandra et al., 2014a,b).
Section 4 presents the possibility of mitigating GHG emissions from wastewater sector through integrated wetlands ecosystem. Integration with wetlands (consisting of typhabeds and algal pond) would help in the complete removal of nutrients in the cost effective way. However, this requires regular maintenance of harvesting macrophytes and algae (from algal ponds). Harvested algae would have energy value, which could be used for biofuel production. The joint activity of algae and macrophytes in the wetland systems helps in the removal 77 % COD, ~90 % BOD, ~33 % NO3-N and ~75 % PO43—P. Implementation of intgrated wetlands system help in treating the water and more importantly in the mitigation of GHG emissions from wastewater sector.
Citation : Ramachandra T V and Durga Madhab Mahapatra, 2015. The Science of Carbon footprint assessment, In The Carbon Footprint Handbook (ed: S S Kannan), CRC Press, New York, pp: 3-45.
|