|
Carbon sequestration and Biofuel prospects
Wastewater treatment is still a challenge in India due to the enormous load (1,70,000 MLD). At the same time escalating fuel prices and non-availability of indigenous oil reserves has necessitated viable oil options for automotive transportation, energy generation, etc. The resident algal species like euglenoides occurring naturally in the wastewater lagoons due to their heterotrophic nature are ideal for wastewater treatment (and mitigation of carbon emissions) as well as lipid production.
The CO2 sequestration in algae is accomplished as a) direct sequestration, which comprises the capture of CO2 from the wastewaters before its emission to atmosphere, and its subsequent storage and ii) indirect sequestration, based on the capture of CO2 that is already in the atmosphere, through photosynthesis. C present in wastewater can be either inorganic C (carbonic acid/bicarbonates/carbonates) or organic C (dissolved organic acids etc.). Many wastewater algae are capable of consuming both C forms and are called mixotrophic algae and are extremely beneficial in rapid C fixation and reduction of wastewater C footprint. Often bulk of the wastewater C fixed in the algal biomass is stored in the form of lipids (neutral) that can be potentially used as feedstocks for biofuel as biodiesel and gasoline.
Soaring global oil demands and perishing stock of finite oil reserves, has created enormous interest for a clean, green and alternative energy sources such as algal biofuels (Ramachandra et al. 2009; Ackom et al. 2010). Among the major organisms considered for oil, bacteria accumulate lipid up to 80% of dry wt. (Gouda et al. 2006), yeast up to 70% ( Li and Bai. 2007; Easterling et al. 2009; Hu et al. 2009), algae up to 50-75 % (Chisti 2001) and fungi up to 40% of dry wt. (Seraphim et al. 2006). Among these, algae are promising due to higher growth rates in natural conditions (sunlight and atmospheric CO2) with minimal feed requirements. Species such as euglenoides have higher lipid generation (Coleman et al. 1988) with continuous growth and typical mixotrophic mode of nutrition (Yamane et al. 2001). Microalgae contains high amount of lipids, including triglycerides (Borowitzka 2010) suitable for production of biodiesel. Microalagae species Botrycoccus brauini have a very high content of hydrocarbons similar to crude oil of oil deposits (Metzger and Largeau, 2005). These microalgae thrive well in tropical climates in any bio-systems like open ponds, eutrophic lakes, wastewater lagoons, algal ponds etc. Wastewaters generated from domestic households are a source of nutrients to growth and development of algae and consequent lipid extraction. Lagoons are also cost effective wastewater treatment options adopted in most part of the country paves the path for a sustained energy generation.
Neochloris oleoabundans (Li et al. 2008); Chlorella protothecoides (Han Xu et al. 2006) and Chlorella vulgaris (Liang et al. 2009; Widjaja et al. 2009) are some reported high lipids accumulating strains in controlled conditions. However, studies on the resident algal population/species in natural environments are scarce. In this context, investigations on euglenoid Lepocinclis ovum focussing on the growth environments, cell characteristics in relation to the lipid content, composition of lipid and quantum of lipid production has been done for the first time. Growth and consequent oil accumulation under natural conditions deviate significantly than that of photo bioreactors with the favourable experimental conditions. In the natural conditions the Lepocinclis ovum competes for dominance with other algal species and predators under hostile conditions. Algae under such stressed conditions appear to have higher lipid accumulation and prove to be a viable candidate for biofuel generation. Generation of large quantity of wastewater and subsequent treatment through lagoons (for economic reasons), provides an opportunity to harvest microalgae for biofuel generation without additional requirements of land, water or nutrients. However there are challenges related to mass cultivation and downstream processing in realising this vision.
Lipid generation at mass scale from the algae grown in wastewater requires understanding of algal species assemblages, enhancement of biomass accumulation of viable species, enumeration, quantification and lipid profiling. Algal growth has been monitored through the measurement of cell densities with direct cell count, optical density and estimation of chlorophyll, volatile solids, etc. Factors such as nutrient uptake, cell development, cell-division, increment in biomass, lipid accumulation helps to evaluate cellular responses to the local environment conditions. Cell composition, percentage fraction with substrate accumulation are best analysed through GC MS for lipid quantitation and composition analysis (Akotoa et al. 2005). Objectives of the study are to evaluate the scope of euglenoides - Lepocinclis ovum predominantly grown in wastewater lagoons for mass biofuel production. This involves:
- assessment of growth of euglenoides - Lepocinclis ovum collected from lagoons fed with municipal wastewater;
- investigation of lipid content and the composition of lipids; and
- potential of algae based biofuel in meeting the regional energy demand.
3.1 Materials and methods
3.1.1 Study Area
Mysore lies between 12°9’ and 11°6’ latitude and 77°7’ longitude in Karnataka with the elevation of 650 m above mean sea level with a population of 1.2 million (in 2001). The temperature ranging from 14 to 34°C and the monsoon showers starts from the end of May till October. The city is blessed with rivers like Cauvery for domestic water consumptions. A part of the city is dependent on groundwater for various purposes.
The wastewaters generated in Mysore city due to gravity finds its way into three valleys- northern region leading Kesere valley, the south-eastern to the Dalvai tank valley and south west to the Malalvadi lake valley. Northern drainage system leads to 30.0 MLD STP (Powered by aerators) at Kesare Village, Mysore. The south-western drainage flow connects to the Vidyaranyapuram STP (67.65 MLD) which uses Organic microbe-mix inoculum’s (OS-1&2) for treatment before entering Dalvai kere. Further south is the STP at Rayankere (60 MLD), H. D. Kote Road. The study area (Fig. 5) is essentially the catchment slope of the feeder to Dalvai lake. It lies between 12.273681° and 12.270031° latitude and 76.650737° and 76.655947° longitude at the foothills of Chamundi hills. The STP is also surrounded by numerous solid-waste dumps. The effluent of the STP flows through the Dalvai kere and then traverses about 20 km before reaching Kabini river. The flow is considered laminar, the residence time of wastewater in the facultative ponds is 11.8 days and in maturation ponds is 2.5 days. The lagoon at Vidyaranyapuram consists of facultative (2, each of 5.15 ha spatial extent and depth) and maturation ponds (2 of 2.5 ha each).
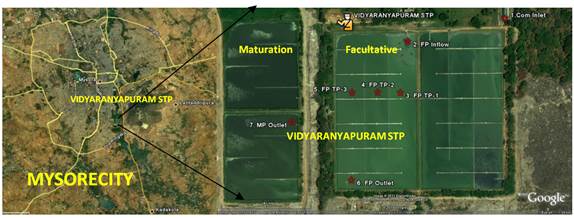
Fig. 5: Sampling site -Vidyaranyapuram Sewage Treatment Plant
3.1.2 Sampling - Algal screening, selection and densities: For the biomass growth studies the wastewater collected from the STP were filtered and were used in the growth experiments. Algal samples were collected from anaerobic regions and aerobic regions of the facultative ponds as well as various locations of the inflows, outflows and maturation ponds. The abundance of various species was calculated. The algal samples were identified using standard keys (Prescott 1964) based on their external appearance, colour, morphological features, size, habitat, orientation of chloroplast, cellular structure and pigments etc. The wastewater samples collected was concentrated by centrifuging 15 ml volume. Algae were enumerated using 3 replicates of 20 µl of the concentrated sample through microscopy observations. Samples collected from the field were weighed for total dry wt. Quantification for unit area/volume was done taking 10 l volume for microalgae.
3.1.3 Characterisation of the growth environment and water quality: Water samples (1l) were collected from the sampling locations between 9 and 12 a.m. Sampling was always from the sunny side of the banks/platform so as to avoid shaded areas. pH, water temperature, electrical conductivity, total dissolved solids (TDS), salinity, dissolved oxygen (DO), dissolved free carbon-dioxide (free CO2), and turbidity were measured on-site using the standard methods. In addition, visual clarity/transparency of the lake/STP wastewater was measured as with Secchi disk. Water samples collected were analysed for the various estimations of Carbon, Nitrogen and its various forms and Phosphorus according to standard methods (APHA 1998).
3.1.4 Harvesting of Algal Biomass: Algal biomass was collected from the wastewater ponds with buckets of 2.5 litre capacity. Higher settling rate of L. ovum helped in concentrating the algae. These algae transferred to the laboratory were carefully washed. After microscopic analysis the samples were washed thrice thoroughly with deionised water and were concentrated by centrifuging at 5000 rpm for 20 mins. The pellet was scrapped carefully using spatula and was exposed to drying at room temperature. Samples were preserved through refrigeration till further use.
3.1.5 Monitoring the Growth: Conducive growth environments were created for the cultivation with adequate sunlight and provisions for gaseous exchanges to stimulate the growth of the algae Lepocinclis ovum collected and isolated from the wastewater ponds. The isolated algae L. ovum were grown in with the modified Chu’s media with the composition: Ca(NO3)2(20g/l), K2HPO4(2.5g/l), MgSO4.7H2O(12.5g/l), Na2CO3(12.5g/l), Na2SiO3(10g/l), FeCl3(0.4g/l), and trace metal solution H3BO3 (2.48g/l), MnSO4.H2O(1.47g/l), ZnSO4.7H2O (0.23g/l), CuSO4.5H2O(0.1g/l), (NH4)6Mo7O24.4H2O (0.07g/l), Co(NO3)2.6H2O (0.14g/l) and finally the vitamin mix Thiamine. HCl (Vit.B1) (50mg/l), Biotin (Vit. H) (0.5g/l) and Cyanocobalamin (Vit.B12) (0.5g/l). A control was also prepared without any inoculations.
The wastewater collected from the influent of the lagoon was centrifuged, filtered and sterilised for the growth studies. The initial pH was adjusted to 7.3 and the media was sterilised for 30 min before the growth experiments. The experiment was performed in conical flasks each containing 100 ml of the wastewater media. The algal growth i.e. biomass growth, was measured every 24 h with a spectrophotometer (Hach, DR-2800) at 658 nm, using deionised water as the blank control. Probable relationship of biomass with the optical density is given by:
Dry wt. (g/l) = 0.9712 X OD658. (r = 0.9973)
Approximately 10 ml of each sample was used and measured in 2.5 cm cuvettes. The conical flasks were agitated by hand prior to measurement in order to prevent settling of the algae. These experiments were performed in the batch mode for 9 days as the retention time of the wastewater facultative pond in the sewage ponds at Mysore were about to 9 days. During this period algal species were analysed by OD measurements and also by direct cell counting method for obtaining the cell densities through conventional microscopy. These parameters were kept constant during the growth periods. Environmental Scanning Electron Microscope (ESEM) Quanta was used for imaging of Lepocinclis ovum cells after fixation with glutaraldehyde.
3.1.6 Spectral Signature and Biochemical composition analysis by ATR-FTIR: FTIR spectroscopy was used to study the macromolecular composition of algal biomass during the initial lag phase, the intermediate exponential phase and final stationary phases of the Lepocinclis ovum cell culture. Attenuated total reflectance (ATR-FTIR) spectra were collected on a Bruker Alpha Spec Instrument. The dried algal cells were pressed against the diamond cell prior to scanning. The finely powdered cellular extracts from L ovum sp. were observed for their functionalities in the spectrogram. The spectra were collected in the Mid IR range (128 scans) from 4000 to 800 cm-1 (at a spectral resolution of 2 cm-1) and data were analyzed using Origin Pro 8 SR0, v8.0724 (B724) with an initial base line correction, and scaled upto Amide Imax. The peaks with each of the spectral curves were carefully fitted and calculated. The changes in the carbohydrate, protein, lipids and phosphates of the algal cells were determined from the variations in the intensities of specific bands of the FTIR spectrograms (Giordano et al. 2001; Murdock and Wetzel 2009).
3.2 Lipid Extraction and Analysis:
3.2.1 Lipid Extraction: The algal cells were lysed by sonication using an ultrasonic bath (frequency 35 kHz) for 45 minutes after concentration. The lipids were extracted from the solvent mixture as per modified Bligh and Dyer’s method (1959). One gram of dry algal biomass in triplicates was mixed with a solvent mixture of chloroform and methanol in the ratio of 2:1 (v/v). The organic chloroform layer was separated and was evaporated using a rotary evaporator fixed to a water bath maintained at 60°C. The various lipid classes were separated by thin-layer chromatography (TLC). The solvent system used for elution of lipids was a combination of petroleum ether: diethyl ether: acetic acid in a ratio of 70:30:1 (v/v) (Pal et al. 2011). Bands were visualized after staining the TLC plates with iodine vapours. The triacylglyceride (TAG) layer was immediately and carefully scrapped out and was processed for total lipid extraction. The fatty acids were analysed by methylation of lipid samples using Boron trifluoride-Methanol (BF3-MeOH) where BF3-MeOH converts fatty acids to their methyl esters in a couple of mins. The extracted samples were heated at 60°C for 15 mins followed by cooling in ice-bath for 5mins and then 1ml of water and hexane were added respectively. After settling, the top hexane layer was removed and washed using anhydrous sodium sulphate for further purification. The sample prepared were analysed through the gas chromatography column. The methyl esters formed were assessed via gas chromatography (GC) and identified using mass spectroscopy (MS) on the basis of their retention time and abundance.
3.2.2 Fatty Acid Composition using GC-MS: Fatty acid composition was analysed through gas chromatograph (Agilent Technologies 7890C, GC System) using detection by Mass spectrometry (Agilent Technologies 5975C insert MSD with Triple-Axis Detector). The injection and detector temperature were maintained at 250°C and 280°C respectively (ASTM D 2800). 1µl volume of sample was injected into the column, whose initial temperature was maintained at 40°C. After 1min the oven temperature was raised to 150°C at a ramp rate of 10°C min-1. The oven temperature was then raised to 230°C at a ramp rate of 3°C min-1 and finally it was raised to 300°C at a ramp rate of 10°C min-1 and this temperature was maintained for 2 mins. The methylated sample was loaded onto silica column with helium gas as carrier in split-less mode. The total run time was calculated to be 47.667 min. Fatty acids were identified by comparing the retention time obtained to that of known standards.
3.3 Scope for biofuel as a viable energy source in cities of Karnataka
Estimates indicate that 40,700–53,200 L of oil/ha (max: 3,54,000 L/ha/yr) of biofuel can be produced from algae from different regions having varying insolation capacities (Chisti 2007; Weyer et al. 2009). The density of the oil is about 918 g/l and is similar to the soybean oil (Weyer et al. 2009). Yield of conversion of algal crude lipid to biodiesel is about 70-90% (Amin, 2009) and a maximum of 98% (Chisti 2007). The heating value of the algal oil is about 42 GJ/tonne (Amin 2009). Energy demand for regional transportation sector in Karnataka state has been compiled from the published government reports (Energy Report, 2003).
3.3.1 Distribution, Morphological features and cellular characteristics of L. ovum
Lepocinclis ovum indicative of higher organic loads (Affan et al. 2005) are unicellular flagellates belongs to the class Euglenozoa. During the study periods L ovum species were found at a lower N:P ratio ranging from 3.6-5.2, at a considerable organic load and at slightly acidic pH.
The body of the cell is more or less oval and sometimes cylindrical and chloroplasts are numerous and discoidal in shape. Many storage bodies i.e. paramylum were observed which were large (6-8 μ) and ring shaped. The cells were 80-100 μ size in dimensions. These characteristics are provided in the Table 10. These species normally found at lagoons, wastewater treatment lagoons, ditches, swamps, tanks and reservoirs, small ponds, shallow sea bays, acidic lakes (Wollman et al. 2000), brakish waters (John et al. 2002) and also in well aerated systems with moderate organic loads (Subakov-Simic et al. 2008). In the present study these species were predominant in wastewater regions with higher organic regimes lagoons.
Cell characteristics
|
Values
|
Cell count (C): |
8.74 x 10⁵ cells/ml |
Cell shape: average ratio of length to width of individual cells |
round: diameter 80-100μm |
Cell Volume: the real volume of a million cells, in mm3 |
33493 μm3 |
Packed Cell Volume (Vc): centrifuged volume in ml of the cells contained in 1 l. of the sample after centrifugation at 5000 rpm |
2.5 ml |
Cell weight: dry wt. of the cells in μg per million cells |
0.48 mg/million cells |
Cell density: dry wt. of the cells in mg/m3 of real volume |
640 X 103 mg/m3 |
Cell Index: the packed volume per million cells (Vc/C) |
2.86 X10⁻³ m3 |
Cell colour: |
Pea green to bottle green |
Cell types (stages): |
Round, Ovoid (mature) |
Cell storage product: |
Starch: paramylon bodies (ring shaped) |
Bio-volume: volume of cells compared to volume of water they are occupied in 1 μm3. |
0.03 μm3 |
C(%): content in g/100 g of the cell dry wt. |
34.99 |
N(%): content in g/100 g of the cell dry wt. |
3.98 |
P(%): content in g/100 g of the cell dry wt.
|
0.94
|
Table 10: L. ovum cellular characteristics in wastewaters
3.4 Nutrient requirements and growth conditions:
3.4.1 Nutrient concentrations and L. ovum growth at wastewater treatment units: A slightly lower pH values during the sampling period were conducive for the predominance of L. ovum. However, with an increase in pH, the algal species richness generally increases, while diversity and abundance are low at lower pH (Wollmann et al. 2000).
Their intensive growth of L. ovum is indicative of its ability to grow at lower pH with higher organic loads. The very high count is due to lower wash-out rate with the longer retention period of the facultative ponds (10 days). In addition, under higher organic loads some Euglena sp. (e.g. Euglena gracilis) through heterotrophy influences H+ concentration resulting in a marked decrease in water pH (Yamane et al. 2001). The lower DO levels has related to more of oxygen demanding materials such as algal biomass, dissolved organic matter (DOM), ammonia and sediment (Sanchez et al. 2007; Mahapatra et al. 2011a,b,c). Euglenoides can thrive in hypoxic, anoxic and anaerobic environments as they are facultative anaerobic genera (Castro-Guerrero et al. 2005) and decrease in the hypoxic conditions. (Moreno-Sanchez et al. 2000). Higher anoxygenic photosynthesis and high algal biomass for mixotropic culture of euglenoides reported here is similar to the earlier reports (Rosenberg 1963; Yamane et al. 2001; Ruiz et al. 2004). It is observed that the euglenoides were present in both anoxic and hypoxic conditions and this could be result of the switch over of the mode of metabolism. Similar cases have been also found in earlier studies (Tittel et al. 2003).
The physico-chemical parameter of the growth environment of L. ovum in wastewaters is provided in Table 11. Among the various habitat parameters analysed the pH, dissolved oxygen were lower. The concentration of soluble orthophosphates reached 8.37 mg/l. The phosphorus is one of the most important nutrients which regulates/limits the algal growth. Higher growth of L. ovum species should involve higher uptake rates of phosphorus that should decrease the P concentration. But because of anoxic conditions the sediment bound P might have been released (Donnelly et al. 1998) that would be available to the euglenoides which was observed in the present study. Higher concentrations of N species as Ammonium-N play a major role in the proliferation of euglenoid species (Duttagupta et al. 2004). A number of studies conducted earlier reveals that water bodies with high levels of organic compounds, e.g. fish or sugar factory ponds (Lungu and Obuh. 2004); municipal and Diary wastewaters (Bernal 2008), industrial wastewaters (Veeresh et al. 2010) had high population densities of euglenoids. The lower N:P (3.6-5.2) suggests P accumulation in the systems and is indicative of N limiting conditions.
Parameters
|
Mean
|
+ St Dev
|
pH |
7.03 |
0.20 |
Temperature (0C) |
24.60 |
2.68 |
Elec. Conductivity (µS/cm) |
1117.40 |
277.70 |
Total Dissolved Solids (mg/l) |
649.33 |
156.02 |
Total Suspended Solids (mg/l) |
588.00 |
56.00 |
Turbidity (NTU) |
213.21 |
43.44 |
Dissolved Oxygen (mg/l) |
0.22 |
0.35 |
Free CO2 (mg/l) |
38.59 |
12.88 |
COD (mg/l) |
374.50 |
24.48 |
BOD (mg/l) |
262.58 |
33.29 |
Nitrates (mg/l) |
0.43 |
0.08 |
Ammonia (mg/l) |
58.00 |
14.00 |
TKN (mg/l) |
77.00 |
12.00 |
Phosphates (mg/l) |
8.73 |
1.26 |
Total Phosphates (mg/l) |
12.20 |
4.60 |
Alkalinity (mg/l) |
370.00 |
77.90 |
Total Hardness (mg/l) |
287.00 |
97.66 |
Calcium (mg/l) |
68.00 |
15.00 |
Magnesium (mg/l) |
26.00 |
6.60 |
Chlorides (mg/l) |
176.16 |
116.35 |
SAR |
18.75 |
3.79 |
TOC (mg/l) |
102 |
5.9 |
Sodium (mg/l) |
274.02 |
42.04 |
Potassium (mg/l) |
26.75 |
13.02 |
ORP (mV)
|
-141.33
|
66.48
|
Table 11: Physico-chemical parameters of the growth environment of L. ovum
Euglenoides are well known for their sustained heterotrophic growth in the dark conditions (Ogbonna and Tanakaah. 1998). It is observed that the regions with higher nutrient concentrations had higher euglenoid cell densities. Electrolyte concentrations during the higher growth periods were moderate (Table 11). It has been reported L. ovum occurrence at a very high salinity (i.e. > 3000 mg/l) and higher alkaline conditions (Wen and Zhi-Hui. 1999). This suggests the variability of the habitat and environmental conditions favourable for L. ovum in lagoons with varying conditions which help in the nutrient recovery while accumulating lipid. Peptones are necessary as nitrogen sources in the darkness (Lwoff 1932) and studies have revealed that the euglenoides like E anabaena and E deses grows with inorganic N and E gracilis can selectively take both inorganic and organic sources as N source (Schoenborn 1942). In the present study the euglenoides were found in the anoxic regions and are anticipated to feed on peptone type of protein i.e. N sources from the wastewaters.
3.4.2 Monitoring of algal growth: Algal growth studies were monitored through optical density (OD) measurements at 658 nm. Growth of biomass (OD) were measured daily with the spectrophotometer. OD values showed that there was a considerable increase in the algal density with time (Figure 6). The maximum algal growth was found to be 470 mg/l at the end of the 7th day. L. ovum species grown in the wastewater media was under the lag period for the initial 3 days (due to the change in the growth environment), which picked up from the 4th day onwards, evident from a rapid growth of cell mass and an increased cell density due to better acclimatisation and nutrient uptake. In contrary, algae grown in Chu media has higher lag period and the biomass increased during the 5th and the 6th day. Similar studies using Chu media report maximum growth of 400 mg/l for Botryococcus bauni after the 11th day in batch systems (Sayamaya et al. 1994). The growths of the algae were highest during the 7th day (3.67 x 10⁵ cells/ml - OD 0.475), which started decreasing during the 8th day. Studies with Chlamydomonas reinhardti grown in the influents, centre and effluents of municipal wastewaters showed higher biomass productivities of 2g/day (OD - 2.5) with the peak cell concentrations of 5.4 x 10⁷ cells/ml in flask cultures with the cells reaching their exponential stage at the 7th day (Kong et al. 2010). Algal cultures grown in Chu media show the highest densities during the 6th day after which the densities started to decrease steeply which could be attributed to lack of organic carbon in the medium. Studies have also reported reduced cell densities of Haematococcus pluvialis cultured in Chu media compared to the other media’s (Fabregas et al. 2000).
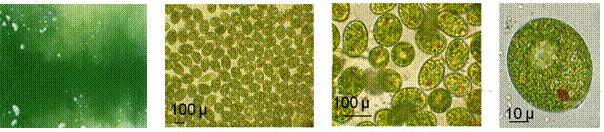 Figure 6: a) L. ovum proliferation in the facultative ponds, b), c) and d) shape, size and densities of L. ovum Figure 6: a) L. ovum proliferation in the facultative ponds, b), c) and d) shape, size and densities of L. ovum
Comparison of cell densities of algae grown in Chu and wastewater with the control is given in Fig. 7. During the initial periods after the cell inoculations, the algal cells increased faster in the Chu media due to changes in the environment and nutrient conditions. During the lag phases the cells were in clumps (i.e. attached to each other) due to mucilaginous secretions under stress conditions. Cell densities were higher on 6th and 7th day, with a higher biomass index due to high density of matured population.
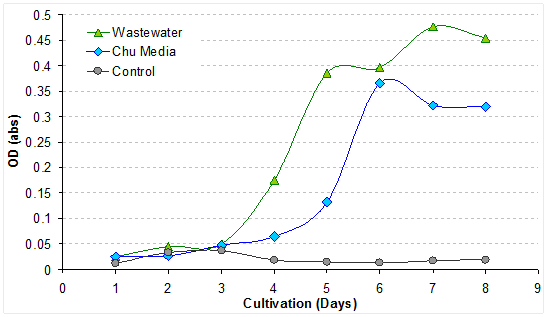 Figure 7: Comparative assessment of cell densities in diverse media Figure 7: Comparative assessment of cell densities in diverse media
The FTIR spectrum of Lepociclis ovum biomass at initial stages of the culture (lag phase), intermediate stages (exponential phase) and final stages (stationary phase) are illustrated in Figure 8. The region 3300–3000 cm-1 is characteristic for C-H stretching vibrations of C≡C, C=C and some aromatic hydrocarbons on the other hand the regions between 3000–2700 is assigned for C-H stretching vibrations of >CH2, -CH3, C-H and CHO functional groups (Giordano et al. 2001; Sigee et al. 2002; Dumas and Miller. 2003). The bands present between 3600–3300 cm-1 are due to the presence of unsaturates (olephinic C-H stretching vibrations). The band present at ~1640 cm-1 indicated the presence of C=O of lipids/esters (Sigee et al. 2002; Stehfest et al. 2005). The bands between 1700-1500 cm-1 indicates proteins. As depicted in Fig. 8, peaks at ~1640 are characteristics of Amide I bands (Dumas and Miller. 2003), and it due to C=O stretching vibrations of peptide bonds (Backmann et al. 1996). These bands provide essential information’s regarding the secondary structure of proteins (Fischer et al. 2006). The peaks ~1540 are for Amide-II bands, attributed to N-H bending vibrations in Proteins (Fischer et al. 2006). The cluster of peaks ~1357-1423 are attributed to the Amide III bands. The bands present ~1245 cm-1 is for the phosphates and polyphosphates present in the algal cells (Stehfest et al. 2005). The wave numbers from 1200–900 cm-1 indicates stretching vibrations of polysaccharides due to C-C, C-O, C-O-C stretch (Ye et al. 2004) and rocking vibrations of CH3 and CH2. The presence oh bands ~ 2925 and 2855 cm-1 are indicative of asymmetric and symmetric CH2 starching in lipid.
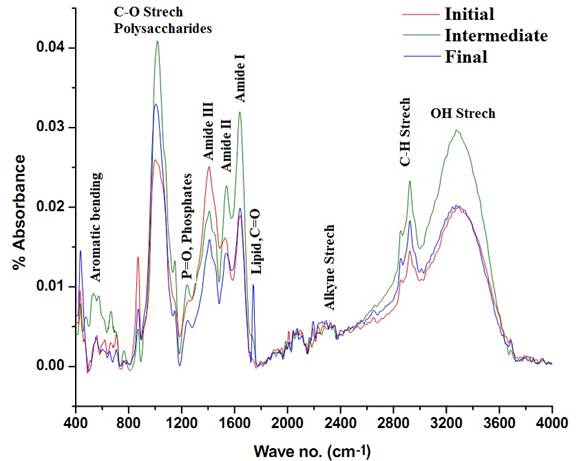
Figure 8: FTIR spectra of various stages of the cell growth
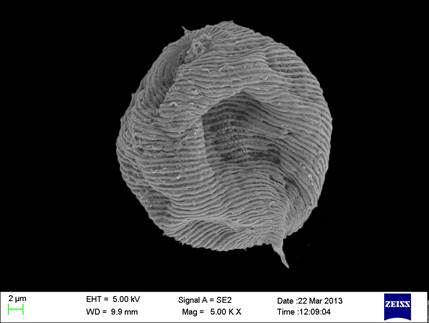
Figure 9: SEM image of L ovum
No. |
Initial
Lag Phase |
Intermediate Exponential Phase |
Final
Stationary Phase |
Wave no. range (cm-1) |
Main Groups |
Band Assignments |
Intensities |
Wave no.
(cm-1) |
Intensities |
Wave no.
(cm-1) |
Intensities |
Wave no.
(cm-1) |
1 |
0.01997 |
3295 |
0.02972 |
3275 |
0.02027 |
3274 |
3029-3639 |
OH
Amide A |
Water ν (O-H) stretching
Protein ν(N-H) stretching (amide A) |
2 |
0.01418 |
2922 |
0.02329 |
2923 |
0.01831 |
2925 |
2809-3012 |
C-H |
Lipid – Carbohydrate
Mainly νas(CH2) and νs(CH2) stretching |
3 |
0.00101 |
1732 |
0.00368 |
1732 |
0.01032 |
1740 |
1763-1712 |
Lipids |
Fatty Acids ν(C=O) stretching of esters |
4 |
0.01896 |
1640 |
0.03198 |
1639 |
0.01988 |
1640 |
1583-1709 |
Amide I |
Protein amide I band :Mainly ν(C=O) stretching |
5 |
0.01613 |
1527 |
0.02267 |
1540 |
0.01421 |
1535 |
1481-1585 |
Amide II |
Protein amide II band mainly δ(N-H)
bending and ν(C-N) stretching |
6 |
0.02511 |
1408 |
0.01952 |
1409 |
0.01596 |
1411 |
1357-1423 |
Amide III |
Protein δas(CH2) and δas(CH3) bending of methyl,
Lipid δs(N(CH3)3) bending of methyl |
7 |
0.00824 |
1256 |
0.01027 |
1242 |
0.00579 |
1245 |
1190-1350 |
Phosphates |
Nucleic Acid (other phosphate-containing compounds as phospholipids) νas(>P=O) stretching of phosphodiesters |
8 |
0.02596 |
1001 |
0.04088 |
1017 |
0.03295 |
1006 |
980-1072 |
Saccharides |
Carbohydrate ν(C-O-C) of polysaccharides |
νas : asymmetric stretch; νs: symmetric strech; δas: asymmetric deformation; δs: symmetric deformation
Table 12: Bandassignments for infrared spectra based on Giordano et al. (2001); Sigee et al. (2002); Benning et al. (2004); Stehfest et al. (2005) and Dean et al. (2007; 2010)
During the culture experiment, the initial lag phase showed lower absorbances in the polysaccharide region (1001 cm-1) and amide I (1640 cm-1) and II (1527 cm-1)regions due to constraints in acclimatisation, the absorbance intensities are illustrated in Table 12 and depicted in Figure 8. During this stage the cells just begin to grow and multiply. A very small peak was observed in the band corresponding to lipids (1732 cm-1) in the culture systems. The observations made during the exponential stages of the growth showed higher absorbances for polysaccharides, proteins especially Amide I and II, phosphates, and a slight increase in the lipid content as provided in Figure 8 and Table 12. However, during the stationary phase i.e. final stages, a distinct lipid band (~1740 cm-1) was observed indicating lipid accumulation. The comparison of band intensities shows a conversion of carbon from carbohydrates and proteins to lipids. This is evident from the decreased intensities of polysaccharides and proteins. The major reasons for lipids accumulation at the later stages of growth is N and P limitation. This is in agreement with other studies (Sigee et al., 2002; Stehfest et al. 2005; Dean et al. 2007). There was not much of a change in Amide I bands when the lag phases were compared with the final stages of algae during the growth. The protein content significantly decreased from the exponential stages to the final starvation stages indicating N stress that could be a possible reason for lipid accumulation. Marked changes in the intensities were observed at the various stages of cell culture indicating variable nutrient uptake, assimilation and accumulation. The SEM image of L ovum is depicted in Figure 9.
3.4.3 Lipid composition by GC MS Analysis: Total lipid content of L. ovum is 18.4+1.04 % which is relatively lower compared to the earlier reports with euglenoides (Constantopoulos and Bloch, 1967). Algal species grown in batch mode in the wastewater has a total lipid content (of oil content):
- 31% in Scenedesmus obliquos grown in secondary treated municipal wastewaters (Martinez et al. 2000);
- 25.25% in Chlamydomonas reinhardti when cultured in the all stages of municipal wastewaters (Kong et al. 2010);
- 18% in Botryococcus brauni in municipal wastewaters (Orpez et al. 2009);
- 9% in mixed population Scenedesmus sp. followed by Micracitinium sp., Chlorella sp. Actinastum sp. in primary treated wastewaters (Woertz et al. 2009).
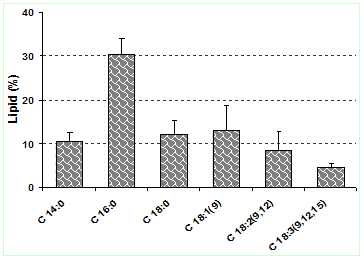
Figure 10: Comparative account of the major fatty acid composition in L. ovum
CN:U |
Fatty acid methyl esters |
Peak Area |
Corr. Area |
Corr. %max |
Retention time |
%Comp. |
C 10:0 |
Decanoic acid, methyl ester |
22363 |
60004 |
0.31% |
14.137 |
0.09% |
C 11:0 |
Undecanoic acid, methyl ester |
35981 |
87061 |
0.45% |
16.561 |
0.14% |
C 12:0 |
Dodecanoic acid, methyl ester |
186635 |
527647 |
2.73% |
19.01 |
0.83% |
C 13:0 |
Tridecanoic acid, methyl ester |
611028 |
2006749 |
10.37% |
22.054 |
3.14% |
C 14:0 |
Methyl tetradecanoate |
1795343 |
6625155 |
34.24% |
25.291 |
10.38% |
C 15:0 |
Pentadecanoic acid, methyl ester |
1438245 |
5578805 |
28.83% |
28.537 |
8.97% |
C 16:0 |
Hexadecanoic acid, methyl ester |
622964 |
2439440 |
12.61% |
31.038 |
30.32% |
C 16:1(7) |
7-Hexadecenoic acid, methyl ester |
54675 |
213817 |
1.11% |
31.791 |
0.34% |
C 16:1(9) |
9-Hexadecenoic acid, methyl ester |
4012960 |
9349604 |
0.00% |
31.791 |
3.82% |
C 17:0 |
Heptadecanoic acid, methyl ester |
217340 |
1333190 |
6.89% |
34.836 |
2.09% |
C 17:1(10) |
cis-10-Heptadecenoic acid, methyl ester |
372136 |
1428305 |
7.38% |
34.069 |
2.24% |
C 18:0 |
Octadecanoic acid, methyl ester |
1028784 |
4427325 |
22.88% |
36.861 |
12.05% |
C 18:1(9) |
9-Octadecenoic acid , metyl ester |
1875793 |
7746598 |
40.03% |
37.217 |
12.94% |
C 18:2(9,12) |
9,12-Octadecadienoic acid , methyl ester |
249646 |
958305 |
4.95% |
37.478 |
8.44% |
C 18:3(9,12,15) |
9,12,15-Octadecatrienoic acid, methyl ester |
705164 |
2881726 |
14.89% |
37.071 |
4.52% |
|
|
|
|
|
|
|
Saturated fatty acids (Saturates) |
68.01% |
Mono-enoic fatty acids (Mono-unsaturated fatty acids) |
19.34% |
Poly-enoic fatty acids (Poly-unsaturated fatty acids) |
12.96% |
C16-C18 (fatty acids important from Biodiesel perspective) |
72.94% |
Total lipid content |
18.48% |
Table 13: Fatty acid profile of L. ovum through GC, MS analysis
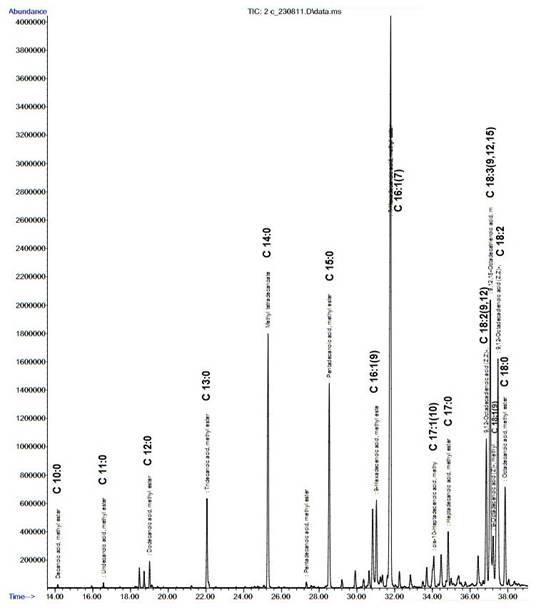
Figure 11: Chromatogram depicting peaks of major fatty acids in L. ovum
Compared to these, the lipid content of Chlorella sp. grown in a semicontinuous mode in wastewaters was 42% with an effective COD, NH3-N and P removal (Feng et al. 2011). FAME was separated according to the retention times in the column. The proportion of each fatty acid were calculated based on the peak area (area under the curve) and provided in Table 13, which illustrates the composition of the fatty acid (saturates and un-saturates). The total saturated fatty acids (68.1%), monounsaturates (19.34%), polyunsaturates (12.96%) and fatty acids (72.94%) reflect properties of biodiesel. Important fatty acids from biofuel perspective of L. ovum using the ultra-sonication techniques are given in Fig. 10. The present analysis showed 15 different types of fatty acids .The fatty acid composition has higher percentage of palmitic acid [C16:0] 30.32% > oleic acid [C18:1(9)] 12.94% > stearic acid [C18:0] 12.04% > methyl tetradecanoate [C14:0] 10.38% > pentadecanoic acid [C15:0] 8.97% > linoleic acid [C18:2(9,12)] 8.44% > linolenic acid [C18:3(9,12,15)] 4.52 %. These results are in agreement with earlier studies (Knoth 2008), with palmitic acid (C16:0), stearic acid (C18:0), oleic acid (C18:1), linoleic acid (C18:2) are the most common fatty acids for providing a reasonable balance of fuel properties. The chromatogram derived from the gas chromatography and mass spectrogram (GC and MS) analysis of the fatty acids for L. ovum is elucidated in Fig. 11, which highlights the peaks of the fatty-acid methyl esters
These results indicate that L. ovum constitute a better candidate for biodiesel production, due to higher content of requisite fatty acids (68.1 % saturates: Table 13) comparable to biodiesel properties. Similar finding were also reported earlier (Rasoul-Amini et al. 2011), and also algal oils having high polyunsaturated fatty acids with four or more double bonds (Damini et al. 2010). Higher content of saturated fatty acids provides an excellent cetane number (better ignition quality) and oxidative stability to biodiesel (Chinnasamy et al. 2010). The present study reveal appropriate optimisation of euglenoid micro-habitat, development, growth conditions and lipid composition to enhance the net productivity from wastewater systems would ensure a sustained energy supply while treating wastewater at decentralised levels which foster human welfare.
3.4.4 C sequestration in wastewater algae: The average biomass productivity found in the Mysore pond systems ranged from 10-20 g/m2/d and considering the surface BOD loading 400-900 kg/ha/d, the CO2 sequestration potential in the native L. ovum species was calculated to be 1.23-1.48 tonnes CO2e/ha/d providing an annual C sequestration of ~490 tonnes CO2e/ha and from this ~10 tonnesCO2e/ha/yr is the C sequestered and transformed to lipids, that can be used effectively as a biofuel. These unique way of C sequestration and transformation into valorisable algal biomass with ~20% lipids paves path for new avenues for energy sustainability with adequate reduction of wastewater C footprint. The algal communities also create aerobic environment thus abating the formation of methane which is a potential GHG.
3.5 Viability of algae based biofuel as an energy source in Karnataka
The current investigations reveal that resident algal population growing in wastewater systems are not only aiding in treating wastewaters but also ensure reliable substrate for biofuel generation in Mysore being one of the rapidly growing cities in Karnataka generates about 250 Million litres per day (MLD) of sewage (Table 14). Three treatment plants with the installed capacity of 150 MLD are in operation. The conventional wastewater treatment plants face the problem due to lack of assured supply of electricity and also under capacity to handle the increasing load. However, algal population present at various unit processes of the treatment plants i.e. inflows, facultative ponds, maturation ponds and the outflows are aiding in the nutrient uptake or in the treatment. Very high densities of L. ovum were observed in the facultative ponds at a very high surface BOD loading 400-900kg/ha/day with a retention time of 10-12 days. The area required to treat 100 MLD of wastewater is about 20 hectares.
On an average 640 mg of algal dry wt. were derived from 1 lt. of the wastewater and the cells take roughly 7-8 days to reach the exponential growth stage with 4.4 X 10⁵ cells/ml. At such cellular densities the biomass productivities were about 250-300 tonnes/ha/yr and about 18% of the dried algal biomass constitute lipid which is about 40-50 tonnes/ha/annum of lipid from L. ovum. Various studies conducted earlier have estimated the regional or local estimates of the potential of algal biofuel. Studies reveal that after allowing for maximum photorespiration the maximum yields of carbohydrate type molecules is about 410 ton/ha/yr at tropics (Williams and Laurens. 2010), 182 tonnes/ha/yr through culturing diatoms Phaeodactylum tricornitum in bioreactors (Fernanadez 1998) ; 60 tonnes/ha/yr in raceway ponds at subtropics with Pleurochrysis sp. (Moheimani and Borowitzka, 2006); 175 tonnes/ha/yr bioreactor raceway pond systems (Chisti 2007); 50-300 tonnes/ha/yr in closed Photo Bioreactors (Sheehan et al. 1988); 22.87- 137.25 tonnes/ha/yr at about 30-70 % oil on a dry wt. basis (Chisti 2007); 12.6 tonnes/ha/yr for tropical countries, that are comparatively much lower than the optimal estimates (Rodolfi et al. 2008). In a recent study the optimal yields of algal lipids at the tropics were estimated to be as low as 36-45 tonnes/ha/yr (Weyer et al. 2010). The resident algal populations (L. Ovum) isolated from the facultative lagoons with high organic loads which helps in wastewater treatment and also biofuel generation. Replication of these systems in all urbanising towns would aid as low cost option for wastewater treatment while meeting the energy demand at local levels.
For an effective algal growth and year round productivity, the ponds have to be shallow (1 m) to reduce the shading effects caused by the higher cell densities. This requires 2.5 times more area than what is currently being practised as area required for the facultative lagoons. These types of shallow systems will treat wastewaters at the same time generate ample algal biomass for deriving energy. At such high productivities of 250 tonnes/ha/yr, and assuming that entire wastewater treatment and consequent lipid generation would meet the transport and irrigation (diesel pump) energy requirement in rural area, the algal biofuel proves to be a sustainable option. Taking the per capita generation of wastewater as 80%, the daily generation of wastewater is 96 l/day/capita. The wastewater has to travel a certain distance to reach such community/regional algal ponds. As most of the advanced cities of India are connected to under ground drainage (UGD), the chances of wastewater infiltration are low but pilferages cannot be ignored at the source points, during its ways to the treatment units and while joining receiving waters. In case of small cities most of the wastewater generated is adequately allowed to infiltrate in pits and soak ways. The degree of infiltration varies on the nature of soil types. The infiltration is higher with sand and silt type of soils (150 l/m2/d).
Table 14: District wise analysis of the Algal biofuel potential from wastewaters
During this travel approximately 10% of the wastewaters are lost mainly by infiltration and to a smaller extent through evaporation. Accounting for all these losses, the wastewater generated in Karnataka state is around 4931 MLD with the land requirement of 2465 hectares for implementing algae based wastewater lagoons and subsequent lipid recovery. The total wasteland area in Karnataka is about 1.37 million hectares or 2-14% of the total geographical area.
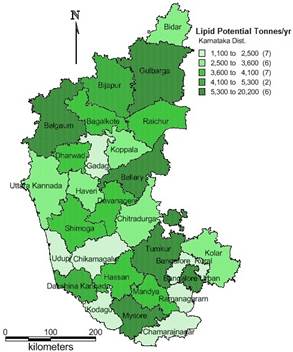
Figure 12: District wise algal lipid potential in tonnes/annum for Karnataka state
District wise total area required for integrated algal pond type treatment cum lipid recovery systems are given in Table 14 for Karnataka – a federal state in India. The percentage of land required for algal lipid production (only from wastewaters) is less than 1% of the total wastelands area required for catering to the entire wastewaters of Karnataka with simultaneous biofuel generation except for Bangalore where the area required for high detention algal ponds is about 6 % of the wasteland. The district wise algal lipid potential derived from wastewaters is elucidated in the Figure 12. This illustrates that Bangalore, Mysore, Belgaum, Gulbarga and Tumkur have higher lipid potential (5000-20,000 tonnes/annum; Figure 12). The petrol and diesel consumption was 5,09,918 and 22,98,370 tonnes (in 2003-2004) respectively (Environment Report. 2003). Estimates show that fuel oil consumption for the transport sectors in the state at present is estimated to be around 30,00,000 tonnes/annum. To meet the energy requirement for the transport sector in the state only 5% of the total wasteland (60,000 ha) area is required to build high detention algal ponds, that paves a way for sustainable biofuel generation and wastewater treatment.
The present studies on resident algal population in the wastewater treatment ponds revealed the dominance of an euglenoid Lepocinclis ovum through mixotrophy (both autotrophy and heterotrophy) at anoxic waters with higher organic loads and ammonium-N concentrations where other algae fails to grow. The species isolated and grown in Chu media, showed lower growth rates compared to the wastewaters that attained its maximum biomass productivity at the seventh day. The total lipid content was found to be 18.6 %. The fatty acid composition showed 68% saturates 18% monounsaturates and 13 % polyunsaturates. The essential fatty acids from the biodiesel perspective were 76% showing the alage as potential qualifier for a biodiesel feedstock. The fatty acid profile of L. ovum demonstrated that palmitic acid (16:0), stearic acid (18:0), linoleic acid (18:1), methyl tetradecanoic acid (14:1) oleic acid (18:1) and linolenic acid (18:3) are major fatty acids of L.ovum, implying the potentials of microalgal lipids for biodiesel.
The evaluation of the resident wastewater algae for the regional energy demand for transport showed positive results. With the current wastewater generation rate about 26.78 tonnes/annum of lipid can be generated from 1 MLD of wastewaters. The land required for the cultivation of wastewater grown algae is calculated to be 0.5 ha/MLD. The lipid potential calculated at the maximum growth conditions was found to be varying between 40-50 tonnes/ha/annum due to seasonal variability’s. The biomass productivities can be further optimised in wastewater ponds to establish a sustainable biomass production process. This resident wastewater algae L. ovum can be grown in the wastewaters of the cities in Karnataka and simultaneously treat the wastewater and generate biofuel to meet the regional energy requirement.
The estimate of the potential of algae to replace vehicle fuels in the Karnataka state shows that an area corresponding to at least 5% of the total wastelands would be required to satisfy current fuel oil demand in the transport corridor. However, future fuel demand is most likely to be met from a combination of algal substrates at the end of each stage of processing by algal bio-refinery approach rather than only wastewaters as a solution.
The potentials of the existing resident wastewater algae, which otherwise cause a nuisance by their prolific outbreaks in eutrophied freshwater can be harvested as resources. The large quantum of terrestrial nutrients (sewage) getting into these waters are a sustainable nutrient feed for the algae for its growth and development. Further investigations have to be carried out to better understand the wastewater ecology, nutrient dependencies, mode of nutrition and the growth microenvironment of the promising microalgae L. ovum and consequently optimising the growth rates and lipid accumulation of these resident algae for integrated wastewater treatment and sustainable bioenergy generation.
Citation : Ramachandra T V and Durga Madhab Mahapatra, 2015. The Science of Carbon footprint assessment, In The Carbon Footprint Handbook (ed: S S Kannan), CRC Press, New York, pp: 3-45.
|