|
The Science of Carbon Footprint
Indirect emissions due to electricity consumption (fossil fuel based energy: coal, gas, oil) in the treatment plants has been considered along with GHG production during the wastewater treatment process. Coal-based power generation has been considered that is the most common in India. The GHG emitted from treatment plants depends on the technology. The wastewater treated in the various treatment plants in the city are also sources of CH4. N2O is formed during the denitrification processes while CO2 results from both aerobic and anaerobic processes. GHG like CO2 are emitted due to a) treatment process and b) electricity consumption. During an anaerobic process the BOD of wastewater is either incorporated into bio-mass or it is transformed into CO2 and CH4. A small quantity of this biomass is further converted to CO2 and CH4 via endogenous respiration. Other emission sources of carbon dioxide are sludge digesters (if operational). But, during aerobic treatment CO2 is produced through the breakdown of organic matter in the activated sludge process and some through the primary clarifiers. CH4 can be produced from wastewater directly and/or from wastewater sludge during anaerobic digestion. The magnitude of methane emission depends on the nature of environment (redox potential), temperature and more importantly on the amount of degradable organic matter in wastewater. N2O gas emanates as a decomposable product of nitrate, urea and proteins. Centralized wastewater treatment systems comprise of variety of unit processes, e.g. ponds, lagoons, and advanced tertiary treatment ranging from lagoons to advanced tertiary treatment technology that might lead to N removal and is then discharged to a receiving waters. Both nitrification and denitrification occurs to some extent during the treatment process. N2O is an intermediate product of both processes, and is more often associated with denitrification.
2.1 GHG emissions for wastewater treatment plant at Bangalore
Bangalore city generates ~1200 million litres per day (MLD) of domestic wastewater that gets either partially treated or untreated and joins receiving surface waters at various locations in the city. The locations of the treatment plants are depicted in Fig. 3 and the details regarding the installed capacity and the technology used is provided in the Table 1. Most of the treatment plants follow an extended aeration or activated sludge process. The estimation of C has been performed based on a general mechanically aerated process set up as shown in Fig. 4.
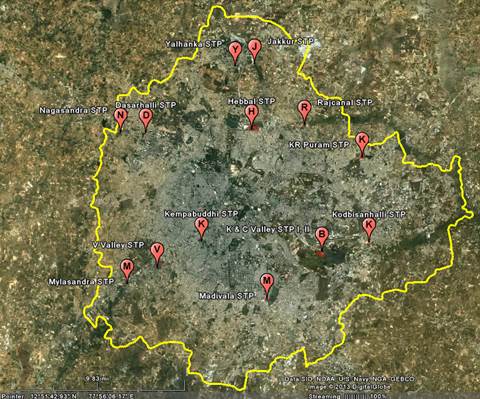 Figure 3: Greater Bangalore and the locations of the existing wastewater treatment plants Figure 3: Greater Bangalore and the locations of the existing wastewater treatment plants
Methods: The quantification of C foot print has been done through field experiments (during 2012-13) and also through GHG protocol (as per IPCC guidelines for National Greenhouse Gas Inventories, 2006). Preparation of GHG inventory involves:
- Organisational boundaries: This includes the wastewater treatment plants and the electricity supply to run the treatment plants
- Operational boundaries: This deals with calculation of emissions associated with the operation/working of the treatment plants
Measuring direct GHG emissions: Here CO2, CH4 and N2O concentration are quantified for the operational wastewater treatment plant. CO2 emissions as an outcome of microbial C transformation during treatment has not been taken into account based on IPCC Guidelines as they are biogenic and not from fossil sources.
Indirect GHG emissions: Here emissions occurring due to import of electricity, steam/gas are accounted and taken into consideration
- Estimation of emissions over time: The GHG emissions have been calculated for twelve months (to account seasonal variations, during 2012-13)
- Quantification of GHG emissions: This was performed as per IPCC Guidelines for National Greenhouse Gas Inventories, (2006) for quantification GHG emissions from wastewater treatment plants.
Sl no.
|
Location
|
Capacity in
MLD
|
Treatment Facility
|
|
Bangalore - CWSS I, II, III stages |
1 |
Vrishabhavati Valley |
180 |
Secondary : Trickling filters |
2 |
K & C Valley I |
163 |
Secondary: Activated sludge process |
3 |
Hebbal Valley |
60 |
Secondary: Activated sludge process |
4 |
Madivala |
4 |
Secondary: UASB + Oxidation ponds + Constructed Wetlands |
5 |
Kempambudhi |
1 |
Secondary: Extended Aeration |
6 |
Yelahanka |
10 |
Activated Sludge process + filtration + chlorination ertiary) |
|
Bangalore – CWSS IV stage, phase I |
7 |
Mylasandra |
75 |
Secondary: Extended Aeration |
8 |
Nagasandra |
20 |
Secondary: Extended Aeration |
9 |
Jakkur |
10 |
Secondary: UASB + Extended Aeration |
10 |
K.R. Puram |
20 |
Secondary: UASB + Extended Aeration |
11 |
Kadabeesananahalli |
50 |
Secondary: Extended Aeration |
12 |
K & C Valley II |
30 |
Secondary: Extended Aeration |
13 |
K & C Valley III |
55 |
Secondary: CMAS |
14 |
Rajacanal |
40 |
Secondary: Extended Aeration |
|
Total |
718 |
|
Table 1: Wastewater treatment plants with their installed capacities and the various treatment technologies used in Bangalore
2.2 Quantification of GHG emissions in treatment plants:
The GHG emissions for the various treatment plants were estimated based on conventional treatment technologies and the energy units consumed during the operation of the treatment plants considering the volume of water (functional unit). The direct GHG emissions were accounted for CO2 generated through organic matter degradation (aerated tanks-aerobic process); CH4 generated from the clarifiers and also from the basins; N2O emissions from the effluent discharge into surface water bodies and the diesel generator used in the treatment units. Indirect emissions were calculated from offsite generation of electric power that is consumed at wastewater treatment plant.
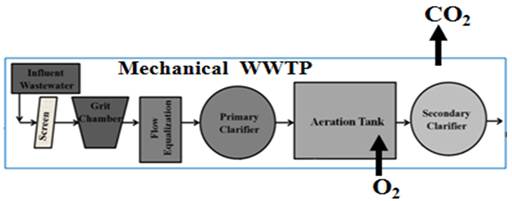 Figure 4: A schematic representation of a mechanical wastewater treatment plant Figure 4: A schematic representation of a mechanical wastewater treatment plant
|
I
|
II
|
III
|
IV
|
City |
Population
(P) |
Degradable organic component (BOD)
(kg BOD/cap/yr) |
Correction factor for industrial BOD discharged into sewers |
Organically degradable
material in wastewater
(TOW) (kg BOD/yr)
IV = I X II X III |
Bangalore |
8,499,399 |
12.41 |
1.25 |
132803109.4
|
Table 2: Estimation of organically degradable material in domestic wastewater
| |
I
|
II
|
III
|
Type of treatment
or discharge |
Maximum methane
producing capacity (Bo)
(kg CH4/ kg BOD) |
Methane correction factor
for the treatment system
(MCFj) |
Emission factor (EFj)
(kg CH4/kg BOD)
III = I X II |
Aerobic |
0.6 |
0.05 |
0.03 |
Table 3: Estimation of methane emission factor for domestic wastewater
|
I
|
II
|
III
|
IV
|
V
|
VI
|
VII
|
VIII
|
IX
|
X
|
Income group (High, Medium & Low) |
Fraction of Population income
group (Ui) fraction |
Degree of utilization (Tij) fraction |
Emission factor (EFj) (kg CH4/ kg BOD) |
Organically degradable material in wastewater(TOW) (kg BOD/yr) |
Sludge removed (S) (kg BOD/yr) |
Methane recovered and flared (R)
(kg CH4/yr) |
Net methane Emissions(CH4)
(kg CH4/yr)
VII= [(IXIIXIII)X(IV-V)]-VI |
GWP for CH4 (IPCC FAR, 2007) |
Total CO2e kg CO2e/yr |
Total CO2e t CO2e/yr |
HI |
0.3 |
0.07 |
0.03 |
132803109.4 |
0 |
0 |
|
|
|
|
|
|
|
|
|
|
|
MI |
0.5 |
0.03 |
|
|
|
|
LI |
0.2 |
0.1 |
|
|
|
|
Avg |
0.333 |
0.066 |
|
|
|
|
|
Total |
|
|
|
|
|
|
86774 |
25 |
2168350 |
2168.35 |
Table 4: Estimation of methane emissions from domestic wastewater
I
|
II
|
III
|
IV
|
V
|
VI
|
VII
|
Population (P) |
Per capita protein consumption
(Protein) kg/person/yr |
Fraction of nitrogen in protein
(Fnpr) kg N/kg protein |
Fraction of non consumption protein (Fnon-con) |
Fraction of industrial and commercial co-discharged protein (Find-com) |
Nitrogen removed with sludge (default is zero) (Nsludge) kg |
Total nitrogen in effluent
(Neffluent)
VII= [(IXIIXIIIXIVXV)]-VI |
8499399 |
0.056 |
0.16 |
1.4 |
1.25 |
0 |
133270.58 |
Table 5: Estimation of Nitrogen in effluent
I |
II |
III |
IV |
V |
VI |
VII |
|
Nitrogen in effluent kg N/ year |
Emission factor (kg N2O-N/kg N) |
Conversion factor of kg N2O-N
into kg N2O |
Emissions from wastewater plants
(default as zero) kg N2O/ year |
Total N2O emissions kgN2O/ year |
GWP for N2O (IPCC, 2007) |
Total CO2e kg CO2e/yr |
Total CO2e t CO2e/yr |
133271 |
0.0005 |
1.57 |
0 |
104.62 |
298 |
31176.76 |
31.18 |
Table 6: Estimation of emission factor and emissions of indirect N2O emissions from wastewater
Total Diesel consumption
(L/year) |
Emission factor (t CO2e/ L)
of diesel |
Total CO2e (t CO2e/ year) |
364000 |
0.00255 |
928.2 |
Table 7: Emissions from diesel generator set during treatment process
Total Electricity (MWH) |
Emission factor
(0.91 t CO2e) |
Total Scope 2 emissions CO2e (t CO2e/ year) |
42200 |
0.91t CO2/MwH |
38402 t CO2e |
*The electricity consumption includes the power required for a) pump station b) clarifiers c) aerators d) control room and e) sludge pump
Table 8: Electricity consumption of the plant
Emission Scopes |
Source |
CO2e Emissions |
Scope I |
CH4 |
2168.35 t CO2e |
|
N2O |
31.18 t CO2e |
|
Generator (Fuel) |
928.2 t CO2e |
Scope II |
Electricity used |
38402 t CO2e |
Scope III |
Not attempted |
|
Total |
|
41529.73 t CO2e |
*Biogenic CO2 - 36135 tCO2 per annum
Table 9: Total emissions of the treatment plants
The estimation of the wastewater C foot print of the present wastewater treatment plants in Bangalore are presented in Tables 2-9. The results show the highest C foot print through emissions by electricity usage i.e. ~38.4 ktonnes CO2e. The total emissions is ~41.53 ktonnes CO2e. CH4 being produced in treatment plants should be captured and used for cogeneration of electricity or can be used as a fuel on site. Though magnitude of N2O generated was comparatively much less than other components due to low nitrification. The CO2 generated during the treatment process is however huge. Considering the entire wastewater volume of Bangalore region as 1200 MLD, the total TOC in city wastewaters is about 180 tonnes/day. Therefore the net CO2 generated in the system is about 99 tonnes/day. This accounts to ~36135 tCO2 per annum. Considering the biogenic CO2 for the foot printing the total C footprint of Bangalore region is ~77665 tCO2e/yr.
Citation : Ramachandra T V and Durga Madhab Mahapatra, 2015. The Science of Carbon footprint assessment, In The Carbon Footprint Handbook (ed: S S Kannan), CRC Press, New York, pp: 3-45.
|